Open Access
Research article
A proposed prognostic 7-day survival formula for patients with terminal cancer
Jui-Kun Chiang
1,2, Ning-Sheng Lai
3,4, Mei-Huang Wang
5, Shi-Chi Chen
1and Yee-Hsin Kao*
6,7Address: 1Department of Family Medicine, Buddhist Dalin Tzu Chi General Hospital, Chiayi, Taiwan, Republic of China, 2Department of Natural Biotechnology, Nanhua University, Chiayi County, Taiwan, Republic of China, 3Department of Allergy, Immunology and Rheumatology, Buddhist Dalin Tzu Chi General Hospital, Chiayi, Taiwan, Republic of China, 4Professor, School of Medicine, Tzu Chi University, Hualien, Taiwan, Republic of China, 5Department of Nursing, Buddhist Dalin Tzu Chi General Hospital, Chiayi, Taiwan, Republic of China, 6Department of Family Medicine, Tainan Municipal Hospital, Tainan, Taiwan, Republic of China and 7Institute of Gerontology, College of Medicine, National Cheng Kung University. Tainan City, Taiwan, Republic of China
Email: Jui-Kun Chiang - [email protected]; Ning-Sheng Lai - [email protected]; Mei-Huang Wang - [email protected]; Shi- Chi Chen - [email protected]; Yee-Hsin Kao* - [email protected]
* Corresponding author
Abstract
Background: The ability to identify patients for hospice care results in better end-of-life care. To develop a validated prognostic scale for 7-day survival prediction, a prospective observational cohort study was made of patients with terminal cancer.
Methods: Patient data gathered within 24 hours of hospital admission included demographics, clinical signs and symptoms and their severity, laboratory test results, and subsequent survival data.
Of 727 patients enrolled, data from 374 (training group) was used to develop a prognostic tool, with the other 353 serving as the validation group.
Results: Five predictors identified by multivariate logistic regression analysis included patient's cognitive status, edema, ECOG performance status, BUN and respiratory rate. A formula of the predictor model based on those five predictors was constructed. When probability was >0.2, death within 7 days was predicted in the training group and validation group, with sensitivity of 80.9% and 71.0%, specificity of 65.9% and 57.7%, positive predictive value of 42.6% and 26.8%, and negative predictive value (NPV) of 91.7% and 90.1%, respectively.
Conclusion: This predictor model showed a relatively high sensitivity and NPV for predicting 7- day survival among terminal cancer patients, and could increase patient satisfaction by improving end-of-life care.
Background
In hospice palliative care, an important issue is the ability to accurately predict the probability of survival of terminal cancer patients with short-term survival. Patients, family members, and providers may desire this information for
their plans and decisions about "pain and distress;" clini- cians may want to improve their prognostic skills [1,2].
When death is near, goals and plans of management often shift and a clinical pathway has been developed to guide care [3]. For example, patients expected to live for 1-2
Published: 29 September 2009
BMC Public Health 2009, 9:365 doi:10.1186/1471-2458-9-365
Received: 16 April 2009 Accepted: 29 September 2009
This article is available from: http://www.biomedcentral.com/1471-2458/9/365
© 2009 Chiang et al; licensee BioMed Central Ltd.
This is an Open Access article distributed under the terms of the Creative Commons Attribution License (http://creativecommons.org/licenses/by/2.0), which permits unrestricted use, distribution, and reproduction in any medium, provided the original work is properly cited.
weeks are incapable of oral fluid intake due to progressive cachexia and show a performance status of more than 3 points in the Eastern Cooperative Oncology Group (ECOG) scale. To improve general quality of life in these patients, simple hydration at 1000-1500 mL/day (400- 600 kcal/day) is not recommended [4]. Prediction of short-term survival is important in the palliative care unit to improve quality of care at the end of life, in Taiwan as elsewhere.
Previous studies have shown that the accuracy of various prognostic scales is overoptimistic. A report of the meta- analysis suggested that survival of patients is typically 30% shorter than predicted in terminally ill cancer patients [5]. Another result from a systematic electronic literature search suggested that Clinical Prediction of Sur- vival (CPS) is more than twice as likely to be overoptimis- tic versus overpessimistic, and to overestimate the length of actual survival by a factor of between 3 and 5 in advanced cancer patients [6]. Those scales are generated according to clinical symptoms and signs, which can vary considerably, although weakness and pain seem to be the most prevalent symptoms [7]. In several major studies, some laboratory parameters have been shown to be capa- ble of providing additional prognostic information [8].
Nevertheless, a simple and accurate predictor for cancer patients is yet to be developed.
Despite a consensus for the need for survival prediction in patients with terminal cancer; both predictors selected and model vary widely. For established prognostic scales, accuracy varies from 0.61 to 0.82, decreasing with shorter survival prediction. Reuben's predicted survival table assesses terminal patients by six symptoms and signs:
Karnofsky Performance Status (KPS), dyspnea, anorexia, dysphagia, xerostomia, and weight loss, with KPS the most important factor. Clinicians can predict a patient with the worst KPS score of surviving 16 days by 50% as well as 72 days by 10% if the other five factors exist. Accu- racy for this model was not calculated [9]. Bruera's Poor Prognostic Indicator depends on three symptoms and signs as prognostic factors: dysphagia, cognitive barriers, and weight loss (refers to 10 kg weight loss within 6 months). Accuracy was calculated based on the PPV and NPV. When terminal patients meet these three prognostic factors, the anticipated survival time, within 4 weeks, is 74% accurate. The sensitivity of the model was 76%, spe- cificity was 71%, PPV was 76%, NPV was 71%, [10].
Morita's Palliative Prognostic Index proposes five inde- pendent prognostic factors: physical function status (modified KPS), eating by mouth, edema, dyspnea, and delirium. When scores are more than six, survival time is less than three weeks with accuracy of 0.82. When scores are more than four, survival time is less than six weeks with accuracy of 0.77. Accuracy was calculated based on
PPV and NPV [11]. Maltoni's Palliative Prognostic Score was developed from patient symptoms and signs, and complete blood count. This scale consists of six prognostic factors (e.g., dyspnea, anorexia, KPS, total white blood cell count and lymphocyte percentage, and clinical prediction of survival by experienced physicians). Maltoni found that the scale was as accurate as prediction by an experienced physician [12], with greatest accuracy from a combination of subjective prognostic judgements and objective vali- dated tools [13].
Most recently, Chow's predictive model [14], Stone's prognostic scale [15], Chuang's prognostic score [16] and Bozcuk's intrahospital cancer mortality risk model [17]
were developed to predict survival, and the latest three are for short-term survival. Of these, Chow's predictive model of the three-variable number of risk factors (NRF) -- non- breast cancer, metastases other than bone and Karnofsky performance score <6_0 -- is clinically simple and user- friendly. For 3-month survival, this model estimates prob- ability of patients with NFR ≤ 1, NFR = 2, NFR = 3 were 83%, 76%, and 44% respectively, in external validation set. In this model, all subjects were attending a palliative radiotherapy clinic. Stone's prognostic scale uses four var- iables: primary lung cancer, secondary liver cancer, C-reac- tive protein, and poor performance status (ECOG = 4) to predict 14-day survival. Stone's prognostic scale would have more value for identifying those patients not suitable for hospice admission, due to high predictive value (85%), and low positive predictive value (PPV) (39%). By contrast, Kelly's model suggested C-reactive protein as the simple prognostic indicator in patients with advanced cancer [18].
Chuang et al. constructed a prognostic scale with units including liver and lung metastasis, ECOG, weight loss, edema, cognitive impairment, fatigue, and ascites. Accu- racy was directly derived from PPV and NPV. When the cutoff score was >6.0, PPV and NPV for patients with sur- vival time < 1 week were 0.75 and 0.70 in the training set (accuracy, 0.72). For the testing set, values were 0.43 and 0.76, respectively (accuracy, 0.66) [10]. Bozcuk's intrahos- pital cancer mortality risk model predicted the probability of terminal cancer patients dying within 8 days. The scale was constructed based on predictors including ECOG score, duration of disease, emergency admission, Hb count and LDH level. Accuracy was expressed by ROC area (AUC). In the retrospective cohort, this model had an ROC area of 0.88 (P < 0.001, 95% CI: 0.84-0.92), whereas in the prospective cohort, it yielded an ROC area of 0.82 (P < 0.001, 95% CI: 0.73-0.90) [17].
Research has indicated that the rate of survival of less than 7 days in patients in hospice wards is about 15% [19]. In Taiwan, where patients with terminal cancer are referred
to hospice for palliative care late in the course of their dis- ease, the figure is approximately 30% [20,21]. In one Tai- wanese study, only 3.5% of patients referred late in the course of the disease to hospice care lived longer than 180 days [21]; in Italy, a prospective cohort study showed that referral of cancer patients to palliative, end-of-life care tends to occur late in the course of the disease [22].
In Taiwan, between 2000 and 2004, the rates of late refer- rals for hospice care as a whole were 25.3%-28.9%, which were lower than the national statistics from the United State (35.1%), but higher than other published study reports (15.6%-20%) [23]. Furthermore, evidence sug- gests that late hospice referral increase the risk of a major depressive disorder in the first year of bereavement [24].
When patients were enrolled in hospice for less than 7 days, the hospice team often did not have adequate time to become familiar with patients and their home situa- tion. The goal for comprehensive care (including the patients' wish such as to die at home) might become impossible to fulfill [25]. Part of the explanation for late referral can be attributed to difficulties in establishing an accurate prognosis [26].
In Taiwan, hospice care includes inpatient hospice care and hospice home care. In Taiwan, in 2004, overall utili- zation of hospice care is 15.4%, and hospice home care only is 2.6%, inpatient hospice care only is 10.1%, and both home care and inpatient care is 2.8%. Our study was inpatient hospice care [23].
Palliative care seeks to fulfill the needs of patients at the end of life. Ascertaining and carrying them out (e.g., the desire to die at home) requires the ability to predict short term survival. This study aimed to develop a validated model for 7-day survival prediction for terminal cancer patients to make more accurate prediction of short-term survival in order to facilitate timely referrals to palliative care as well as comprehensive care for terminally cancer patients.
Methods Participants
We conducted a prospective observational cohort study for patients with terminal cancer. Of 727 terminal cancer patients from a hospice ward admitted from November 2004 to June 2007 in the Buddhist Dalin Tzu Chi General Hospital, the first 374 diagnosed with terminal cancer were chosen as the training group by which we would develop a prognostic measurement. The same measures were tested on the next 353 patients, the validation group.
For the training group, number of admission during the study period was 415 cases, of which 374 cases were enrolled (91%). For the Validation group, the number of admissions during the study period was 430 cases, of
which 353 cases were enrolled (82%). Overall percentage of enrollment was 86%. Most cases not enrolled were due to admission during a holiday or weekend.
Inclusion criteria were terminally ill cancer patients admitted to the palliative care unit at our hospital who were referred from other wards of the same hospital, from other hospitals or from home. All patients enrolled met with normative standards of hospice palliative enactment in Taiwan. Excluded were patients referred to other hospi- tals, since we could not accurately assess their complete records. Patient recruitment and study design were approved by the Institutional Review Board of Buddhist Dalin Tzu Chi General Hospital (Nos. B09303011 and B09502017). All patients gave their informed consent before being entered into the study. For those uncon- scious patients, we obtained proxy consent from relatives.
Data collection
Data on demographics, clinical symptoms and signs and their severity, laboratory test results, and subsequent sur- vival were collected by an experienced hospice team (comprising physicians and registered nurses) within 24 hours of hospice admission. When verbal communication with any patient was difficult due to the cognitive impair- ment, interviewers assessed these patients' status with their family caregiver. The proportion of unconscious patient in training group was 4.8%. (cognitive impair- ment = 3, 18/374 = 4.8%) and the proportion of uncon- scious patient in validation group was 8.2% (cognitive impairment = 3, 29/353 = 8.2%).
Almost all clinical symptoms and signs were collected according to those identified in previous studies [27-29].
Eighteen symptoms and signs were assessed, including pain, dyspnea, tiredness, heart rhythm (irregular versus regular), poor appetite (<500 cc of milk or <2 bowls of porridge by mouth or tube feeding within 24 hours of admission), medication for insomnia, nausea, vomiting, constipation, edema (scored as 0 = no; 1 = less than 1/2 finger breadth; 2 = 1/2 - 1 finger breadth; and 3 = >1 finger breadth), ascites (scored as 0 = no; 1 = only by ultrasound;
2 = shifting dullness by physical examination; 3 = umbil- ical protrusion), jaundice (scored as 0 = no; 1 = slightly yellowish; 2 = remarkably yellow; and 3 = deeply yellow or greenish), cognitive status (scored as 0 = clear; 1 = leth- argy; 2 = confusion; 3 = comatose), performance status score according to the ECOG (range: 1-4), fever (core tem- perature ≥ 37.5°C), pressure sores, mean muscle power (sum of muscle power of each extremity divided by four, muscle powers graded using the Medical Research Coun- cil (MRC) scale of 0-5: 5 = normal power, 4 = moderate movement against resistance, 3 = movement against grav- ity but not against resistance, 2 = movement with gravity eliminated, 1 = flicker of movement, 0 = no movement),
naso-gastric tube, and intervention tube placement (e.g., percutaneus nephrostomy (PCN), percutaneous transhe- patic cholangio drainage (PTCD), pig tail for pleural effu- sion or ascites drainage, jejunostomy tube and percutaneous endoscopic gastrostomy tube). An addi- tional 12 laboratory items were examined: complete blood count (e.g., white blood cell (WBC) count (normal range: male: 3.8-9.8*103/μL, female: 3.6-9.6*103/μL) and differential percentages, hemoglobin (normal range:
male: 13-18 g/dL, female: 12-16 g/dL), and platelet (nor- mal range: 120-320*103/μL); and biochemistry examina- tion: blood urea nitrogen (BUN) (normal range: ≤20 mg/
dL), creatinine (normal range: ≤1.2 mg/dL), serum glutamic oxaloacetic transaminase (SGOT) (normal range: ≤38 IU/L), serum glutamic pyruvate transaminase (SGPT) (normal range: ≤41 IU/L), total bilirubin (normal range: ≤1.0 mg/dL), albumin (normal range: 3.4-4.8 g/
dL), corrected calcium (normal range: 2.1-2.55 mmol/L), and blood sugar (normal range:70-110 mg/dL). Duration of survival days, which was defined as the period (in days) from the date of a hospice ward admitted to the date of death, or the end of follow-up, were also recorded.
The research team extracted independent prognostic fac- tors from the 375 patients in the training set to establish a predictor model and then employed that predictor model to test the 353 patients in the validation group. The end- point consisted of factors associated with the patient's expectation of dying within 7 days.
Data Analysis
Comparability between the 2 groups was tested using Mann-Whitney-U test for skewed variables and Chi- square test for categorical variables. Nonparametric varia- bles were represented as median (inter-quartile range) and categorical data were represented by number (n) and percentage (%). The survival rates were calculated by the Kaplan-Meier method and the differences between the survival curves were examined by the log-rank test. Uni- variate logistic regression analysis was performed to ana- lyze the odds ratio of significant factors associated with patients who expired within 7 days. Variables having a p value < 0.05 in the univariate analysis were selected and evaluated by multivariate logistic regression models. Fur- thermore, a receiver operating characteristic (ROC) curve was employed in the training group to obtain the area under the curve (AUC), sensitivity, specificity, PPV and negative predictive value (NPV). All statistic assessments are two sided and evaluated at the 0.05 level of signifi- cance. Statistic analyses were performed using SPSS 15.0 statistics software (SPSS Inc, Chicago, IL).
Results
The demographic characteristics of the training and vali- dation groups are shown in Table 1. The training group
had a median age of 67 (inter-quartile range = 58, 75);
lung cancer was the most common diagnosis cancer (20.6%), 51.1% received chemotherapy as the most fre- quent type of treatment and the group was 61.0% male.
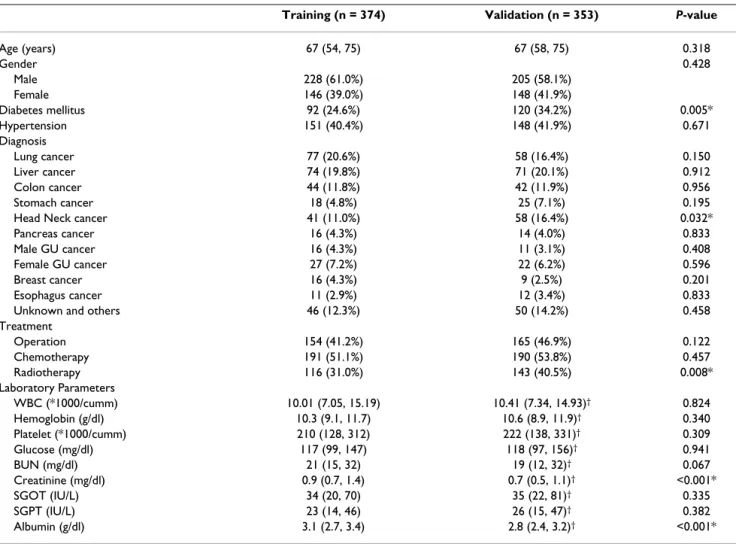
The validation group had the same median age of 67 (inter-quartile range = 58, 75); liver cancer was the most common cancer diagnosis (20.1%), 53.8% received chemotherapy as the most frequent type of treatment and the group was 58.1% male. The groups were statistically significantly different in frequency of diagnosis of diabe- tes mellitus, incidence of head neck cancer, having radio- therapy treatment, and level of creatinine and albumin (P
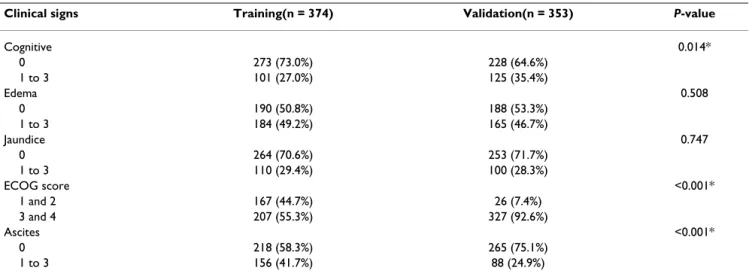
< 0.05). The survival rates were significantly different between the training and validation groups. The median survival dates were 17 and 22 days for the training and validation groups, respectively (Figure 1). Table 2 shows the prevalence of significant clinical signs by severity. The training and validation groups differed significantly in cognitive status, ECOG score, and ascites (P < 0.05).
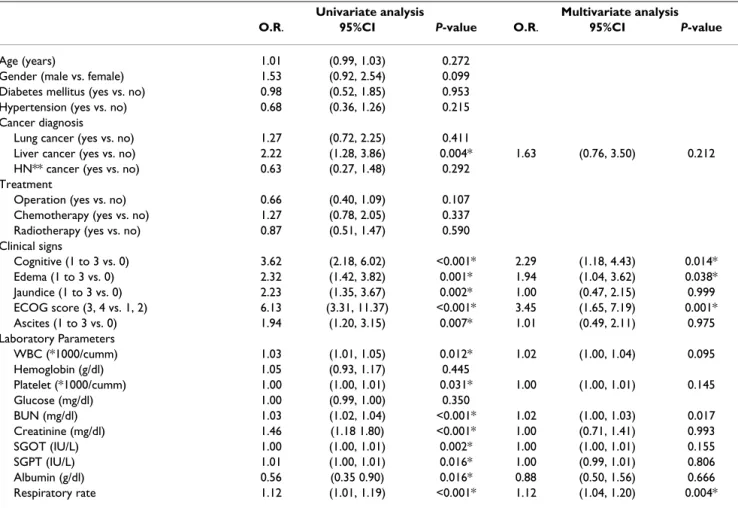
Table 3 presents the results of univariate and multivariate analysis of determinants of whether a patient would die within the next 7 days. The univariate logistic regression model indicated the following prognostic factors: diagno- sis of liver cancer, cognitive status, edema, jaundice, ECOG score, ascites, WBC, platelet, BUN, creatinine, SGOP, SGPT, albumin level and respiratory rate (P <
0.05). Variables having a P value < 0.05 in the univariate analysis were selected and evaluated by multivariate logis- tic regression models. Multivariate logistic regression indi- cated that cognitive status (1 to 3 vs. 0, OR: 2.29, P = 0.014), edema (1 to 3 vs. 0, OR: 1.94, P = 0.038), ECOG score (3 and 4 vs. 1 and 2, OR: 3.45, P = 0.001), BUN and respiratory rate (on a linear scale, OR: 1.12, P = 0.004) were significantly associated with the likelihood of patients dying within 7 days.
From this information we used variables identified by multivariate logistic regression to construct the following formula for the predictor model:
log [probability of dying within 7 days/(1- probability of dying within 7 days)] = [- 5.37 + 0.864* cognitive status (1 if cognitive = 0, 0 if otherwise) + 0.782*
edema (1 if edema = 0, 0 if otherwise) + 1.208* ECOG (1 if ECOG = 1 and 2, 0 if otherwise) + 0.022*BUN + 0.104*respiratory rate].
Figure 2 shows the ROC curve of the training group from which the cut-off point was chosen. The area under the curve (AUC) was 0.81 (P < 0.001, 95% CI: 0.76 to 0.86).
The researchers decided to designate the cut-off point as probability of 0.2 in both training and validation groups.
Table 4 presents the sensitivity and specificity of the model. When probability was >0.2, 7 days' survival was
predicted for terminal patients in the training group and the validation group, with sensitivity of 80.9% and 71.0%, respectively; specificity of 65.9% and 57.7%, respectively; PPV of 42.6% and 26.8%, respectively; NPV of 91.7% and 90.1% (Table 4).
Using this cut-off point, we observed 80.9% sensitivity and 65.9% specificity to predict whether the terminal can- cer patients died within 7 days. The PPV for predicting death within 7 days was 42.6%, but the NPV for not dying within 7 days was 91.7%, suggesting that the model may be more reliable for predicting the 7-day survival. The same model was subsequently validated in a separated group of terminal patients. We observed 71.0% sensitivity and 57.7% specificity to predict the patients who died within 7 days. The PPV for predicting death within 7 days was 26.8%, and the NPV for not dying within 7 days was 90.1%. All these parameters of validation group were
lower than those of training group, but sensitivity was still over 70% and the model also showed more reliability for predicting 7-day survival than death within 7 days.
Discussion
The present study proposes a predictor model to estimate probability of 7-day survival for patients in terminal-stage cancer. The five predictors identified by multivariate logis- tic regression analysis were patient's cognitive status, edema, ECOG performance status, BUN and respiratory rate. A formula of the predictor model including these five predictors was developed and tested in both the training and validation groups. The cut-off point of probability of 0.2 was chosen based on the ROC curve of the training group. In our study, the area under the curve (AUC) was 0.81 (P < 0.001, 95% CI: 0.76 to 0.86). When the proba- bility was >0.2, terminal patients died within 7 days was predicted in the training group and the validation group,
Table 1: Patient characteristics in the training and validate sets.
Training (n = 374) Validation (n = 353) P-value
Age (years) 67 (54, 75) 67 (58, 75) 0.318
Gender 0.428
Male 228 (61.0%) 205 (58.1%)
Female 146 (39.0%) 148 (41.9%)
Diabetes mellitus 92 (24.6%) 120 (34.2%) 0.005*
Hypertension 151 (40.4%) 148 (41.9%) 0.671
Diagnosis
Lung cancer 77 (20.6%) 58 (16.4%) 0.150
Liver cancer 74 (19.8%) 71 (20.1%) 0.912
Colon cancer 44 (11.8%) 42 (11.9%) 0.956
Stomach cancer 18 (4.8%) 25 (7.1%) 0.195
Head Neck cancer 41 (11.0%) 58 (16.4%) 0.032*
Pancreas cancer 16 (4.3%) 14 (4.0%) 0.833
Male GU cancer 16 (4.3%) 11 (3.1%) 0.408
Female GU cancer 27 (7.2%) 22 (6.2%) 0.596
Breast cancer 16 (4.3%) 9 (2.5%) 0.201
Esophagus cancer 11 (2.9%) 12 (3.4%) 0.833
Unknown and others 46 (12.3%) 50 (14.2%) 0.458
Treatment
Operation 154 (41.2%) 165 (46.9%) 0.122
Chemotherapy 191 (51.1%) 190 (53.8%) 0.457
Radiotherapy 116 (31.0%) 143 (40.5%) 0.008*
Laboratory Parameters
WBC (*1000/cumm) 10.01 (7.05, 15.19) 10.41 (7.34, 14.93)† 0.824
Hemoglobin (g/dl) 10.3 (9.1, 11.7) 10.6 (8.9, 11.9)† 0.340
Platelet (*1000/cumm) 210 (128, 312) 222 (138, 331)† 0.309
Glucose (mg/dl) 117 (99, 147) 118 (97, 156)† 0.941
BUN (mg/dl) 21 (15, 32) 19 (12, 32)† 0.067
Creatinine (mg/dl) 0.9 (0.7, 1.4) 0.7 (0.5, 1.1)† <0.001*
SGOT (IU/L) 34 (20, 70) 35 (22, 81)† 0.335
SGPT (IU/L) 23 (14, 46) 26 (15, 47)† 0.382
Albumin (g/dl) 3.1 (2.7, 3.4) 2.8 (2.4, 3.2)† <0.001*
* Statistically significant.
BUN = blood urea nitrogen; SGOT = serum glutamic oxaloacetic transaminase; SGPT = serum glutamic pyruvate transaminase.
† Missing values were observed in this variable in the validation set.
with sensitivity of 80.9% and 71.0%, specificity of 65.9%
and 57.7%, PPV of 42.6% and 26.8%, and NPV of 91.7%
and 90.1%, respectively.
The predictors in our model agreed with other most recent models. ECOG performance status was a strong predictor (odd ratio = 6.13 in univariate logistic model, and 3.45 in multivariate analysis), as in Chuang's and Bozcuk's reports [16,17]. Cognitive score, another strong predictor (odd ratio = 3.62 in univariate logistic model, and 2.29 in
multivariate analysis), was also identified by Bruera and Chuang [10,16]. Like us, Morita and Chuang identified edema as a significant predictor for length of survival among terminal cancer patients [11,16]. Accuracy of our study, expressed by ROC area (AUC), was comparable to that of Bozcuk [17].
The uniqueness of our model was the inclusion of blood urea nitrogen (BUN), and respiratory rate, one of the basic vital signs, in the formula. The study shows that BUN is
Table 2: Prevalence of significant clinical signs by severity.
Clinical signs Training(n = 374) Validation(n = 353) P-value
Cognitive 0.014*
0 273 (73.0%) 228 (64.6%)
1 to 3 101 (27.0%) 125 (35.4%)
Edema 0.508
0 190 (50.8%) 188 (53.3%)
1 to 3 184 (49.2%) 165 (46.7%)
Jaundice 0.747
0 264 (70.6%) 253 (71.7%)
1 to 3 110 (29.4%) 100 (28.3%)
ECOG score <0.001*
1 and 2 167 (44.7%) 26 (7.4%)
3 and 4 207 (55.3%) 327 (92.6%)
Ascites <0.001*
0 218 (58.3%) 265 (75.1%)
1 to 3 156 (41.7%) 88 (24.9%)
* Statistically significant.
Survival curve of the training and validation groups Figure 1
Survival curve of the training and validation groups.
more significant for survival than creatinine. Elevation of BUN is termed azotemia. Terminal azotemia means the state of terminal dehydration, gastrointestinal bleeding, and others of patients [30]. Only Chung attempted to pre- dict survival within the one week window. We included fewer predictors than Chuang [16], whose eight character- istics include liver and lung metastases. Borzuk showed a similar area under the curve to ours, but only tested likeli- hood of dying in the hospital, not death within seven days
[17]. We also found that the higher the respiratory rate, the greater the possibility of survival of less than one week.
This scale is an important improvement over previous methods. First, every terminally ill cancer patient receives the probability of 7-day survival within 24 hours of admission by our prognostic scale. The reader can use the method indicated in the supplementary information to calculate the probability. Second, we have identified a lab- oratory factor (BUN) and patient vital sign (respiratory rate) as additional prognostic parameters. Thirdly, this prognostic scale shows relatively high sensitivity (80.9%) and NPV (91.7%) for predicting 7-day survival among ter- minal cancer patients. This means that our prognostic scale has more value for identifying those patients not late referral for hospice care than for positively identifying those patients within 7 days of death.
Correct survival estimations in terminally ill cancer patients helps prevent inappropriate therapies, avoid actions that could worsen the patient's quality of life, and
Table 3: Determinants of patients who died within 7 days in the training set (n = 374).
Univariate analysis Multivariate analysis
O.R. 95%CI P-value O.R. 95%CI P-value
Age (years) 1.01 (0.99, 1.03) 0.272
Gender (male vs. female) 1.53 (0.92, 2.54) 0.099
Diabetes mellitus (yes vs. no) 0.98 (0.52, 1.85) 0.953
Hypertension (yes vs. no) 0.68 (0.36, 1.26) 0.215
Cancer diagnosis
Lung cancer (yes vs. no) 1.27 (0.72, 2.25) 0.411
Liver cancer (yes vs. no) 2.22 (1.28, 3.86) 0.004* 1.63 (0.76, 3.50) 0.212
HN** cancer (yes vs. no) 0.63 (0.27, 1.48) 0.292
Treatment
Operation (yes vs. no) 0.66 (0.40, 1.09) 0.107
Chemotherapy (yes vs. no) 1.27 (0.78, 2.05) 0.337
Radiotherapy (yes vs. no) 0.87 (0.51, 1.47) 0.590
Clinical signs
Cognitive (1 to 3 vs. 0) 3.62 (2.18, 6.02) <0.001* 2.29 (1.18, 4.43) 0.014*
Edema (1 to 3 vs. 0) 2.32 (1.42, 3.82) 0.001* 1.94 (1.04, 3.62) 0.038*
Jaundice (1 to 3 vs. 0) 2.23 (1.35, 3.67) 0.002* 1.00 (0.47, 2.15) 0.999
ECOG score (3, 4 vs. 1, 2) 6.13 (3.31, 11.37) <0.001* 3.45 (1.65, 7.19) 0.001*
Ascites (1 to 3 vs. 0) 1.94 (1.20, 3.15) 0.007* 1.01 (0.49, 2.11) 0.975
Laboratory Parameters
WBC (*1000/cumm) 1.03 (1.01, 1.05) 0.012* 1.02 (1.00, 1.04) 0.095
Hemoglobin (g/dl) 1.05 (0.93, 1.17) 0.445
Platelet (*1000/cumm) 1.00 (1.00, 1.01) 0.031* 1.00 (1.00, 1.01) 0.145
Glucose (mg/dl) 1.00 (0.99, 1.00) 0.350
BUN (mg/dl) 1.03 (1.02, 1.04) <0.001* 1.02 (1.00, 1.03) 0.017
Creatinine (mg/dl) 1.46 (1.18 1.80) <0.001* 1.00 (0.71, 1.41) 0.993
SGOT (IU/L) 1.00 (1.00, 1.01) 0.002* 1.00 (1.00, 1.01) 0.155
SGPT (IU/L) 1.01 (1.00, 1.01) 0.016* 1.00 (0.99, 1.01) 0.806
Albumin (g/dl) 0.56 (0.35 0.90) 0.016* 0.88 (0.50, 1.56) 0.666
Respiratory rate 1.12 (1.01, 1.19) <0.001* 1.12 (1.04, 1.20) 0.004*
* Statistically significant.
** HN: Head Neck.
Table 4: Sensitivity and specificity of cut-off prognostic survival scale for patients dying within seven days in both training and testing samples.
Training (n = 374) Validation* (n = 349)
Sensitivity 80.9% 71.0%
Specificity 65.9% 57.7%
PPV 42.6% 26.8%
NPV 91.7% 90.1%
PPV: Positive Predictive Value; NPV: Negative Predictive Value
* Missing data in the validation group: 1 in data for BUN and 3 in data for Respiration rate.
allows for support for patients and families by timely referred to hospice care. Knowing the approach of one's death can make for better decision-making and quality of life. Using Kellehear's model of spiritual needs, Leung et al. found that awareness of terminal illness was associated with well-being, even at the end of life [31]. Accurate pre- diction of survival is vital in planning effective palliative care and appropriately adjusting some medications [11].
Timely referral was associated with greater satisfaction in both patients and their family members [32].
Our study had some limitations. First, the degree of hos- pice and palliative care varies around the world, so includ- ing a representative population at similar and specific points during the course of their terminal illness is diffi- cult [33]. Certain variables including survival and some clinical signs by severity (e.g., cognitive, ECOG score, ascites) were statistically different in both groups. How- ever, this limitation shows that the participants of both groups were selected sequentially without bias, as in other studies [16,17]. Second, some data may inevitably intro- duce bias. For example, the data on weight lost were based on information provided by patients' relatives when the patient could not accurately recall body weight three months prior. In addition, a limited number of patients (8.2%) were assessed by family caregivers rather than by patients due to the cognitive impairment, which may have introduced some bias. Finally, a hospital-based study may not fully apply to community-based patients. In the present study, the number of patients meeting the inclu-
sion criteria was limited in a community hospital setting.
This could be an issue for further study.
In addition, the study has certain strengths. The NPV of our prognostic scale is 91.7%, and 90.1%, respectively, in the training and validation groups. This means that our prognostic scale would have more value for identifying those patients not late referral to hospice care than for pos- itively identifying those patients with 7 days to death.
Also, it provides a calculation (by R syntax or excel) for determining probability of survival within 7 days.
Conclusion
This prognostic scale, including patient's cognitive status, edema, performance status, BUN and respiratory rate, showed a relatively high sensitivity and NPV for predict- ing 7-day survival among terminal cancer patients. We believe the proposed scale could be useful for predicting survival 7-day for terminal cancer patients, in addition, not late referral to hospice care.
Competing interests
The authors declare that they have no competing interests.
Authors' contributions
We declare that all the listed authors have participated actively in the study and all meet the requirements of the authorship. YHK carried out the epidemiology, and drafted the manuscript. NSL participated in its design and coordination. MHW participated in the data collection.
JKC participated in the design of the study and performed the statistical analysis. SCC conceived of the study, and helped to draft the manuscript. All authors read and approved the final manuscript.
Acknowledgements
This project was supported by grants from Buddhist Dalin Tzu Chi General Hospital (Project No. DTCRD94-10 and DTCRD96-18).
References
1. Lau F, Cloutier-Fisher D, Kuziemsky C: A systemic review of prognostic tools for estimating survival time in palliative care. J Palliat Care 2007, 23:93-112.
2. Hickman SE, Tilden VP, Tolle SW: Family reports of dying patients' distress: the adaptation on a research tool to assess global symptom distress in the last week of life. J Pain Symptom Manage 2001, 22:565-74.
3. Furst CJ, Doyle D: The terminal phase. Oxford Textbook of Palliative Medicine. Oxford, Oxford 2004:1119-33.
4. Morita T, Bito S, Koyama H: Development of a national clinical guideline for artificial hydration for terminally ill patients with cancer. J Palliat Med 2007, 10:770-80.
5. Glare P, Virik K, Jones M, Hudson M, Eychmuller S, Simes J, Christakis N: A systematic review of physicians' survival predictions in terminally ill cancer patients. BMJ 2003, 327:195-8.
6. Maltoni M, Caraceni A, Brunelli C, Broeckaert B, Christakis N, Eychmueller S, Glare P, Nabal M, Vigano A, Larkin P, De Conno F, Hanks G, Kaasa S, Steering Committee of the European Association for Palliative Care: Prognostic factors in advanced cancer patients: evidence-based clinical recommendations--a study by the Steering Committee of the European Association for Palliative Care. J Clin Oncol 2005, 23:6240-8.
ROC curve of training group Figure 2
ROC curve of training group.
Publish with BioMed Central and every scientist can read your work free of charge
"BioMed Central will be the most significant development for disseminating the results of biomedical researc h in our lifetime."
Sir Paul Nurse, Cancer Research UK
Your research papers will be:
available free of charge to the entire biomedical community peer reviewed and published immediately upon acceptance cited in PubMed and archived on PubMed Central yours — you keep the copyright
Submit your manuscript here:
http://www.biomedcentral.com/info/publishing_adv.asp
BioMedcentral 7. Chiu T, Hu W, Chen C: Prevalence and severity of symptoms
in terminal cancer patients: a study in Taiwan. Support Care Cancer 2000, 8:311-3.
8. Maltoni M, Amadori D: Prognosis in advanced cancer. Hematol Oncol Clin N Am 2002, 16:715-29.
9. Reuben DB, Mor V, Hiris J: Clinical symptoms and length of sur- vival in patients with terminal cancer. Arch Intern Med 1988, 148:1586-91.
10. Bruera E, Miller MJ, Kuehn N: Estimate of survival of patients admitted to a palliative care unit: a prospective study. J Pain Symptom Manage 1992, 7:82-6.
11. Morita T, Tsunoda J, Inoue S: The palliative prognostic index: a scoring system for survival prediction of terminally ill cancer patients. Support Care Cancer 1999, 7:128-33.
12. Maltoni M, Nanni O, Pirovano M: Successful validation of the pal- liative prognostic score in terminally ill cancer patients. J Pain Symptom Manage 1999, 17:240-7.
13. Glare P, Sinclair C, Downing M, Stone P, Maltoni M, Vigano A: Pre- dicting survival in patients with advanced disease. Eur J Cancer 2008, 44:1146-56.
14. Chow E, Abdolell M, Panzarella T, Harris K, Bezjak A, Warde P, Tan- nock I: Predictive model for survival in patients with advanced cancer. J Clin Oncol 2008, 26:5863-9.
15. Stone P, Kelly L, Head R, White S: Development and validation of a prognostic scale for use in patients with advanced can- cer. Pall Med 2008, 22:711-7.
16. Chuang RB, Hu WY, Chiu TY: Prediction of survival in terminal cancer patients in Taiwan: constructing a prognostic scale. J Pain Symptom Manage 2004, 28:115-22.
17. Bozcuk H, Koyuncu E, Yildiz M, Samur M, Ozdogan M, Artac M, Coban E, Savas B: A simple and accurate prediction model to estimate the intrahospital mortality risk of hospitalized can- cer patients. Int J Clin Pract 2004, 58:1014-9.
18. Kelly L, White S, Stone PC: The B12/CRP index as a simple prog- nostic indicator in patients with advanced cancer: a confirm- atory study. Ann Oncol 2007, 18:1395-9.
19. Christakis NA, Escarce JJ: Survival of Medicare patients after enrollment in hospice programs. N Engl J Med 1996, 335:172-8.
20. Wu MF, Yuh SJ, Huang CY: The survival time of terminal cancer patients in a hospital program. Chin J Fam Med 2000, 10:202-11.
21. Chiou JD, Chen CW, Lin MH: A five-year analysis of the inpa- tient service of the hospice and palliative care unit in VGH- Taipei. Chin J Fam Med 2005, 15:123-33.
22. Costantini M, Toscani F, Gallucci M: Terminal cancer patients and timing of referral to palliative care: a multicenter pro- spective cohort study. J Pain Symptom Manage 1999, 18:243-52.
23. Tang ST, Chen ML, Huang EW, Koong SL, Lin GL, Hsiao SC: Hospice utilization in Taiwan by cancer patients who died between 2000 and 2004. J Pain Symptom Manage 2007, 33:446-53.
24. Bradley EH, Prigerson H, Carlson MD, Cherlin E, Johnson-Hurzeler R, Kasl SV: Depression among surviving caregivers: does length of hospice enrollment matter? Am J Psychiatry 2004, 161:2257-62.
25. Miller SC, Weitzen S, Kinzbrunner B: Factors associated with the high prevalence of short hospice stays. J Palliative Med 2003, 6:725-36.
26. Glare P, Virik K, Jones M, Hudson M, Eychmuller S, Simes J, Christakis N: A systematic review of physicians' survival predictions in terminally ill cancer patients. BMJ 2003, 327:195-200.
27. Hsu HC, Hu WY, Chung RB: Symptoms in the elderly with ter- minal cancer - a study in Taiwan. Formosan J Med 2002, 2:465-73.
28. Conill C, Verger E, Henriquez I: Symptoms prevalence in the last week of life. J Pain Symptom Manage 1997, 14:328-31.
29. Vainio A, Auvinen A: Prevalence of symptoms among patients with advanced cancer: an international collaborative study. J Pain Symptom Manage 1996, 12:3-10.
30. Ravel R: Clinical Laboratory Medicine 4th edition. Year Book Medical Publishers: Chicago, London; 1984:130-2.
31. Leung K, Chiu T, Chen C: The influence of awareness of termi- nal condition on spiritual well-being in terminal cancer patients. J Pain Symptom Manage 2006, 31:449-56.
32. Teno JM, Shu JE, Casarett D, Spence C, Rhodes R, Connor S: Timing of referral to hospice and quality of care: length of stay and bereaved family members' perceptions of the timing of hos- pice referral. J Pain Symptom Manage 2007, 34:120-5.
33. Aranda S: Global perspectives on palliative care. Cancer Nursing 1999, 22:33-9.
Pre-publication history
The pre-publication history for this paper can be accessed here:
http://www.biomedcentral.com/1471-2458/9/365/pre pub