99 - 108 頁 pp. 99 - 108
Risk Assessment and Criticality Analysis of Medical Errors
Tien-Sung (David) Chio
1,*Abstract
The objective of this paper is to demonstrate an integrated conceptual model in measuring the risk severity of medical errors. The corresponding steps were developed in the model. The contribution of this study includes: (1) A measurement model is proposed for measuring the risk severity, (2) the model is applied to analyze the boundary conditions in order to classify the potential risks into four different classes, (3) the measurable metrics of the risk thresholds associated with are quantified in a systematic way.
ᙯᔣෟ: Medical errors; Risk assessment; Technology-induced Error; Criticality analysis; Boundary condition
1. Introduction
The nature of medical errors is analyzed by four facets which are errors in medications, treatment procedures, diagnosis, and clerical functions. This naturally led to the extension of the Institute of Medicine (IOM) classification of medical errors.
Risk is a combination of the probability of occurrence of harm and the severity of that harm (BS EN ISO:14971, 2012). IEC 61508-5 International Standard
(1998) defined the tolerable region of potential risks is the range between the intolerable risk and acceptable risk regions. The importance for evaluating the tolerance regions is to provide evidence for patients’ safety (Subhan, 2016).
Risk management can be defined as the systematic application of management policies, procedures and practices to the tasks of analyzing, evaluating and controlling risk (Cheng & World Health Organization, 2003). Lander (2007) outlined different methodologies for various phases of the process of risk management. He found the higher the level of risk each phase in the process becomes, the more detailed the methodology should become. This paper is to demonstrate the steps in risk assessing and criticality analyzing of medical errors.
2. Related Works
A report on medical error from the IOM has greatly increased people’s awareness of the frequency, magnitude, complexity, and seriousness of medical errors (Kalra, 2004).
The report found that two-thirds of the taxonomies classified systemic factors of medical errors and only a third utilized theoretical error concepts (Taib, McIntosh, Caponecchia, & Baysari, 2011). A cognitive taxonomy of medical error has been proposed at the level of individuals and their interactions with technology (Zhang,
亞東學報 第37 期
Patel, Johnson, & Shortliffe, 2004). They used four criteria that include execution slips, evaluation slips, execution mistakes, and evaluation mistakes to evaluate the cognitive taxonomy of medical errors.
Reason (1990) defined violations as the deliberate deviation of acts from a safe operating procedure. Deliberate violations include practices that are not deemed to be against the written rules but have the potential to cause problems. Moreover, Reason proposed the image of "Swiss cheese" to explain the occurrence of system failures and that model has become the dominant paradigm for analyzing medical errors and patient safety incidents (Reason, 2000). Perneger showed that among quality and safety improvement professionals, the meaning of the Swiss cheese model of medical error is far from univocal. The interpretations of specific features of the Swiss cheese model varied considerably among professionals (Perneger, 2005).
3. Analytic Hierarchical Structure of
Medical Errors
The basic step of analytic measurement method is to construct the hierarchical structure of the evaluated goal. In the hierarchical structure, the first level (goal level) is the evaluated goal in which the level is used to formulate the total weightage for the risk analysis. The second one is the criteria level that is categorized into criteria under the evaluated goal. In some cases, each criterion is broken down into sub-criteria, the third level, that were expressed by contributing factors.
By using the top-down techniques, the hierarchical structure is built in Figure 1.
Fig.1 Analytical hierarchical structure with top-down decomposition technique.
Therefore, this hierarchical structure supports a decision maker to make decisions involving their experience, knowledge and intuition to make a judgment matrix, i.e., pair-wise comparison matrix, which can be formulated from equation (1) to (3).
1 1 1 1 2 2 2 2 1 2 1 2
. . .
. . .
.
.
.. .
.
. . .
i j n A a n n n n nw
w
w
w
w
w
w
w
w
w
w
w
w
w
w
w
w
w
(1) where ij i j w a w ,i j, 1, 2,...,n (2) 1 ji ij a a ,i j, 1, 2,...,n (3) where aij represents the pairwise comparison rating between the element i and element j of a level with respect to the upper level, denoted by w. The entries aij are governed by the following rules: aij >0; aij =1/ aji; aii4. Research Design
This section elaborates the research design and the implementation steps of the risk assessment of medical errors. The modeling process has been adjusted to better reflect the workflow steps. The detailed model preparation will be demonstrated in combination with distinct research methods. The process steps are divided into two modeling phases: Model Development and Model Elaboration. An integrated flowchart of the research design is shown in Figure 2.
Fig.2 The model for measuring risk level of medical errors.
4-1 Phase 1: Model Development
The first phase in the research design is mapping out the conceptual structure of medical errors. In this phase, the model development includes the identification of criteria and the contributing factors that are used to measure the risk level and to calculate the potential risk value. The model development phase including the following steps serves to construct the hierarchy structure for medical errors.
Step 1a: Identify the contributing factors
contributing factors that occur in various settings. Therefore, the first step for assessing the risks of medical errors is to identify the contributing factors.
Step 1b: Determine causal effects
The second step is to determine the causal effects of contributing factors, then elicit the metrics categories, and to classify each contributing factor to its belonging criteria.
Step 1c: Construct the hierarchy
Based on the above two steps, this step is to construct the analytical hierarchy structure for medical errors, which includes the assessment goal (level 1), criteria (level 2), and contributing factors (level 3). By using the top-down techniques, the hierarchy structure can be built. We classify the criteria as the criterion A, B, and C, etc. The notation a1, a2,…, b1, b2…, c1, c2… denotes the contributing factors that belong to the specific criterion A, B, and C. The same techniques can be applied for more complicated cases by extending the structure.
4-2 Phase 2: Model Elaboration
Model elaboration is the most critical phase. The probability and the risk impact with respect to the criteria level and the contributing factors level are calculated in this phase. Risk scores of medical errors can be calculated by the risk mathematical formula. The following steps take these into account and recommend a way to efficiently perform the risk assessment.
Step 2a: Measure probability values (P)
Descriptive statistics are used to measure the frequency of medical error. The data is collected and summarized by grouping them into classes and recording how many data points fall into each element both in the criteria level and the contributing factors level respectively.
亞東學報 第37 期
pairwise comparisons for both levels of criteria and contributing factors to make a judgment matrix. To obtain a square, reciprocal symmetric matrix whose elements are pairwise comparisons of criteria at the second level with reference to the overall goal at first level, the normalized principal eigenvector of the matrix is calculated in this step. Similarly, we make the pairwise comparison matrices of the contributing factors in the third level with reference to the second level, and then compute the normalized principal eigenvector for the corresponding matrices.
Step 2c: Calculate relative impacts (I)
Following the equation (1) to (3), the risk impact of the criteria and contributing factors can be estimated by computing the principal eigenvector w of the matrix A, that is:
AW = λmaxW
When the vector W is normalized, it becomes the vector of priorities of elements of one level with respect to the upper level. As noted, λmax is the largest eigenvalue of the matrix A.
Step 2d: Calculate the risk score
From the occurrence probability (P) in step 2a, we multiply by the risk impact value (I) in step 2c into the risk value (R) to rank the severity of risk level for medical errors. By using the bottom-up technique, risk values can be obtained and mapped to the hierarchical structure.
Step 2e: Analyze the criticality and determine risk thresholds
This step is to calculate the composite priorities and weights for each criterion-mode combination and use them for the absolute measurement of the criticality of a risk factor. The composite weights and priority vectors are calculated for different levels in order to analyze boundary conditions of the impact values. In this step, the upper bound, middle bound, and lower bound for impact
values are estimated and used to determine risk thresholds.
Step 2f: Classify the risk severity
In the above step, the criticality analysis determines the boundary conditions of the risk impacts and risk thresholds. Based on the above numerical values, risks are classified into an intolerable, undesirable, tolerable, or negligible class.
5. Risk Assessment and Criticality Analysis
in Medical Errors
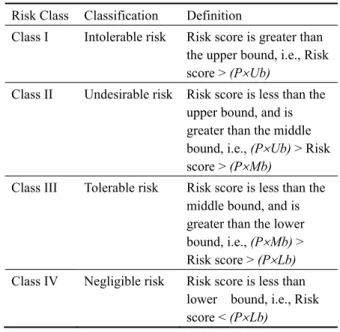
The risk level and criticality of medical errors are measured by using the Analytical Measurement Model in section 4. Criticality determines the boundary conditions of the risk impact and severity. The purpose of criticality analysis is to provide guidance for deciding on risk classes. In order to analyze the criticality, three bounds were defined in this paper, they are upper bound (Ub), middle bound (Mb), and lower bound (Lb). The above bounds serve as risk thresholds to classify the risk into the intolerable, undesirable, tolerable, or negligible class. To extend the concepts of the section 4, four risk classes were proposed, and defined in Table 1.
Table 1 A modified risk classification and definitions
Risk Class Classification Definition
Class I Intolerable risk Risk score is greater than the upper bound, i.e., Risk score > (PUb)
Class II Undesirable risk Risk score is less than the upper bound, and is greater than the middle bound, i.e., (PUb) > Risk
score > (PMb)
Class III Tolerable risk Risk score is less than the middle bound, and is greater than the lower bound, i.e., (PMb) >
Risk score > (PLb)
Class IV Negligible risk Risk score is less than lower bound, i.e., Risk score < (PLb)
99 - 108 頁 pp. 99 - 108
Fig.3 Hierarchy structure of the sample problem
Technology-induced error is one of the significant contributing factor that lead to Technology-induced error is one of the significant contributing factor that lead to medical errors (Kushniruk et al., 2008). The dataset of the sample problem was from a study of technology-induced errors and usability conducted by Kushniruk and colleagues (Kushniruk, Triola, Borycki, Stein, & Kannry, 2005). This paper described the relationship between usability problems and prescription errors when using a handheld application in healthcare. As the rate of technology use in healthcare continues to increase in response to changing demographic and healthcare needs of patients so does the potential for technology-induced error.
The following specific categories of user interface and content problems were identified when the transcripts were annotated by a researcher with a background in human-computer interaction (Kushniruk et al., 2005). Thus, the main categories of usability problems at the highest level, in the Measured Goal Level (the 1st level top level in Figure 3) could be considered a result of specific issues with: (1) the application’s user interface and (2) the content of information displayed by the system (with Interface and Content problems
can see specific contributing factors to interface problems (e.g. specific usability problems such as data entry problems, display visibility problems, navigation problems etc.), as well as specific problems contributing to content issues (e.g. problems with the database information not being correct, default values and issues with the training manual).
Based on the dataset of the sample problem (Kushniruk et al., 2005), the results and data analysis are shown in Table 2. At the first assessment level, which is the criteria level, we see the ‘interface’ and ‘content’ are the criteria being assessed. At the second level of assessment, there are eight contributing factors (a1~a8) under the criterion ‘interface’, and three contributing factors (b1~b3) under the criterion ‘content’. Per each contributing factor, calculations are made for the likelihood and impact, and the final risk score that is found by multiplying the probability value by the impact value, hence R=P × I.
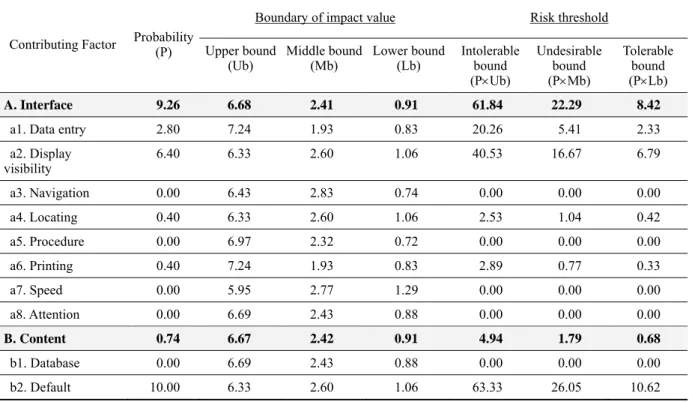
Next, the boundary of impact value was investigated and calculated with three bounds such as upper bound, middle bound, and lower bound. Table 3 summarizes the boundary of the impact value of each criterion, and the corresponding risk threshold. In Table 3, the results were
亞東學報 第37 期
for example, Table 3 depicts that upper, middle, and lower bounds are 6.68, 2.41, and 0.91. The intolerable bound is calculated by multiplying probability (P) to
upper bound (Ub). Similar calculations are made for undesirable and tolerable bounds.
Table 2 Risk scores of the sample problem
Criterion and its contributing factors
Probability value ( P ) Impact values*( I ) Risk score
( R )
in % Normalized scale in % Normalized scale R = P × I
A. Interface 92.6% 9.26 83.3% 8.33 77.16
a1. Data entry 28.0% 2.80 14.6% 1.46 4.09
a2. Display visibility 64.0% 6.40 11.7% 1.17 7.49
a3. Navigation 0.0% 0.00 10.6% 1.06 0.00 a4. Locating 4.0% 0.40 2.5% 0.25 0.10 a5. Procedure 0.0% 0.00 19.7% 1.97 0.00 a6. Printing 4.0% 0.40 9.1% 0.91 0.37 a7. Speed 0.0% 0.00 15.4% 1.54 0.00 a8. Attention 0.0% 0.00 16.4% 1.64 0.00 B. Content 7.4% 0.74 16.7% 1.67 1.23 b1. Database 0.0% 0.00 68.6% 6.86 0.00 b2. Default 100.0% 10.00 21.1% 2.11 21.14 b3. Training manual 0.0% 0.00 10.2% 1.02 0.00
Table 3 Criticality analysis and risk thresholds of the sample problem
Contributing Factor Probability (P)
Boundary of impact value Risk threshold
Upper bound
(Ub) Middle bound(Mb) Lower bound(Lb) Intolerable bound (PUb) Undesirable bound (PMb) Tolerable bound (PLb) A. Interface 9.26 6.68 2.41 0.91 61.84 22.29 8.42
a1. Data entry 2.80 7.24 1.93 0.83 20.26 5.41 2.33
a2. Display visibility 6.40 6.33 2.60 1.06 40.53 16.67 6.79 a3. Navigation 0.00 6.43 2.83 0.74 0.00 0.00 0.00 a4. Locating 0.40 6.33 2.60 1.06 2.53 1.04 0.42 a5. Procedure 0.00 6.97 2.32 0.72 0.00 0.00 0.00 a6. Printing 0.40 7.24 1.93 0.83 2.89 0.77 0.33 a7. Speed 0.00 5.95 2.77 1.29 0.00 0.00 0.00 a8. Attention 0.00 6.69 2.43 0.88 0.00 0.00 0.00 B. Content 0.74 6.67 2.42 0.91 4.94 1.79 0.68 b1. Database 0.00 6.69 2.43 0.88 0.00 0.00 0.00 b2. Default 10.00 6.33 2.60 1.06 63.33 26.05 10.62
b3. Training manual 0.00 7.24 1.93 0.83 0.00 0.00 0.00
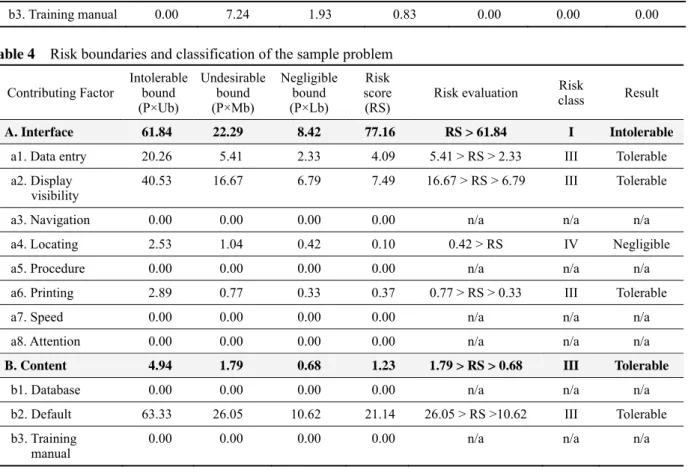
Table 4 Risk boundaries and classification of the sample problem
Contributing Factor Intolerable bound (P×Ub) Undesirable bound (P×Mb) Negligible bound (P×Lb) Risk score (RS) Risk evaluation Risk class Result A. Interface 61.84 22.29 8.42 77.16 RS > 61.84 I Intolerable
a1. Data entry 20.26 5.41 2.33 4.09 5.41 > RS > 2.33 III Tolerable
a2. Display
visibility 40.53 16.67 6.79 7.49 16.67 > RS > 6.79 III Tolerable
a3. Navigation 0.00 0.00 0.00 0.00 n/a n/a n/a
a4. Locating 2.53 1.04 0.42 0.10 0.42 > RS IV Negligible
a5. Procedure 0.00 0.00 0.00 0.00 n/a n/a n/a
a6. Printing 2.89 0.77 0.33 0.37 0.77 > RS > 0.33 III Tolerable
a7. Speed 0.00 0.00 0.00 0.00 n/a n/a n/a
a8. Attention 0.00 0.00 0.00 0.00 n/a n/a n/a
B. Content 4.94 1.79 0.68 1.23 1.79 > RS > 0.68 III Tolerable
b1. Database 0.00 0.00 0.00 0.00 n/a n/a n/a
b2. Default 63.33 26.05 10.62 21.14 26.05 > RS >10.62 III Tolerable b3. Training
manual 0.00 0.00 0.00 0.00 n/a n/a n/a
Taking the criterion ‘Interface’ as an example, the numerical value of intolerable bound is 9.26 × 6.68 = 61.84. Similarly, the undesirable bound is 9.26 × 2.41 = 22.29, and the tolerable bounds is 9.26 × 0.91 = 8.42, respectively. As a result, the risk thresholds for intolerable, undesirable, and tolerable bound is 61.84, 22.29, and 8.42, respectively.
These serve as the absolute measurement of the risk threshold of technology-induced errors considered in the criterion ‘interface’. These values are compared with the risk score for classifying technology-induced error as intolerable, undesirable, tolerable, or negligible risk.
In view of the above boundary conditions, Table 4 shows the risk boundaries and classification of the criterion and their contributing factors. For example, the risk score of the criterion ‘Interface’ is 77.16 which is
(P*Ub) in accord with the risk threshold. Therefore, the criterion ‘Interface’ should be classified as ‘Class I- Intolerable Risk’ since it has a risk score 77.16 which is greater than the intolerable bound. Similar calculations have been made for its contributing factors. For some factors, such as navigation, locating, procedure, speed, and attention, the risk class are denoted by ‘n/a’ that have zero probability.
6. Conclusion
Medical errors involved in health care are critical issues. In this paper, a systematic approach for measuring the risk severity of medical errors has been developed. The risk levels of medical errors were formulized by mathematical formulae as well as analytical hierarchy structure. A measurement model is proposed for
亞東學報 第37 期
conditions to classify potential risks into four different classes. More specifically, the measurable metrics of the risk thresholds associated with are quantified in a systematic way. A sample problem about technology-induced error that lead to medical errors was evaluated to verify results of risk assessment and criticality analysis.
Reference
BS EN ISO:14971 (2012). Application of risk management to medical devices.
Cheng, M., & World Health Organization. (2003). Medical device regulations: Global overview and guiding principles. Geneva: World Health Organization.
IEC 61508-5: International Standard (1998), Functional safety of electrical/electronic/ programmable electronic safety-related systems (1st ed., Part 5: Examples of methods for the determination of safety integrity levels). Geneva, Switzerland. Kalra, J. (2004). Medical errors: overcoming the challenges.
Clinical Biochemistry, 37(12), 1063 - 1071.
Kushniruk, A. W., Triola, M. M., Borycki, E. M., Stein, B., & Kannry, J. L. (2005). Technology induced error and usability:
The relationship between usability problems and prescription errors when using a handheld application. International
Journal of Medical Informatics, 74, 519-526.
Kushniruk, A. W., & Borycki, E. M. (2008). Human, Social, and Organizational Aspects of Health Information Systems. University of Victoria, B.C., Canada.
Lander, V. (2007). Achieving risk management for FDA compliance using ISO 14971. Journal of GXP Compliance,11(4), 22.
Perneger, T. V. (2005). The Swiss cheese model of safety incidents are there holes in the metaphor. BMC Health Services Research, 5(1), 71.
Reason, J. T. (1990). Human error. Cambridge University Press. Reason, J. T. (2000). Education and Debate: Human error models
and management. BMJ (Clinical research ed.), 7237, 768 - 770. Subhan, A. (2016). 20ISO/IEC 80001: Risk Management of
Medical Devices on a Network. Journal of Clinical
Engineering, 41(3).
Taib, I. A., McIntosh, A. S., Caponecchia, C., & Baysari, M. T. (2011). A review of medical error taxonomies: A human factors perspective. Safety Science, 49, 607-615.
Zhang, J., Patel, V. L., Johnson, T. R., & Shortliffe, E. H. (2004). A cognitive taxonomy of medical errors. Journal of