國立臺灣大學電機資訊學院電機工程學系 博士論文
Department of Electrical Engineering
College of Electrical Engineering and Computer Science
National Taiwan University Doctoral Dissertation
人體腦部維他命 C 的偵測與定量:
利用標準磁振頻譜技術的可行性
The detectability and reliability of vitamin C detection in human brain using standard
1H spectroscopy on a clinical 3T MR-system
施逸優 Yi-Yu Shih
指導教授:鍾孝文 博士 Advisor: Hsiao-Wen Chung, Ph.D.
中華民國 98 年 1 月
January, 2009
博碩士論文授權書(電機系使用)
本授權書所授權之論文為授權人在國立台灣大學取得博碩士學位之論文
論文題目:人體腦部維他命 C 的偵測與定量:利用標準磁振頻譜技術的可行性
指導教授:鍾孝文博士
授權人於自由意志下玆同意將上列論文所擁有著作權部份之全文(含摘要、圖 表、數據和內容之全部),非專屬、無償授權于上列本人之論文指導教授,不 限地域、時間與次數,以印刷或數位方式將上列論文之一部或全部重製,指導 教授得在其著作引用或複製本論文之文字或內容。授權人亦於自由意志下同意 指導教授為本論文研究成果之共同創作人及著作人。
授權人:施逸優
簽名:
中華民國 98 年 3 月 31 日
致謝
短短的幾頁致謝,卻是論文中最難動筆的部份,不管是求學生涯的紀錄或者對於 周邊師長朋友的感謝,十年的日子總不是三言兩語可以道盡的。曾經在大學時代 一度挫折到想離開電機這個領域,後來投入鍾老師的門下而開啟另一個希望。當 夢寐以求的歐洲大陸攤展在自己眼前時,內心的激動久久不能平復。一年半的德 國生涯結束後,回到台灣竟有種滄海桑田變幻之感,原本 307 的小茶几與沙發已 然消失,取而代之的是 704 四公尺高的天花板與冷冽現代感的餐桌。雖環境改 變,但還好人情溫暖依舊,那依然是我熟悉的 307 氛圍,回到這個地方,就是一 種心靈的歸屬與安定,就像航行的船隻終將靠岸停泊。
即使這一段路走得跌跌撞撞,卻也沒有什麼後悔。有人說做研究就像談戀愛一 樣,理想的愛情裡人們總是追求著專心一意、從一而終的男子或女子,那種在某 個領域極為傑出的研究者,大概跟拿座貞節牌坊沒有兩樣。但我總是自嘲是個沒 有研究忠誠度的人:六年碰過三四個南轅北轍的東西,夢裡尋他千百回後,終於 最後與 MRS 暫時私定終生。
感謝鍾老師,從大學時期接觸到老師的課開始,老師的身教與言教總是給我們最
佳的示範。韓愈說過:「師者,所以傳道、授業、解惑也。」不只是在教學與研
究上的態度,老師帶給我們更多的是在生活上的想法,很多聊天時候談到的辛辣 八卦無非是要我們看清這個社會的現實與無奈。我很高興在人生的各個階段碰到 許多好老師,而能夠在這邊學習實在是很幸福的一件事。
Thomas、福年、岳岳學長跟益如學姐應該是我最早認識的實驗室成員。從大學 部的心電圖專題開始,到後來被抓去當 MRI 掃描的受試者,在學長姐的指導下,
逐漸對這個領域產生興趣,而在研究所的生涯中,也感謝有你們的不厭其煩,讓 我在這個浩瀚的 MR 領域中,能夠一點一點的慢慢了解。Eric 學長跟阮醫師拼命 三郎的精神,還有對於研究的熱忱與靈感,是我們難以望其項背的。感謝 Coco 學姊,要是沒有學姊的幫忙,也沒有機會認識德國頂尖的 MR 研究團隊並且與他 們工作一年半。超哥讓我們看到教書的另一個典範;在三總實驗時,都是昭穎、
銘鍾學長還有華姍學姊罩著,才能讓我們走三總像在自己家一樣自在。明龍學長 的溫文敦厚與肇哥的動靜皆宜,一直是實驗室新好男人的代表,旭霞的堅毅樂觀 與認真,不管在台灣或者在德國都讓是我的榜樣。除了各位學長姐之外,梓程、
珮歆、慶昭、尹宬、家碩、書瑾、智敏、正傑、炳煇、如因、俊仁、飯糰、牛哥、
美孏、阿邦、炎煒、林醫師、時泰,因為有你們共同的編織,在 704 的這幾年時 光中過得很繽紛快樂。雖然生活並非總是無憂無慮,但是我已滿足。
兩個月在 Bonn 的語言學習期間,感謝 Mama (Frau Rehn)對於我們這些來自台灣 的異鄉遊子關懷,因為您讓我每次回到 Bonn 總有回家的感覺。在 Freiburg 將近 一年半的日子裡,感謝 Prof. Hennig 能夠願意給我這個機會來到德國加入他們的 研究團隊,另外還要感謝我的兩位小老闆:Dr. Dominik von Elverfeldt 以及 Dr.
Martin Büchert,除了研究課題上的指導,另外還從他們身上學到很多德國人處 理事情一絲不苟的態度,而秘書 Frau Laurence Haller 的優雅身段,總是有條不紊 地打理著所有事情,感謝她在很多行政上文件的協助讓我在德國的期間很多事情 能迎刃而解,還要感謝 AMIR group 的成員們,是你們讓我的德意志生涯變得更 為多采多姿。
感謝俊延,我們一路從高中相識至今,一起在求學的路上轉了個彎,少了你我不 曉得還有沒有這樣的勇氣;感謝立峯、靜文,在課業或者社團、生活上的一路扶
持;感謝厚璁跟勁翰,雖然相隔太平洋的兩岸,但我們的友誼並沒有因此呈現r2
反比的衰減,你們給我的支持,我用再多的話也說不完心中的感動。
感謝牧宏,你總是我忠實的垃圾桶與情緒的出口還有最好的聽音樂會伙伴,帶領 我進入美妙的歌劇世界;感謝肇文,認識這麼多年你一直是我親愛的好學伴,你 的才氣與膽識讓我欽佩,在你身上我看到無限的夢想與勇氣;感謝梓程,你是很 棒的 partner,因為有你的激勵,研究所六年生涯中才能如此精采。
感謝王金花老師,生命中的喜怒哀樂能夠有老師一起分享,不曉得是累積幾世修
得的福分。我依舊記得您在畢業紀念冊上寫的那段泰戈爾的話:「生時麗似夏花,
死時美如秋葉。」我會盡力讓我的生命更加充實燦爛。
感謝家人與父母,雖然寥寥數語無法道盡對你們的感謝,但因為有你們的支持還 有對於年近三十還在吃老本的兒子的包容,才有這本論文的誕生。
2009 年 4 月 於台北
中文摘要
磁共振頻譜在臨床上的應用已有多年的進展,尤其在腦部研究上,更是經常被拿 來作為疾病的診斷。雖然維他命C在中樞神經系統中扮演相當重要的角色,但在 臨床上的磁振頻譜分析中卻從未有更進一步的討論。在這篇論文中,我們使用臨 床上經常使用的磁振頻譜脈衝序列,單點像素解析頻譜,搭配線性疊加模型分析 軟體,驗證分析得到的維他命C濃度是否值得信賴。在收集的 76 筆腦部頻譜資 料中,極大多數都可以成功偵測到維他命C的存在。另外我們模擬不同濃度的維 他命C頻譜加入三筆不同譜線寬的臨床資料中,發現模擬加入的濃度與分析得到
的濃度呈現相當好的線性關係 (R2 > 0.985)。因此認為,利用一般臨床的掃描程
序搭配線性疊加模型分析軟體即可穩定偵測維他命C,並且在一般臨床的頻譜分 析中應該加入維他命C的分析基底,減低對其他代謝物定量的誤差。
關鍵字:維他命 C 頻譜、臨床磁共振頻譜、單點像素解析頻譜、線性疊加模型
Abstract
Magnetic resonance spectroscopy (MRS) has been used in clinical applications, especially in brains, for many years. Even though vitamin C plays an important role in central nervous system, its analysis was not included in traditional MRS studies. To evaluate whether vitamin C is detectable, we used a clinical routine MRS sequence, point-resolved spectroscopy (PRESS), combined LCModel analysis, and verified the reliability of its estimated concentration. Seventy-six in vivo single voxel spectra were analyzed and vitamin C could be successfully detected from most of them.
Furthermore, we simulated multiple concentration levels by adding adapted ascorbate spectra to the in vivo data, and the results showed very good linearity (R2 > 0.985) between the added ascorbate concentrations and the LCModel estimated concentrations at three different linewidth cases. This dissertation demonstrates the ability to detect vitamin C in the human brain under common clinical MRS standards in combination with LCModel. Besides, it also supports the necessity to include ascorbate in the standard MRS analysis.
Keywords: vitamin C spectrum, clinical MRS, traditional PRESS, LCModel
Table of Contents
Chapter 1 Introduction to MRS
1.1 Background……….. 1
1.2 Theory and Data Acquisition……… 5
1.3 Three-Dimensional Localization Techniques………... 11
1.4 Improvements of Localization Techniques……….. 15
Chapter 2 Vitamin C: Function and Detection 2.1 Background of Vitamin C………. 19
2.2 Detection of Vitamin C………. 27
Chapter 3 Detectability and Reliability of Vitamin C Using MRS 3.1 Motives………. 33
3.2 Materials and Methods………. 37
3.2.1 In vivo Spectra Collection and Analyses………... 37
3.2.2 Virtual Titration………... 41
3.3 Results……….. 45
3.3.1 In Vivo Spectra Analysis……… 45
3.3.2 Virtual Titration………. 52
3.4 Discussions………... 61
3.5 Future Work……….. 70
Chapter 4 Conclusion……….. 73
References ……… 75
Lists of Figures
Figure 1. Absorption and dispersion signals of spectra………. 10 Figure 2. A typical short TE in vivo spectrum of human brain…………... 10 Figure 3. The sequence diagrams of STEAM, PRESS and 3DMRSI……... 14 Figure 4. The sequence diagrams of MEGA-PRESS and INS-PRESS……. 18 Figure 5. The structure of ascorbate and its proton spectrum……… 25 Figure 6. The relation between neuron density and the ascorbate content… 26 Figure 7. Plasma vitamin C concentrations after intravenous or oral
administration of vitamin C in healthy subjects………. 30 Figure 8. Vitamin C concentrations of human brain after intravenous
administration of vitamin C……… 31 Figure 9. Basis spectra of NAA, mI, Glu, Gln, and Asc……… 36 Figure 10. The locations of acquired spectra from human brains…………... 40 Figure 11. The estimated relative concentrations of five metabolites in five
different brain regions……… 48 Figure 12. The concentration differences between analyses in LCModel
“without” and “with” Asc basis vs. the concentration of Asc…… 49 Figure 13. Estimated Asc concentration vs. the CR-SDs of Asc and Glx…... 51 Figure 14. The estimated Asc concentration vs. the real Asc concentration... 58 Figure 15. The SNR of added Asc signal vs. the estimated concentration
accuracy of metabolites……….. 59 Figure 16. The impact of FWHM on the concentrations of different
metabolites dependent on the added Asc signal………. 60 Figure 17. The estimated baselines change under different levels of added
Asc concentrations………. 69
Lists of Tables
Table 1. Concentration ranges of some MR-detectable metabolites……… 31 Table 2. 1H chemical shifts of ascorbic acid and other metabolites………. 36 Table 3. The quantification results of simulated in vitro spectra…………. 56 Table 4. Statistical information for estimated FWHM values……….. 57 Table 5. Estimated concentration range of Glx and mI vs. FWHM values. 57
Chapter 1
Introduction to MRS
Magnetic resonance spectroscopy (MRS) is the only diagnostic MR technique that is generally used to distinguish various metabolites on the basis of their slightly different resonance frequencies or chemical shifts [1]. Only the nucleons, which the sum of the nuclear magnetic moments or spins does not equal to zero, can result in a net nuclear spin and be used in MRS. Two classes of the atomic nuclei are available for this technique: one requires an additional exogenous label, such as 13C, 19F and 17O, and the other does not, such as 31P, 23Na, and 1H. Up to now, 1H MRS is the most commonly used techniques for clinical research to analyze about 20 metabolic concentrations of brains and can possibly find out some biochemical processes.
1.1 Background
During 1920s to 1930s, the discovery of the proton spin nature and the research on the relation between spins and magnetic fields supported the development of nuclear magnetic resonance (NMR) [2-4]. When the nucleons with net nuclear spins are
exposed to a static magnetic field, the interaction between them would split the nuclear energy into distinct levels. The nucleons change their energy states only when absorbing or emitting photons and the photons should exactly match the energy level differences. The spectroscopy resulting from transitions between different spin states can then be resolved according to the frequency difference due to the energy proportional to the frequency. In 1946, Bloch and Purcell [5-8] found such a phenomenon and successfully measured the free induction decay (FID) signal resulting from precession from a water and a paraffin sample. Due to this work, they shared the Nobel Prize in physics in 1952. The chemical shift effect, which directly reflects the chemical environment of the nuclei in different resonance frequencies, is the fundamental of NMR spectroscopy. It was discovered in 1949 and showed that the nuclei of the same isotope bonding to different atoms within molecules would absorb energy at different resonance frequencies due to the slight magnetic field variation [9, 10]. However, the energy level differences of nuclei in an external field are much smaller than the thermal energy, and the population differences of the energy levels are only several ppms in magnetic fields on the order of several Tesla. Therefore, high magnetic fields, such as 1.5T or 3T systems, are commonly used to make NMR applicable for human studies up to now. Although a high magnetic field is the basic requirement for this technique, there are still some advantages for in vivo spectral
measurements. For example, the human body is nearly transparent in this radio frequency (RF) range. Hence, it would enable MR measurements of the whole body and get rid of the limitation of penetration depth or internal reflection. Furthermore, the contrast of MR images is better than ultrasound techniques, especially for soft tissues. Besides, the low-energy absorption makes NMR a non-invasive and non-destructive technique, which is a major advantage comparing to X-ray or computer tomography (CT) because of their ionizing radiation.
Because the human body contains about 70% water, the hydrogen nucleus is the most abundant atoms and can offer the highest signal-to-noise ratio (SNR) to NMR measurements comparing to other nucleons. In 1970’s, some research started to focus the interests in the water property in biological systems and they discovered that the relaxation times of malignant tumors were significantly different from healthy tissues [11, 12]. Then the in vivo NMR experiments using other nuclei developed soon. Moon and Richards [13] used 31P NMR on intact red blood cells to determine the intracellular pH level by measuring chemical shift differences. In the same year, Lauterbur applied position dependent magnetic fields (gradients) in addition to the static magnetic field to create the spatial distribution of the spins, which can be reconstructed in the form of an image [14]. Therefore, the gradient encoding approach
is the major constitution of modern MRI. Up to now, MRI and MRS have become complex techniques involving spatial localization, water or lipid signal suppression, and spectral editing for MRS, as well as time-varying magnetic field gradients, ultra-fast and multiple-parametric acquisition for MRI.
In spite of proton (1H) MRS is widely used for clinical applications, 31P and 13C MRS techniques have also become valuable clinical research tools. For example, ATP (Adenosine-5'-triphosphate) transports chemical energy within cells for metabolism, and its dephosphorylation form ADP is hardly detected in healthy tissue by 31P MRS [15]. Besides, 13C labeled MRS have also been used to assess regulation of various metabolic pathways, and the naturally abundant 13C signals of glycogen can be detected in vivo [16].
1.2 Theory and Data Acquisition
Hydrogen, which consists of only one proton, is the simplest nucleus with a non-zero magnetic moment. The frequency of NMR is determined by: (1) the gyromagnetic ratio γ (MHz/Tesla), which describes the magnetic property of the nucleus, and (2) the intensity of the magnetic field at the site of the nucleus. This is expressed by Larmor equation:
0
0 γB
ω = (1)
The magnetic field B0 is largely determined by the external field, but the proton is also highly sensitive to its chemical environment. The electronegativity is one of the factors. For example, due to the electronegativity of oxygen is larger than that of carbon, the hydrogen bonding to oxygen is less shielded by electron cloud. Therefore, the protons are more directly affected by the magnetic field B0, and B0 would do less effect on the protons with stronger shielding. The total magnetic field can be expressed as:
) 1
0( i
i B
B = −σ (2)
) 1
0( i
i γB σ
ω = − (3)
, where σi is the chemical shielding term of nucleus i, and ωi is the corresponding resonant frequency. This phenomenon is chemical shift, which causes protons to
resonate at different frequencies in different chemical environments, and the spectral peaks at different frequencies are viewed as the characters of the molecules.
The normal display of MRS is from left to right showing the frequencies from high to low due to historical reasons related to the use of continuous wave NMR.
Besides, chemical shifts are often expressed in ppm to avoid the dependence on the magnetic field strength.
0 0)/ (ω ω ω
δi = i − (4)
In eq. (4) ω0 is the reference frequency and δi represents the relative difference, which is known as chemical shift and independent from B0. Tetramethylsilane (TMS) is used as the reference compound for 1H MRS.
The B1 field is applied as RF pulse to excite the magnetization into transverse plane to acquire the MR spectra. The magnetization precesses about B0 at Larmor frequency and induces an electromotive force (EMF) in the receiving coil positioned in the transverse plane. The time dependent signal is called free induction decay, which depicts the complex magnetization motion in transverse plane and can be expressed as:
∑
−∝
i
i i
i j t t T
M
FID 0 exp( ω0 / 2* ) (5)
Here the index i represents different metabolites, ω0 is frequency shifts, T2* is the relaxation time of each metabolite including the effect of T2 relaxation and B0
inhomogeneity, and M0 is the total number of spins which is proportional to the concentrations of metabolites. After the Fourier Transform of eq. (5), the FID signal in frequency domain can be written as:
∑
+ − + + − −=
i i i
i i i i i
i i
T T
j M T
T
S M )
2 ) (
1
) (
2 2
) (
1 ( 2 )
( 2 *2
0 0
*2 0
*2 2 0
* 0
ω ω
ω ω ω
ω ω (6)
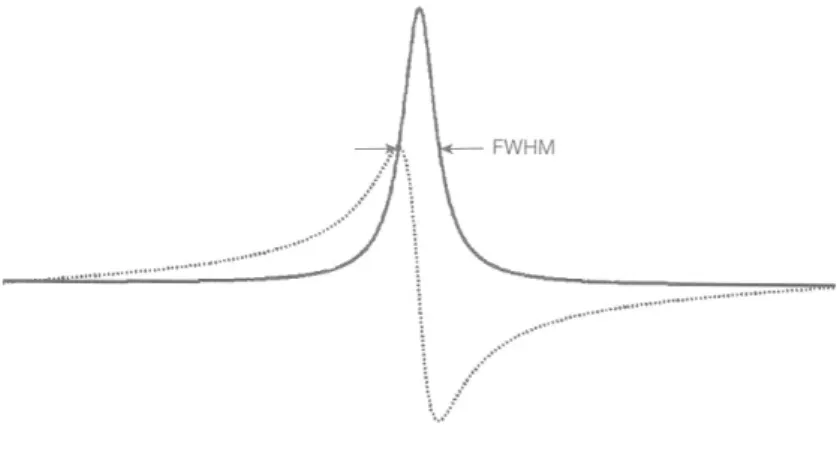
The real part and the imaginary part of eq. (6) represent the absorption and the dispersion components of a Lorentzian function, respectively. The full-width half-maximum (FWHM) of the absorption component equals to 1/T2*. Because the linewidth of the real part is narrower than that of the imaginary part, it is easier to distinguish multiple metabolite peaks in MRS (Fig. 1). Therefore, phase correction is necessary to get pure absorption components before quantification.
The 1H spectrum of human brain is a superposition of about 20 low concentration metabolites. Because the protons with polar bindings to oxygen and nitrogen detach too fast in aqueous solution to be detected, only the carbon-bound protons, in the form of CH, CH2 and CH3, can be observed in the in vivo 1H spectra. Typically the carbon bound protons possess similar chemical environments, and the dispersion of Larmor
(VOI) is a critical issue before MRS experiments. However, some other problems occur even though highly homogeneous field within the VOI achieves. Lipids and some macromolecules may cause baseline drift due to their broad resonance lines during the acquisition with short echo times (TEs). The concentration of water molecule is about 55M, which is much higher than other metabolites (about several millimolar), so the water signal is another problem for proton MRS. For this reason, the water signal has to be removed as much as possible from proton MRS to avoid the obscuration of other spectral lines from metabolites in general use. Water suppression, which is based on the design of the frequency selective RF pulse at around 4.7 ppm, is usually done before FID acquisition. Therefore, metabolites with frequencies close to the water resonance are often either suppressed as well, or sheltered by the remaining water spectrum.
MR spectra can be characterized by resonance frequencies and signal amplitudes in most cases using short TE acquisitions. An additional feature called j-coupling is the coupling between two nuclear spins due to the influence of bonding electrons on the magnetic field running between the two nuclei [17, 18]. The coupling results in the splitting of the resonance lines into a complex peak (doublet, triplet, or multiplet), and the space between these peaks are described by j-coupling constant, which is
independent from magnetic field strength. This phenomenon causes more complicated spectral patterns and reduces the sensitivity of MRS for the most part. Some methods take the advantage of j-coupling to detect lactate with higher SNR [19].
From above, we can observe that spectral overlap in small range, broad resonance lines, distorted baselines, incomplete water suppression and line splitting would result in more complicated identification and quantification of many metabolites. Only N-acetyl aspartate (NAA), choline (Cho), and creatine (Cre) can be easily distinguished in healthy human brains (Fig. 2). Metabolites such as glutamate (Glu), glutamine (Gln), γ-aminobutyric acid (GABA), lactate and vitamin C still raise much interest recently because of their important metabolic functions. Therefore, some spectral editing techniques were developed to observe these overlap peaks in a small chemical shift range [20-23].
Figure 1. Comparison of shapes of absorption (the real part spectrum, solid line) and dispersion (the imaginary part spectrum, dotted line) signals. Spectra are usually processed phase correction to get pure absorption-mode peaks and achieve narrower line width [24].
NAA
Cre
Cre
Figure 2. This figure is adopted from Dr. Natt’s work [25], which shows a typical short TE in vivo spectrum of the human brain. Only the peaks of NAA, Cre and Cho can be easily observed.
1.3 Three-Dimensional Localization Techniques
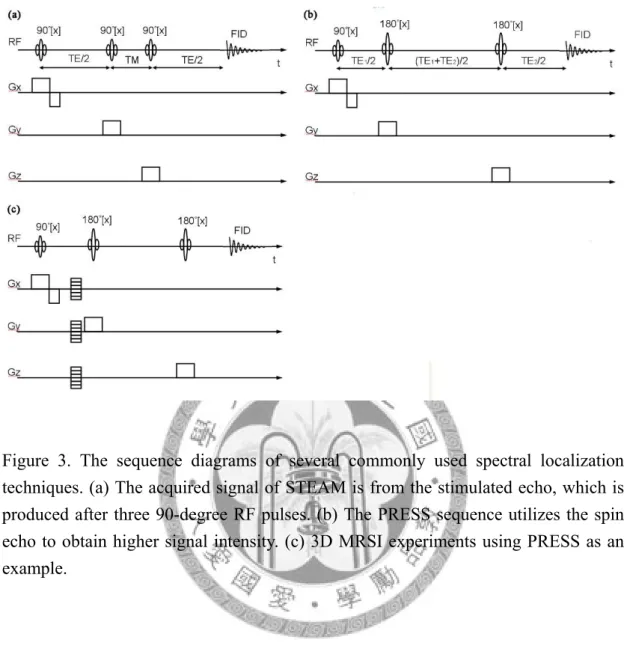
Using successive excitation of three orthogonal slices, the VOI is defined by the intersection of the three slices. Although the localization methods developed many variations in the past twenty years, only some of them emerged as the most viable for use in human, especially in clinical studies, for example, stimulated-echo acquisition mode (STEAM) and point-resolved spectroscopy (PRESS).
The STEAM experiment was first demonstrated as a feasible localization method for proton spectroscopy of the human brain by Frahm et el [26]. The sequence diagram of STEAM is shown in Fig. 3(a), which consists of three 90-degree selective pulses, each with an orthogonal gradient to excite a slice. Gradient refocusing lobes must be used because of these 90-degree pulses. After the last 90-degree RF pulse, four echoes are produced: one is at TE/2 – TM, which results from the first and the second RF pulses, another is at TM, which comes from the second and the third 90-degree pulses, the stimulated echo is at TE/2, and the last one at TE/2 + TM comes from the first and the third pulses. Although STEAM sequence is simple and robust, the stimulated echo yields only about half of the possible signal from the VOI comparing with the spin-echo technique, such as PRESS. Besides, it is not suitable for
observation of nuclei with very short T2, for example 31P, even though it can achieve a shorter TE during data acquisition.
The PRESS experiment consists of a 90-180-180-degree pulse sequence, and each RF pulse is applied in the presence of an orthogonal gradient (Fig. 3(b)) [27]. This sequence retains the full signal, which leads to a better SNR than STEAM, but the TE values could not be as short as those used in STEAM sequence. Therefore, it is not so advantageous to observe the proton metabolites with shorter T2, which cause more rapidly decaying signals. Furthermore, the modulation from j-coupling can be reduced more using short TE STEAM than that using short TE PRESS sequence. For the reason to obtain a better SNR of the in vivo spectra, the short TE PRESS sequence is commonly used in many clinical studies [28].
Magnetic Resonance Spectroscopic Imaging (MRSI), which was originally
named the chemical shift imaging (CSI), refers to the spatial information which is encoded by switched gradients in the B0 field. The basic pulse sequences are very similar to a gradient-echo or a spin-echo sequence, and in Fig. 3(c) we take a 3D MRSI using PRESS for localization as an example. In principle, although the multiple-voxel resolution can be achieved by repeating single-voxel acquisitions, the
efficiency of data collection can be much increased. Therefore, data over volumes are obtained in a time period comparable with that used for a single-volume method, and can be displayed in an image or a spectral format. This technique evolved in the early 1980’s by adding a spectral dimension to MRI. Due to these advantages, it has developed into a versatile technique which is frequently used in clinical studies [29].
However, some difficulties still remain. The complete acquisition of 2D or 3D MRSI data is very time-consuming because each voxel in k-space has to be acquired independently using the phase encoding steps. Besides, the volumes are not as sharply defined as in single volume methods [30], and it is difficult to quantify the metabolite levels. To shorten the examination time appropriate for clinical use, many fast spectroscopic imaging sequences have been developed during the past ten years, such as multiple-echo spectroscopic imaging [31], and proton echo-planar spectroscopic imaging (PEPSI and EPSI) [32, 33]. Though the reduced scan time makes the technique more applicable to clinical research, the SNR and the spectral resolution are not as well as the spectra acquired in single-voxel technique. Furthermore, the outer-volume suppression (OVS) pulses should be added to minimize contamination of spectra by the strong lipid signals originating from subcutaneous tissue adjacent to the scalp.
Figure 3. The sequence diagrams of several commonly used spectral localization techniques. (a) The acquired signal of STEAM is from the stimulated echo, which is produced after three 90-degree RF pulses. (b) The PRESS sequence utilizes the spin echo to obtain higher signal intensity. (c) 3D MRSI experiments using PRESS as an example.
1.4 Improvements of Localization Techniques
After the demonstration of these basic localization methods, some advanced proton MRS techniques were developed to improve the quality of in vivo spectra. Some methods simplify the appearance of spectra for better observation and quantification of one or more metabolites of interest, which can be classified to the spectral editing techniques. Besides spectral editing techniques, the magnetic field stability is another factor that affects the quality of spectra, especially in high-field systems. Even small drift of B0 would lead to spectral distortion, including the broadening of spectral lines and the loss of phase coherence.
Most spectral editing techniques are dependent on the phenomenon of j-coupling.
For example, the doublet of lactate at around 1.3 ppm or the multiplet of GABA uses the concept to get higher spectral SNR. MEGA-PRESS is one of the spectral editing methods, which based on the fundamental spectral acquisition techniques PRESS and combined the ideas of water suppression and j-coupling spectral editing simultaneously. The solvent suppression sequence element MEGA can be placed within any pulse sequence with an element to refocus transverse magnetization, and it utilizes gradients surrounding the frequency selective pulses to dephase transverse
magnetization (Fig. 4(a)) [34]. There are some advantages of MEGA, including its relatively insensitive to the pulse flip angle errors of the frequency selective pulses, not introducing phase distortion to spectral peaks, and easy to implement because of these identical frequency selective pulses. Furthermore, MEGA can be used to suppress several resonances by applying multi-banded pulses [35]. Therefore, some metabolites, such as glutathione (GSH), GABA, and vitamin C are proposed to use this technique to observe their spectra more easily [23, 36]. Even simultaneously editing two metabolites, which is called double editing, is possible [37]. Although spectral editing is a solution to advance the spectral quality for target metabolites, it doubles scan time than traditional techniques and may not be so applicable for clinical uses.
Interleaved Navigator Scan (INS)-PRESS is one of the techniques to reduce the
spectral distortion resulting from field instabilities, which is a more critical problem for high field systems [38]. It uses the navigator signals to correct the spectrum distortions from field drifts, eddy current and susceptibility effects, and the acquisition of navigator signals for artifact and motion correction is well developed in several MR imaging techniques [39-41]. Typically, a non water suppression spectrum would be acquired after the spectral acquisition with water suppression to correct the effects
from eddy current. Due to the low SNR of the spectrum, it is necessary to increase the numbers of acquisition and takes several minutes to finish a spectrum. Therefore, it is impossible to get the non water suppression spectrum immediately to correct the effects from eddy current. In INS-PRESS, the navigator signals is prepared and acquired after each acquisition of the FID using small angle excitation to minimize saturation effects and leave the metabolite signal nearly undisturbed (Fig. 4(b)). It also brings more efficient eddy current correction, reduces the sensitivity to susceptibility changes and does not prolong the scan time for most clinical applications at general TR values (about 3 sec).
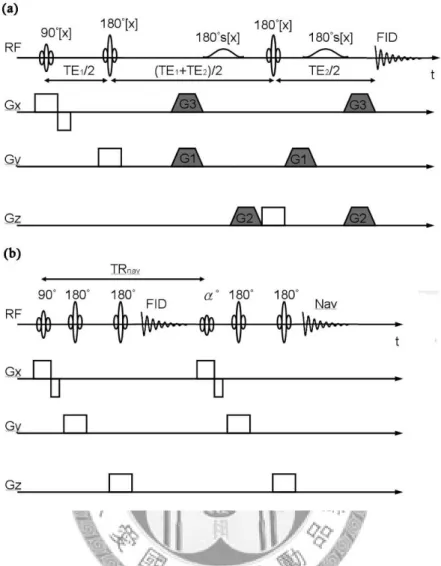
Figure 4. (a) The sequence diagram of MEGA-PRESS. Based on the structure of PRESS, G1 to G3 are used for MEGA implementation, and the RF 180°s represents the frequency selective pulse. A single-banded frequency selective pulse is used for only water suppression, and multiple-banded one is additionally used for editing of other metabolites. (b) INS-PRESS is also implemented based on PRESS. After the water suppression (not shown) and the typical PRESS spectral acquisition, the excitation and acquisition of navigator signal is executed right away. Only a low flip angle excitation (~20°) is used for navigator signals to minimize saturation effects.
Chapter 2
Vitamin C: Function and Detection
L-Ascorbic acid (vitamin C, Asc), which appears physiologically as the ascorbate anion in the body, is an important antioxidant, enzyme co-factor and neuromodulator in the brain. The recent studies of vitamin C included its role in clinical nutrition, pharmacokinetics, and regulation in plasma or brains [42-44]. However, the typical method for vitamin C detection and quantification is invasive, for example, taking blood samples, which are not applicable to acquire the in vivo data from human brains.
Recently, some of the non-invasive methods using MRS were developed to possibly acquire the spectrum from living brains [23, 45], but their time-consuming made this technique not practical for clinical applications.
2.1 Background of Vitamin C
Vitamin C (formula: C6H8O6) is a water soluble, hexonic sugar acid with a molecular weight of 176.13, and the pKa values of its two dissociable protons are 4.2 and 11.8.
Therefore, the ascorbate anion exists at physiological pH (Fig. 5(a)) [46]. Via proton
MRS measurements, the resonance peaks of ascorbate occur at 3.73, 4.01, and 4.50 ppm resulting from the protons from C6, C5, and C4, respectively (Fig. 5(b)). In most animals, ascorbic acid can be synthesized from D-glucose, but can not in humans, nonhuman primates and guinea pigs because of lack of L-gulono-γ-lactone oxidase, which is required for the last step of ascorbate biosynthesis [47]. Although these species lose the ability of ascorbic acid synthesis, vitamin C is still very important to maintain the physiological functions and available from dietary sources.
Ascorbic acid plays an important role in many aspects. It is one of the essential antioxidants to provide protection from the toxic effects of reactive oxygen species (ROS), which are generated as by-products of normal aerobic respiration, during inflammation and after exposure. As an antioxidant, ascorbate protects the vascular endothelium and helps maintain normal cardiovascular function [48]. Besides, it decrease the damaging effects from nitrosamines in gut [49]. Some of important chronic diseases, chronic inflammatory diseases, and diabetes are related to oxidative stress [50, 51]. When the content of antioxidant is not sufficient to protect the body from ROS, oxidative stress would develop. Therefore, the reduced ascorbate levels would expose the vascular endothelium to oxidative stress, lead to endothelial dysfunction and raise the risk of cardiovascular disorders.
McGregor and Biesalski [42] considered that the restoration of ascorbate levels could be of significant clinical benefit. For example, the parenteral high-dose vitamin C reserved the effects of oxidative stress and allowed the recovery of cardiovascular function. There was also a study in heavy smokers during acute bronchial infection, giving a high oral dose (2g/day) treatment of vitamin C to improve impaired lung function [52]. Some research articles have reported that many cancer patients had extremely low vitamin C levels [53, 54]. Those patients of lower vitamin C status also showed shorter survival time. For the cancer patients suffering from acute oxidative stress during chemotherapy, the parenteral high-dose vitamin C has been shown to reduce the toxic side-effects of chemotherapy [55].
In recent two decades, the research about Alzheimer disease (AD) and multiple sclerosis (MS) was also very significant in image or metabolism analysis. Many evidences supported the role of oxidative stress in AD and MS. The oxidative stress, which is linked to abeta-lipid interactions, plays a pathogenetic role in AD. The research from Galbusera et al [56] treated the subgroup of mild and moderate AD patients with vitamin C and E for three months, and found that the plasma lipoperoxidation susceptibility decreased by 60%. A more direct evidence was found
by Charlton et al [57]: Plasma vitamin C levels were lower in the dementia and AD group compared to controls, which was not explained by their dietary vitamin C intakes. Such a phenomenon was also found in MS patients. The serum levels of ascorbate and other three antioxidant vitamins were significant lower in MS group compared to controls [58]. Besides, high-dose antioxidant supplementation (vitamin C 2g/day, vitamin E 480 mg/day) was also recommended for MS patients [59].
Ascorbate also shows significant functions in central nervous system (CNS). After ascorbate is acquired from the diet, it is distributed to all organs in the body via blood supply, with the concentration of plasma typically about 50 μM [60]. However, the concentration of ascorbate in brains is increased up to roughly 100-fold compared to plasma, which implies a large-amount demand of vitamin C there. Because human beings have lost the ability to synthesize vitamin C, the only source of vitamin C is from diet, and intestinal absorption capacity of it is limited by the amount of sodium-dependent transporter [61, 62]. Furthermore, the content of vitamin C in most tissues less than 100 μM are controlled with blood level corresponding to a steady state between intestinal uptake and renal clearance.
To maintain such high levels of vitamin C in brains, active transport is essential
for its regulation. Ascorbate uptakes from blood into cerebrospinal fluid (CSF) at the choroids plexus via the active, stereo-specific, sodium-dependent transport [63]. The ascorbate concentration of CSF and extracellular fluid (ECF), about tenfold higher than that of plasma, is in equilibrium because of diffusion of CSF ascorbate to ECF.
Then ascorbate is transported from ECF into neurons or glia. The average estimated concentration of ascorbate is about 10 mM in neurons and 1mM in glia. Therefore, the ascorbate concentration of overall brain tissue is several millimolar [44], and the cortical ascorbate content increases with the increase of neuron density across species (Fig. 6(a)). Besides, Fig. 6(b) shows the relationship between the change in neuron density and the ascorbate concentration in the developing rat brain. In cerebral cortex, tissue ascorbate content is highest after birth with nearly a pure neuronal population and only few immature glia cells. With the cortical gliogenesis, ascorbate levels decrease in the next few weeks.
Normally the turnover of ascorbate in brains is about 2% per hour [60]. Although the concentration of ascorbate is much higher in brain than in other tissues, it is retained tenaciously even under the condition of ascorbate deficiency, with decrease of less than 2% per day [64]. As a result of that ascorbate prevents several diseases originating from oxidative stress, it is suspect the ascorbate levels of brains relate to
AD or MS, which have been reported the lower plasma ascorbate levels in these patients compared to normal volunteers.
(a)
(b) C6
C5
C4
Figure 5. (a) Molecular structure of L-ascorbic acid as the ascorbate anion (left). After the loss of two electrons and one proton, the oxidation form, dehydroascorbate, is produced. (b) The proton spectrum of vitamin C. Three resonance peaks reflect the proton resonance from three different chemical environments, C4 (at 4.5 ppm), C5 (at 4.01 ppm), and C6 (at 3.73 ppm).
Figure 6. (a) The relation between ascorbate content in adult cerebral cortex and neuron density in different species. The intercept of y-axis was used to estimate the concentration of ascorbate in glia, which would be the theoretical cell population when neuron density was zero. Data are n = 9-61 samples per mean and R2 = 0.997. (b) The development changes in ascorbate content, including actual (square points) and calculated (circles) data, during gliogenesis in the rat cortex. In order to calculate an ascorbate concentration in neurons of 10 mM, cortical ascorbate content at postnatal day 3 (P3) and cerebellar content at P15 were used with appropriate intracellular and extracellular volume fraction data [44].
2.2 Detection of Vitamin C
The detection and quantification of vitamin C is essential and helpful for research, especially the non-invasive methods. However, the invasive methods are commonly used due to their higher sensibility to possibly determine the metabolites of low concentrations even though it is not applicable to all aspects to collect the data from the living subjects. For example, plasma ascorbate concentration is often determined by directly collecting blood samples and then using high-performance liquid chromatography. Biopsy is used to measure its concentration of some specific organs, but not available to collect the data from living brains.
The development of MRS provides one of the non-invasive methods to measure chemicals within the body. Because of the limitation of MRS, the chemicals would be detectable at least the concentration larger than hundreds of micro-molar (Table 1).
However, the concentration of vitamin C in human brain is within the range of several millimolar [44], it is hence high enough to be detectable via proton MRS. Dr. Terpstra and her colleagues [23, 37, 45] have proposed to use a spectral editing method to detect and quantify the concentration of ascorbate and other antioxidants, and their results are comparable to those estimated by using other methods.
When blood ascorbate levels are below 70 μM, the kidney’s sodium-dependent vitamin C transporters would reabsorb ascorbate to prevent the loss by renal clearance [65]. However, when the ascorbate concentration is higher than 70 μM, the body would excrete ascorbate more rapidly [66]. The plasma half-life of ascorbate is dependent on the intake. During the period of deficient intake, the plasma half-life of ascorbate is between 8 to 40 days [67], and ascorbate has a half-life time of about 30 minutes when the higher intake levels lead to more rapid excretion [68]. Some early clinical studies of vitamin C reported the benefits to use high-dose treatment on some diseases suffering from oxidative stress, such as cancer. However, studies about its pharmacokinetics of high-dose treatment are still rare in the recent decade. How much vitamin C needs to be administrated via the intravenous or oral route to achieve the desired concentration and how long it takes are questions that remain to be answered.
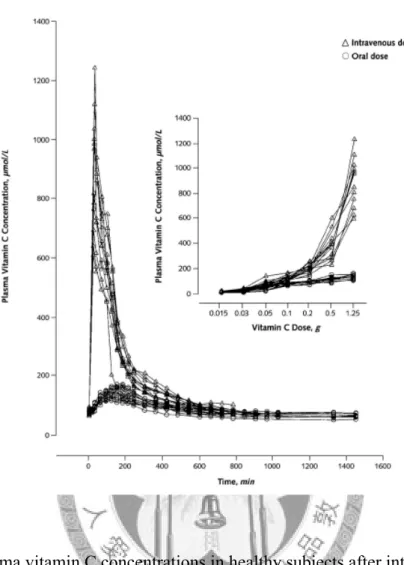
Dr. Padayatty and his colleagues [43] discussed the plasma vitamin C concentration varying with the route of administration, oral and intravenous use, in healthy volunteers. Vitamin C concentrations are tightly controlled when using oral dose and only intravenous administration can produce high plasma vitamin C concentrations (Fig. 7). Besides, the plasma concentrations reach the maximal values
immediately after the intravenous administration, while they arrive at the peaks with about 3 hours delay after oral supplements. The pharmacokinetic data at high intravenous dose of vitamin C in cancer patients are still sparse, and such research about brains is even rare. Fig. 8 shows the preliminary results from two healthy volunteers [69]. The concentrations of vitamin C in human brains reach the maximum in about 24 hours after intravenous bolus, with only 30% to 40% of increment, which implies that the concentration of vitamin C is also strictly controlled in human brains.
It is essential to collect more in vivo spectra data from healthy volunteers and patients for further investigations.
Figure 7. Plasma vitamin C concentrations in healthy subjects after intravenous or oral administration of vitamin C. The larger subfigure shows the change of plasma vitamin C concentration after the 1.25-g oral or intravenous dose administrated at steady state (N = 12). The inset subfigure shows peak plasma vitamin C concentrations as a function of dose after oral or intravenous administration of vitamin C [43].
Figure 8. It shows the normalized concentration change of ascorbic acid and the sum of glutamine, glutamate and glucose after an intravenous bolus of 3-g ascorbic acid.
The spectral data were acquired from occipital lobe. The ascorbate concentration reaches a maximal value in about 24 hours after the intravenous bolus [69].
Table 1. Ranges of some steadily MR-detectable metabolite concentrations reported for normal adult human brains and biopsy tissues [70].
Metabolites Concentration range (mmol/kgww)
NAA 7.9-16.6 (average 10.3)
NAAG 0.6-2.7 Choline (total) 0.9-2.5
Creatine 5.1-10.6 Glutamate 6.0-12.5 Glutamine 3.0-5.8 Myo-inositol 3.8-8.1 Phosphocreatine 3.2-5.5 Aspartate 1.0-1.4 GABA 1.3-1.9
Chapter 3
Detectability and Reliability of Vitamin C Using MRS
3.1 Motives
The importance of vitamin C has shown in many previous studies. It relates to the storage of iron and stimulation of the immune system. It also has the connection with some brain diseases, such as AD and MS as well as its correlation to age. Furthermore, it is the most concentrated non-enzymatic antioxidant in the central nervous system.
Since vitamin C plays a significant role in brain functioning [44, 71], a non-invasive and quantitative detection method of vitamin C in the human brain would be highly desirable.
The concentration of ascorbate in brains is about proportional to neuron density, and its concentration in human brain is roughly 1.0 mM [44]. This level is sufficiently high to be detectable with MRS. However, in traditional clinical routines of MRS, the concentration of ascorbate was not discussed and even its component was not
included during MR spectral analysis. Table 2 shows the chemical shifts of ascorbate and other metabolites, which possess the chemical shifts close to it [70, 72, 73]. Due to the multiple overlaps with the spectra of other metabolites, such as Gln (C2H group at 3.75 ppm), Glu (C2H group at 3.74 ppm) and myo-inositol (mI), therefore, it is not trivial to quantify the concentration of ascorbate (Fig. 9). To evaluate the detectability of ascorbate and the possible impacts on other evaluated metabolite concentrations, we focused on Gln, Glu, and mI as they all own resonance peaks close to the most prominent ascorbate signal at 3.73 ppm.
The detection of ascorbate was recently reported in human subjects at 4T and in rat brain at 9.4T by MEGA-PRESS edited spectroscopy [23, 45]. Although the technique is based on the typical 3D localization spectral acquisition method, PRESS, it is more time-consuming for several reasons. Such a spectral editing method needs to be acquired twice, one time for with and the other for without frequency selective RF pulse. Thus, the scan time at least becomes double (Fig. 4(a)). Besides, the longer TE acquisition of spectra sacrifices the SNR, so it is essential to increase the number of average to compensate the loss of the signal.
In order to avoid these disadvantages and apply MR spectroscopy techniques to
vitamin C quantification, we use traditional PRESS sequence on a clinical 3T MR scanner to acquire in vivo spectra. The goal of this thesis is to evaluate the possibility and to verify the reliability of detecting vitamin C in human brains by using clinical standard 3T MR spectroscopy methods.
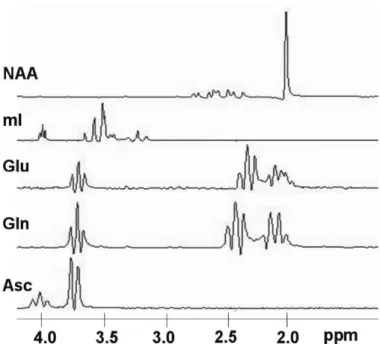
Figure 9. Basis spectra of NAA, mI, Glu, Gln, and Asc. These spectra were used in LCModel analysis and the resonance peaks of Glu, Gln, and Asc are close to each other at about 3.75 ppm.
Table 2. 1H chemical shifts of ascorbic acid and other metabolites. The metabolites that possess resonance peaks close to ascorbic acid are listed. DD, double-doublet; M, multiplet; Q, quartet; T, triplet [70, 72, 73]
Metabolites Group Chemical shift Multiplicity
Asc C6H2 3.73 M
C5H 4.01 M
C4H 4.50 D
mI (Ins) C1H 3.52 DD
C2H 4.05 T
C3H 3.52 DD
Glu C2H 3.74 DD
Gln C2H 3.75 T
GPC C8H2 3.66 M
PCh C2H2 3.64 M
PE C1H2 3.98 M
Lac C2H 4.10 Q
NAA C2H 4.38 DD
Glc αC6H 3.83 DD
βC6’H 3.75 DD
αC6H 3.88 DD
βC6’H 3.71 DD
3.2 Material and Methods
3.2.1 In Vivo Spectra Collection and Analyses
From our data archives we collected 76 in vivo single voxel spectra (SVS) of 49 subjects from different brain regions. These included cerebellum (25 cases, average age = 27.50 ± 6.35 years), frontal lobe (29 cases, average age = 28.56 ± 6.77 years), occipital lobe (7 cases, average age = 29.43 ± 16.28 years), parietal lobe (10 cases, average age = 18.60 ± 16.09 years), and others (5 cases, average age = 26.40 ± 15.61 years) (Fig. 10). These spectra were acquired on a 3T Siemens Magnetom Trio system (Erlangen, Germany) with a common PRESS sequence, voxel size = 8 cm3, TE = 30 ms, TR = 3000 ms, NEX = 128 (with water-suppression), 1024 complex data points, a receiver bandwidth = 1200 Hz (centered on the water resonant frequency) with a standard 1H quadrature single-channel coil.
In order to observe the impact on other metabolite concentrations if Asc was included in the LCModel (v. 6.1-4A) estimation [74], these data were fitted twice within the spectral range of 0.2-4.2 ppm in the frequency domain. We included 14 metabolites in the standard basis-set: aspartate (Asp), Cre, GABA, glucose (Glc), Gln,
Glu, glycerophosphocholine (GPC), guanidoacetate (Gua), phosphocholine (PCh), mI, NAA, N-acetylaspartylglutamate (NAAG), scyllo-inositol (Scyllo), and taurine (Tau).
The analyses were operated once using the basis-set with an Asc basis spectrum (15 metabolites included in total) and once without the Asc basis spectrum (14 metabolites). To simplify the discussion of this approach we will use the description
“with” and “without” Asc basis throughout the following.
Metabolite concentrations were evaluated as creatine ratio (1/Cre). The differences of the estimated concentrations using a “with” Asc and a “without” Asc basis set analyses were calculated for each metabolite. This was done by deducting the “with”
Asc results from the “without” Asc results. The inter-individual standard deviations (SDs) of these estimated metabolite concentrations were calculated to depict variations of these metabolites in various regions. Furthermore, we evaluated the consistency of the estimated concentrations of different metabolites through comparing these SDs.
In order to verify the reliability of LCModel analysis of Asc concentration we simulated a “virtual titration”, where a modified Asc spectrum was added to a human
in vivo spectrum from the collected data were chosen, with different FWHM values
(0.076, 0.043 and 0.033 ppm) representing the linewidth range of the evaluated in vivo spectra. The FWHM values of in vivo spectra are actually the spectral line-width of NAA evaluated by LCModel.
The modifications adapted the ideal Asc basis spectrum according to the line shape, linewidth, and phase characteristics of the in vivo spectra before they were added. The necessary parameters for this purpose were derived from the corresponding in vivo spectra by LCModel. These parameters were related to some features of the in vivo spectrum and were applied to the ideal Asc basis using eq. [1]
in Ref. [74] to obtain the modified Asc spectrum. Six different Asc concentration levels were included: 0.1 mM, 0.2 mM, 0.5 mM, 1.0 mM, 1.6 mM, and 2.0 mM. For further details of this process, refer to the paragraph Virtual Titration section below.
In addition, the impact of SNR was evaluated. For this purpose the Asc spectrum SNR was altered to values of 20, 10 and 5 before adding it to the in vivo spectra.
Random noise signals were added with different amplitudes in order to change the SNR of the Asc signal. Here, the SNR is defined as the maximum amplitude of the Asc signal divided by the mean amplitude of the generated random noise in the frequency domain.
Figure 10. The acquired spectra from human brains are mostly from (a) parietal lobe, (b) occipital lobe, (c) cerebellum, and (d) frontal lobe. The large plot of each subfigure shows the sagittal view of the human brain. The upper right one and the lower right one show the corresponding coronal and transverse views, respectively.
All the voxel sizes of these spectra are of 2x2x2 cm3.
3.2.2 Virtual Titration
The virtual titration experiment aims to modify the Asc basis and then add it to the in
vivo spectra to observe whether the estimated concentration of Asc would be
proportional to the artificial added Asc concentration. Modifications were done to explore various Asc basis spectra, reflecting the possible range of the in vivo spectra.
The formulas for the modification are from the appendix of Ref. [74], which describe the parameters taken into consideration and their constraints during curve fitting.
LCModel uses the concepts of linear combination to describe the analyzed spectra as the superposition of each spectrum of the corresponding metabolites with different weightings. In other words, parameters Cl in eq. (7) are the concentrations of the NM
metabolites. Due to the magnetic field inhomogeneity, the lineshape coefficients Sn in eq. (7) are responsible for peak distortions. The NM metabolite spectra of the in vitro basis set can be written as Ml(ν;0,0). In the meanwhile, the parameters εl account for small errors in referencing the spectra, and the parameters νl relate to shorter T2
of in vivo spectra. The zero- and first-order phase corrections are φ0 and φ , and the 1 baseline is represented by the summation of βjBj(νk). Therefore, the fitted spectrum can be modeled as eq. (7) starting from the in vitro spectra and the difference )
ˆ( Y νk
of it and the real in vivo spectrum should be minimized. Equation (8) represents the relation between FID signals of metabolites (ml) and their spectra, where F indicates the discrete Fourier transform.
] ) ,
; ( )
( ))[
( exp(
) ˆ(
1 1
1
0
∑ ∑ ∑
= + = =− −
+
−
= B M S
S
N
j
N
l
N
N n
l l n k l n l k
j j k
k i B C S M
Y ν φ ν φ β ν ν γ ε (7)
)}
) (
exp(
) ( { ) ,
;
( m t i t
Ml ν γl εl = F l −γl + εl (8)
First, an in vivo spectrum was analyzed in LCModel to estimate the concentrations of different metabolites. The evaluated parameters for baseline correction, phase adjustment, line shape, spectral shifting, and line broadening are logged in addition to the actual analysis result. In the next step, these parameters, which represent the features of this in vivo spectrum, are applied to modify the Asc basis spectrum to create an artificial Asc spectrum and change the concentration of the artificial signal by changing its amplitude. Additionally, a randomly generated noise signal is added to this modified Asc spectrum. This is done to achieve a certain SNR in the resulting dataset. Then this modified Asc spectrum (including noise) and the in vivo spectrum are combined to create a new spectrum. This final spectrum is analyzed in LCModel to observe the effects on concentration estimation before and after adding the modified Asc signal. For each case with a certain added concentration, we generated the random signal 10 times to create 10 modified in vivo spectra with the same SNR
metabolite concentrations and their SDs were calculated and used for comparison to determine the impact of SNR.
Before applying virtual titration to general in vivo spectra, we extracted spectral information of each metabolite from the analysis basis-set and created some artificial spectra with different weighting combinations to simulate the in vitro spectra acquired from uniform phantoms. In order to approach the reasonable in vivo metabolic spectra in human brains, the simulated concentrations of metabolites are chosen according to some previous review articles [44, 70]: NAA 10 mM, Cre 7.5 mM, PCh 0.6 mM, Lac 0.4 mM, Asp 1.2 mM, mI 6.0 mM, Glu 8.0 mM, Gln 4.5 mM, and Glc 1.0 mM.
Because the resonance peaks of last four metabolites are close to each other, we added them gradually into the simulated in vitro spectrum instead of at once. The combined spectrum was analyzed in LCModel to check if the quantification is consistent with the initial concentration settings. It would be helpful to clarify the overlapping effects between different metabolites during spectral curve fitting when proceeding virtual titration. Ascorbate is the target metabolite of virtual titration. Therefore, we changed the concentration of ascorbate to 0.2 mM, 0.5 mM, 0.8 mM, 1.0 mM, 1.5 mM, 2.0 mM, and 5.0 mM, and added it to the simulated in vitro spectrum. These spectra were analyzed in LCModel to observe the relationship between estimated concentrations
and real concentrations of ascorbate.
In this dissertation, we first showed the analysis results from in vivo spectra and compared the quantification difference between the results from the analysis basis-set without and with ascorbate basis. Besides, the Cramér-Rao Lower Bounds (CR-SD) of glutamine and glutamate in two analyses were compared to make the impact on quantification using different basis-sets more clearly. In order to verify the feasibility of virtual titration, we demonstrated the quantification results using simulated in vitro spectra. Furthermore, virtual titration was applied to in vivo spectra and discussed the quantification effects resulting from different spectral SNR values and linewidths to verify whether vitamin C in human brains could be stably detected and quantified via traditional PRESS sequence and LCModel analysis.
3.3 Results
3.3.1 In Vivo Spectra Analysis
The in vivo spectra analysis results derived from LCModel were classified into five regions and are shown in Figs. 11 and 12. In three cerebellum and two frontal lobe spectra the Asc concentrations could not successfully be evaluated by LCModel.
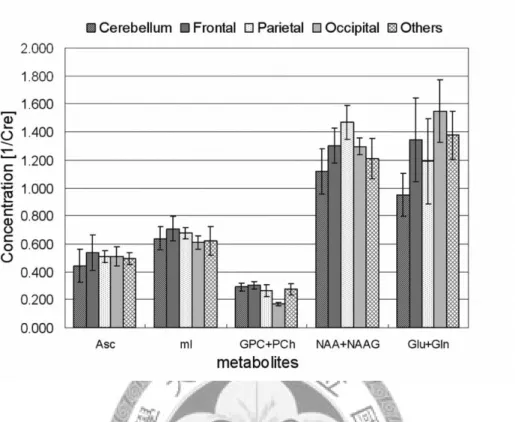
These datasets are excluded from further analysis since their CR-SD of the derived Asc concentrations are larger than 25%. Fig. 11 depicts the concentration ratios of five commonly evaluated metabolites including Asc within the five investigated regions.
Estimated concentrations of total NAA (NAA+NAAG) are located between 1.1 (1/Cre) and 1.4 (1/Cre), and the SDs range from 0.061 (1/Cre) to 0.143 (1/Cre). Hence, the relative SD, which is calculated as the SD divided by the corresponding estimated concentration, is about 12%. Similarly, the relative SDs of mI and choline (GPC+PCh) are about 13% and 15%, respectively. CR-SD values of total NAA, mI and choline range from 3% to 4%. In the five brain regions investigated, we found average values for vitamin C concentration ranged from 0.442 (1/Cre) to 0.535 (1/Cre).
Corresponding SDs were between 0.04 (1/Cre) and 0.13 (1/Cre), resulting in a relative SD of about 24%. This is twice the value that was found for NAA. The relative SD of
Glu+Gln with about 25% is similar to that of Asc. CR-SD values of these two metabolites are 7% and 11%, respectively.
Including Asc into the LCModel basis set may alter the estimated concentrations of other metabolites. Figure 12 displays this impact in relation to the evaluated Asc concentration after inclusion to the basis set. It shows the concentration differences of four different metabolites in all 71 datasets. From Figs 12(b) to 12(e) show the concentration differences of metabolites according to spectral data from different brain regions and the concentration differences of mI in four regions are obviously independent of the ascorbate concentration (p > 0.5). Besides, the analysis of choline shows resembling outcomes of the associated p-value larger than 0.05 in these four subfigures. From Fig. 12(a) the R2 of mI is equal to 0.005 of associated p-value larger than 0.5, and the R2 of GPC+PCh is 0.052 with p-value larger than 0.05. The results from individual regions and all subjects are consistent to confirm that no change is detectable as a function of Asc concentration for these two metabolites plotted. The statistic result of Glu+Gln in cerebellum is of p-value less than 0.3, and from other three regions their p-values are less than 0.1. Comparing to the results from Fig. 12(a), the concentration differences of Glu+Gln ranging from 0.067 (1/Cre) to 0.416 (1/Cre) shows an increasing trend with higher ascorbate concentrations (R2 = 0.189, p <
0.001). Although the NAA concentration tends to go down slightly from -0.006 (1/Cre) to -0.248 (1/Cre) as a whole and the NAA concentration difference shows dependency on Asc concentration in fontal lobe (p < 0.01), the analysis results from 71 cases does not show such a phenomenon (R2 = 0.019, p > 0.2). Figures 12(b) and 12(e) display results from parietal and occipital lobe, respectively. Their concentration distributions of ascorbic acid, ranging from 0.4 (1/Cre) to 0.6 (1/Cre), are much narrower compared with data from all cases, as shown in Fig. 12(a).
It is observed that CR-SD values of Asc and Glx are larger than that of other metabolites. Therefore, we focused on those two metabolites to plot the relation between their CR-SD values and the corresponding Asc concentration in Fig. 13. It depicts the trend that the CR-SD values decrease with a higher Asc concentration. The CR-SD values are above 20% for low Asc concentrations of about 0.25 (1/Cre) and decrease to 7% for Asc concentrations above 0.8 (1/Cre). The CR-SD changes of Glx do not express an obvious dependency on Asc concentration. There is a clear difference, however, between Glx CR-SD values from analysis “with” and “without”
Asc in the basis dataset. The latter are in most cases smaller.
Figure 11. The estimated relative concentrations of five metabolites, Asc, mI, choline (GPC+PCh), total NAA (NAA+NAAG), and the sum of Glu and Gln (Glu+Gln) in five different brain regions are depicted. The error bars show the SD of the relative concentration of each metabolite in different regions. The metabolites with larger concentration display a larger SD. Total NAA and Glu+Gln are examples of this. The relative SD of Glu+Gln (about 25%) is higher than that of total NAA (about 15%).
Concentrations of Asc and mI are at a similar level, and their relative SDs are also about 25% and 15%, respectively. The concentration of choline is the lowest among these metabolites, and its relative SD is similar to total NAA and mI.
Figure 12. This figure depicts the relation between the concentration differences that were analyzed in LCModel “without” and “with” Asc basis versus the concentration of Asc (x-coordinate) for four metabolites. The concentration differences of four metabolites vs. the concentrations of vitamin C calculated from all cases are shown in (a). With the increase of Asc concentration, concentration differences between
“without” and “with” Asc analysis of Glu+Gln also increase. GPC+PCh and mI are almost independent of the concentration change of Asc. Subfigure (b) and (e) show
concentration ranges from 0.4 (1/Cre) to 0.6 (1/Cre), which is a better-defined concentration compared with (a). Analysis results of cerebellum and frontal lobe are shown in (c) and (d), respectively.
Figure 13. The relation between the estimated Asc concentration and its CR-SD is shown. The corresponding CR-SD of Glu+Gln (Glx) “with” and “without” included Asc basis during analysis of each dataset is also given. Most CR-SD values of vitamin C range between 5% and 15%. Two obvious exceptions occur at low Asc concentration. Note the change of CR-SD values in Glx between “with” and
“without” Asc basis analysis. It can be observed that in almost every case the CR-SD value with Asc analysis is larger than that without Asc analysis. This implies an increase in estimation uncertainty after addition of Asc to the basis dataset of the LCModel analysis.
3.3.2 Virtual Titration
Table 3 shows the quantification results from in vitro simulated spectra, and all values of concentrations are also represented in creatine ratio. The quantification results of each metabolite with CR-SD larger than 20% were excluded. Table 3(a) is the analysis results from the spectrum only with four metabolites, which are not under the risks of overlapping resonance peaks to each other. All existing metabolites of the spectrum are precisely quantified with CR-SD 0%. However, Gln and Tau do not exist in the in
vitro spectrum we simulated, it shows tiny amount in the quantification results. The
analysis results show in Table 3(b) are similar to those in Table 3(a). The metabolites existing in the simulated spectra can be successfully detected and precisely quantified.
Their CR-SD values are all 0%. The estimated concentrations of other metabolites are all below 10-5, which is considered as noise even though the CR-SD values still conforming the criterion of 20%. Figure 14 shows the relation between the estimated ascorbate concentration (in creatine ratio) and the real added Asc amounts (in mM) in simulated in vitro spectra with R2 = 1, and the CR-SD values of Asc are all 0%.
Besides, the estimated concentrations and CR-SD values of all other existing metabolites listed on Table 3 are not affected after adding ascorbate into spectra.

![Table 1. Ranges of some steadily MR-detectable metabolite concentrations reported for normal adult human brains and biopsy tissues [70]](https://thumb-ap.123doks.com/thumbv2/9libinfo/9607585.633285/41.892.128.766.388.1089/table-ranges-steadily-detectable-metabolite-concentrations-reported-tissues.webp)