利用產品生命週期分析連結國家間發展策略:以未來汽車產業的資源管理為例
97
0
0
全文
(2) . .
(3) . Abstract Electric and hybrid vehicle industry is one of those strategically promoted in Taiwan expected to provide domestic and international markets with parts and final products contributing to Taiwanese economy in the next decades. Such strategy must be in concert with strategies on the resource mining countries, assuring economic and environmental sustainability among the nations involved. In this study, Taiwan’s lithium (Li) and nickel (Ni) demands until 2060 are estimated in accordance to the promotion plans of the introduction of electric vehicles in the country. This new vehicle industry would utilize these critical metal resources as key components of the batteries. When these metals exit from the market as reusable resource, it is aimed to create a metal recycling industry in Taiwan. Given the recycling participation of the disposed batteries and the efficiency to recover nickel and lithium, the ultimate potential in recycled metal supply and the mined metals to supplement the shortage to the metal demand can be estimated. These information together with the associated GHG emission are the key inputs to the concerted roadmaps of technological and resource management strategies of Taiwan and the mining countries – Bolivia and the Philippines – that is proposed in this study. With the increasing number of EVs, although this development plan is coupled with the improvement in battery technology in terms of decreasing the metal intensity, the projection still shows an increasing to slowly saturating metal demands. Because of this, disposed metal stocks accumulation in Taiwan has also increasing trend, making them capable of becoming self-sufficient in supplying its own demand by recycling these disposed metal stocks. This, however, induces more GHG emission from Taiwan and limits the supply share of mining countries. This may sound beneficial in terms of minimizing GHG emission in mining countries; however, it poses challenges in economic aspects of sustainability. If the mining countries cannot achieve economic sustainability, the product life cycle cannot be. i .
(4) . sustainable. Hence, it is suggested that while the demand from the mining countries is still not suppressed by Taiwan’s recycling industry, they can establish other industry such as downstream processing and refining to increase the economic value of their resource. The demonstrated example of concerting development strategies of the three stakeholders may not be, however, realistic enough. In reality, these countries interact to more countries and not only linked by one technology or product. Thus, it is recommended for future studies to add more stakeholders and more products to link them to make the model more dynamic and more realistic.. Keywords: electric vehicles, materials for batteries, resource management, promotion strategy of an industry, Greenhouse gas emission. ii .
(5) . 中文摘要 電動車和油電混合車在台灣是策略性的推廣產業之一,並且期待在未來 的數十年間能夠提供國內、外市場零件及最終產品的市場,並促進台灣經濟。 此種策略必須與資源開採國家的目標一致,以確保參與國家間的經濟及環境 的永續發展。 在本研究中,台灣在 2060 年鋰(Li)和鎳(Ni)的需求量,已根據國 內引進電動汽車到國內的推廣計劃推估求得。這種新型的汽車產業會利用這 些重要的金屬資源做為電池的主要成分,並計劃在金屬退出市場成為可回收 資源時,創造一個台灣的金屬回收產業。 藉由廢棄電池回收的參與以及鋰和鎳的回收效率,可求得為補足金屬需 求量之回收以及採礦的分配情況。本研究中,將結合上述資訊與溫室氣體排 放相關之訊息,提供台灣以及開採國家(保加利亞、菲律賓)建立技術與資 源管理一致性的發展策略。 隨著電動車量的增加,即使電動車發展計畫可改進電池上金屬強度的降 低,金屬需求仍顯示緩慢成長至飽和的趨勢。有鑑於此以及廢金屬回收庫存 量的上升趨勢,台灣在利用回收廢棄金屬於供應面的自給自足能力也提升了。 然而該項策略,會使台灣產生更多的溫室氣體排放以及限制開採國家的供應 量。這似乎有益於開採國家溫室氣體排放減量,但是於經濟方面卻無法達到 永續經營。因此,為避免開採國家金屬產業受到台灣金屬回收產業建立的衝 擊,建議這些國家可在下游加工和精煉產業鏈中,增加資源的經濟價值。 只利用三個國家為例的發展策略探討,也許還不夠貼近於現實情況。在 實際情況之下,這些國家會與更多國家有所互動,也不僅是單一技術與產品 的連結。因此,建議未來的研究可以考量多國或是多項產品間面向,建立一 個動態並貼近真實情況的模式。. 關鍵字: 電動車、電池材料、資源管理、企業發展策略、溫室氣體排放. iii .
(6) . Acknowledgement Allow me to thank the following that make up each and every word of this research work. ESEL. To my Adviser, Yasuhiro Fukushima, please accept my gratitude for being a great mentor. I thank you for being not a lenient advisor to us in accomplishing every task, for pushing us to do our best and for always reminding us to be critical and think out of the box. To my co-M2’s (Lucy, Wendy, and Esther), we made it! I am thankful to have shared with you both the difficulties in doing things and the encouragement we have for each one. To my juniors (Teah, Fitria, Jen, Stefan), thank you for all the support you have given me in times of difficulties; for sharing your thoughts/opinions whenever I ask, for doing translations, for teaching me directions to go to places in Taiwan, and for laughing whenever I crack a random joke. To my seniors and RA’s (Ribka, Peter, YeeShee, Tina, Mori, Rita, Tammy, Sean), thank you for the encouragements. You have been such great example to us. I appreciate all the support that you had for us during the critical times in our first year in ESEL.. Filipino friends in Tainan. Thank you for helping me survive Taiwan. Life here in Taiwan would have been less homey without your presence around. Cheers to more years of friendship!. Local and foreigner friends in Taiwan. Thank you for making my life in Taiwan as diversified as it is now. Thank you for sharing your culture, your way of thinking, and outlook in life. Because of these, I learned to see things in different perspective now.. iv .
(7) . Defense Committee members. To Professor Li-Hsing Shih and Dr. Fujii, I am grateful to have learned from your inputs and suggestions for my thesis.. Family and friends. I thank you for allowing me to choose to be away from you for two years. Being away from you taught me to become more independent. And the distance we have now makes me realize that you are still the ones who build me up as a person. I shall see you soon!. Random people I met in bus/train stations, streets, and shops Thank you for sharing your small talk about life, for the random smiles and frowns.. And last but definitely the best to whom I extend my greatest gratitude, my God. Going to Taiwan may not be the best decision I have made, but I know for sure that you have guided me to the right places, people, and ideas. I owe you these two years. I promise to pay it forward.. To God be the Glory!. v .
(8) . Table of Contents Abstract ........................................................................................................................ i 中文摘要 ....................................................................................................................iii Acknowledgement ..................................................................................................... iv Table of Contents ....................................................................................................... vi Figure Index ............................................................................................................... ix Table Index ................................................................................................................ xi Chapter 1 Introduction ................................................................................................ 1 1.1 Preface ............................................................................................................... 1 1.1.1 Motivation ................................................................................................... 1 1.1.2 The stakeholders, their Strategies, and the Linkage.................................... 1 1.1.3 The Domino Effect ...................................................................................... 4 1.2 Scope and Overall Limitations of the Study...................................................... 6 1.3 Highlights and Objectives of the Study ............................................................. 7 Chapter 2 Literature Review ....................................................................................... 9 2.1 Different Type of Electric Vehicles (EV) ......................................................... 9 2.1.1 Hybrid Electric Vehicles (HEV) ................................................................. 9 2.1.2 Plug-in Hybrid Electric Vehicles (PHEV) .................................................. 9 2.1.3 Battery Electric Vehicle (BEV) ................................................................ 10 2.2 Different Battery Technologies for EVs.......................................................... 10 2.2.1 Nickel Metal Hydride (NiMH).................................................................. 11 2.2.2 Lithium-ion................................................................................................ 11 2.2.3 Metal Intensity and Energy Capacity ........................................................ 12 2.3 Taiwan Electric Vehicle (EV) Industry Promotion Goals ............................... 14. vi .
(9) . 2.4 Philippine Nickel Mining Industry Status ....................................................... 15 2.5 Bolivia Lithium Mining Industry Status.......................................................... 15 2.6 Number of Cars Estimation Methods .............................................................. 16 2.6.1 Vehicle Ownership Function..................................................................... 17 2.6.2 Weibull Distribution Function .................................................................. 17 2.7 Life Cycle Considerations and GHG Emission Inventories ............................ 19 2.7.1 GHG Emission of Nickel Mining ............................................................. 19 2.7.2 GHG Emission of Li Mining..................................................................... 21 2.7.3 GHG Emission of Downstream Processing .............................................. 22 2.7.4 GHG Emission of Recycling ..................................................................... 22 2.8 Battery Recycling Participation Rate and Efficiency ...................................... 23 Chapter 3 Methodology ............................................................................................ 24 3.1 Overall Framework .......................................................................................... 24 3.2 Number of Car Estimation (in-use, disposed, new) ........................................ 26 3.3 Scenario Setting and Demand Estimation ....................................................... 28 3.3.1 Vehicle Promotion Target and EV Demand Estimation ........................... 28 3.3.2 Battery Technology Improvement and Total Metal Demand Calculation 29 3.4 Metal Supply Allocation .................................................................................. 31 3.5 Life Cycle Considerations and GHG Emission Calculation ........................... 34 3.6 Roadmap Development ................................................................................... 37 Chapter 4 Results and Discussion ............................................................................. 39 4.1 Number of Cars Projection and Breakdown .................................................... 39 4.2 Total Metal Demand ........................................................................................ 41 4.3 Improvement on Battery’s Metal Intensity, Ii, ................................................. 42 4.4 Improvement on Recycling System and Technology ...................................... 42. vii .
(10) . 4.5 Metal Supply Allocation .................................................................................. 44 4.6 Environmental Impact Assessment ................................................................. 47 4.6.1 GHG Emission from Mining, Refining, and Recycling Ni....................... 49 4.6.2 GHG Emission from Mining and Recycling Li ........................................ 50 4.7 Proposed Roadmap and Concerted Strategies of Stakeholders ....................... 51 4.7.1 Taiwan’s EV and Recycling Industry concerted with Metal Resource Management of Bolivia and the Philippines ...................................................... 51 4.7.2 Improvement on Battery Technology in Taiwan ...................................... 52 4.7.3 The Philippines Downstream Industry ...................................................... 52 Chapter 5 Other Scenario .......................................................................................... 55 5.1 Government Plan vs. Ten-year Delay ............................................................. 55 5.1.1 Number of Cars and Breakdown Comparison .......................................... 57 5.1.2 Metal Demand Comparison ...................................................................... 58 5.1.3 Metal Supply Allocation Comparison....................................................... 59 5.1.4 GHG Emission Comparison ...................................................................... 60 Chapter 6 Conclusions and Recommendations......................................................... 62 References ................................................................................................................. 66 Appendix ................................................................................................................... 70 A. Comparison of Simulated and Actual Number of in-use Cars ......................... 70 B. Number of Discarded Cars and Lifetime Distribution...................................... 74 C. Simulation of Number of New Cars ................................................................. 75 D. Simulation of Metal Demand and Disposed ..................................................... 78 E. Simulation of Metal Supply Allocation ............................................................ 80 F. Simulation of GHG Emission............................................................................ 82 G. Ten-year Delay Scenario Roadmap .................................................................. 84. viii .
(11) . Figure Index Figure 1 Taiwan Government Roadmap for EV Sales .............................................. 2 Figure 2 Interrelated Effects of Technological Development and Resource Management of the Three Stakeholders (Taiwan, Philippines, Bolivia) .................... 5 Figure 3 Illustration of the Highlights and Objectives of the Study ........................... 8 Figure 4 Different Types of Electric Vehicles (EV) ................................................. 10 Figure 5 Illustration of Weibull Distribution ............................................................ 18 Figure 6 Nickel ore grade decline ............................................................................. 20 Figure 7 Relationship of GHG emission and Ni ore grade ....................................... 21 Figure 8 Overall Framework of the Study ................................................................ 25 Figure 9 Two Scenarios Designed in the Study ........................................................ 29 Figure 10 Material Flow of Metal ............................................................................. 33 Figure 11 GHG Emission of Ni Mining in the Philippines at certain ore grade ...... 35 Figure 12 GHG Emission of Recycling Ni and Li contained in EV batteries .......... 36 Figure 13 Information Overview of the Roadmap.................................................... 38 Figure 14 Number and Breakdown of In-used Cars in Taiwan ................................ 39 Figure 15 Number and breakdown of new demand cars .......................................... 40 Figure 16 Total Metal Demand ................................................................................. 41 Figure 17 Metal intensities over time ....................................................................... 43 Figure 18 Improvement on recycling participation and efficiency........................... 43 Figure 19 Metal demand allocation .......................................................................... 45 Figure 20 Taiwan share of metal supply ................................................................... 46 Figure 21 GHG emission generated by stakeholders................................................ 48 Figure 22 GHG emission from mining, refining, and recycling Ni .......................... 49 Figure 23 GHG emission from mining and recycling Li .......................................... 50 Figure 24 Roadmap Key Inputs and their Relationship ............................................ 53 Figure 25 Proposed Concerted Roadmap for the Stakeholders ................................ 54 Figure 26 Comparison of number of cars estimation from two scenarios ................ 57. ix .
(12) . Figure 27 Comparison of metal demand calculation from two scenarios ................ 58 Figure 28 Comparison of metal supply allocation from two scenarios .................... 59 Figure 29 Comparison of GHG emission from two scenarios.................................. 60 Figure 30 Overall Picture of the Model and Recommendations .............................. 65 Figure 31 Comparison of Simulated and Actual Number of In-use cars ................. 73 Figure 32 Number of Discarded Cars and Lifetime Distribution ............................. 74. x .
(13) . Table Index Table 1 Different Types of Li-ion Batteries according to cathode used ................... 12 Table 2 Energy Capacity of EVs and their Metal Intensity ...................................... 13 Table 3 BEV Target Sales of Taiwan Government .................................................. 14 Table 4 GHG Emission Factor Comparison of Li Mining from Two Different Sites ................................................................................................................................... 22 Table 5 Metal Intensity Values based on Two Scenarios, kg/kWh .......................... 30 Table 6 Metal Content of EV Batteries based on Two Scenarios, kg ...................... 30 Table 7 GHG Emission Summary of three Industries .............................................. 34 Table 8 Comparison of Government Plan and Ten-year Delay scenarios ................ 55 Table 9 Simulation of number of in-use cars ............................................................ 71 Table 10 Number of HEV ......................................................................................... 75 Table 11 Number of PHEV....................................................................................... 76 Table 12 Number of BEV ......................................................................................... 77 Table 13 Ni Demand and Disposed .......................................................................... 78 Table 14 Li demand and disposed ............................................................................ 79 Table 15 Li Supply Allocation .................................................................................. 80 Table 16 Ni Supply Allocation ................................................................................. 81 Table 17 GHG emission from Li recycling and mining ........................................... 82 Table 18 GHG emission from Ni recycling, mining, and refining ........................... 83. xi .
(14) . Chapter 1 Introduction 1.1 Preface This section tackles about the motivation in doing the research, the background of the study, and the statement of the problem. 1.1.1 Motivation It is a known fact that a certain country, in one way or another, depends on other countries. For instance, when a certain product is being developed in one nation, this nation may have to take resources from another country to be able to create such product. The development and utilization of a product or promotion of a technology affect not only the economic and environmental situation of the host country, but also the countries where the resources are taken to create such technology or product are affected as well. To achieve sustainability among the nations involved, there is a need for these countries to cooperate with each other, hence concerted development strategies should be created. This study aims to create a model that will demonstrate that concerting development strategies and sustainability, taking the promotion of future vehicle industries as an example.. 1.1.2 The stakeholders, their Strategies, and the Linkage In this study, only three countries are involved to represent the respective types of stakeholders: Taiwan representing user of the metals and its products, the Philippines representing mining country for the conventional material, and Bolivia representing the mining country for the innovative material. How these three countries are interconnected with each other are elaborated on in this subsection. In Taiwan, being a country dependent on imported petroleum, Electric Vehicle (EV) industry is one of those strategically promoted by the government– expected to provide domestic and international markets with parts and modules contributing to Taiwanese economy in the next decades [1]. In fact, the government is planning to increase the domestic sales of Battery Electric Vehicle (BEV) from. . 1 .
(15) . 1000 units in 2010 to 200,000 units by 2030 [2]. The promotion target can be seen on Figure 1 which contains the projected sales of different type of EVs (described in Section 2.1) that the government has been planning to employ until 2030.. . 2010. 2015. 2020. 2030. Total EV Domestic Sales: 990 units. Total EV Domestic Sales: 215,000 units. Total EV Domestic Sales: 365,000 units. HEV: 640. HEV: 100,000. HEV: 134,000. PHEV: 100. PHEV: 15,000. PHEV: 31,000. BEV: 250. BEV: 100,000. BEV: 200, 000. Figure 1 Taiwan Government Roadmap for Electric Vehicle (EV) Sales Note: Hybrid Electric Vehicle and Plug-in Hybrid Electric Vehicle (PHEV) Sales are projected by this study. Using the EVs, the dependency on liquid fuels derived from petroleum could be reduced. However, the dependency is shifted to another important resource. Taiwan will rely on metal industry, creating a demand on the critical metals required to manufacture the battery and motors, key components of EVs. Taking examples from batteries, these Nickel (Ni) and Lithium (Li) are the critical metals. Being a matured battery technology, Nickel Metal Hydride (NiMH) [3], has been the dominating battery type that is utilized by EV industry at present time [4, 5].. . 2 .
(16) . However a shift to Li-ion battery is foreseen [6] as this type promises a higher efficiency (i.e., smaller energy loss at charge and discharge) and higher energy density (i.e., lighter batery) [3]. This is where the linkage of Taiwan to other two stakeholders comes in – the Philippine being the world largest Ni mine producer in 2012 [7] and Bolivia which has the world’s most abundant Li reserves [8], will supply the Ni and Li demands of Taiwan, respectively. However, as far as managing their metal resource is concerned, these two mining countries have their own development strategies that may not be concerted with Taiwan’s. The Philippines has now been investing in explorations of more Ni mining sites in prepration for the increasing demand for the metal [9]. This and its strategic location, being a neigbour to Taiwan to supply Ni may sound advantageuous for the latter, the Philippines should also consider the environmental impact that could be created when aggressive mining is being practiced. On the contrary, the plan of establishing more downstream processing [10] or refining industry for Ni apart from the only one plant exisiting in the Philippines, which will enable them to sell the metal resource in higher economic value, may seem unfavorable for Taiwan as it could mean an industry loss for them. On the other hand, there have been several studies on the sufficiency of Li supply should the use of EVs start to boom in the next decades. Among the studies, Bolivia emerges to be the most potential Li resource [8]. However, the country has not been mass producing Li yet and several issues on policies, technologies, society, and environment are yet to be addressed [11]. Thus, there will be a threat to the security of continuous lithium supply if Bolivian government will not open its door from industries who are consumers of the metal such as EV and battery. These mining countries from which Ni and Li will be taken out should have a resource strategy that must be in concert with Taiwan’s EV promotion and battery technology improvement to assure economic and environmental sustainability among them.. . 3 .
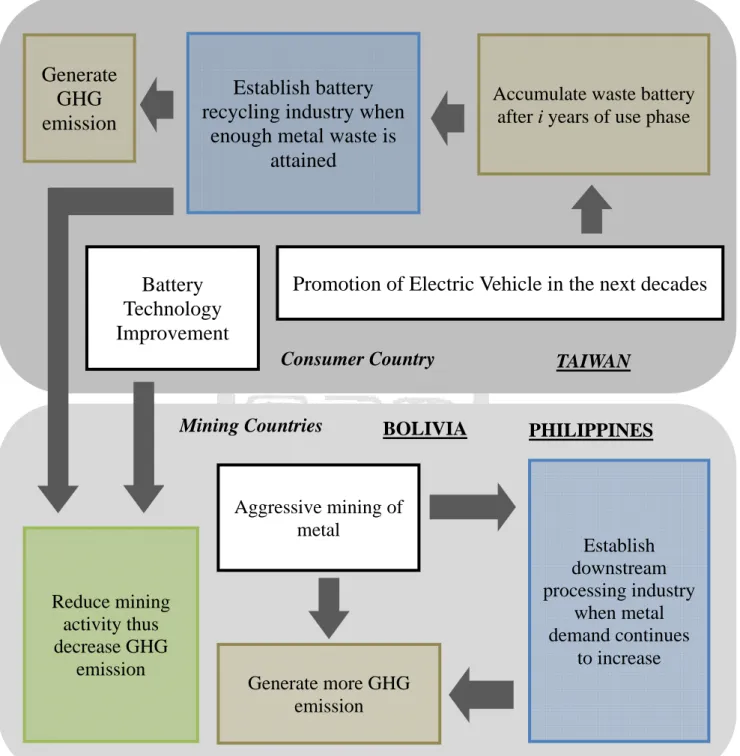
(17) . 1.1.3 The Domino Effect Shown in Fig. 2 is the domino effect of Taiwan EV promotion among the three countries. Implementing those strategies comes both a problem and an opportunity for the three stakeholders. Although the promotion of EVs may impose a more aggressive mining in the Philippines and Bolivia, which would generate more GHG emission, there will be an opportunity for them to establish a downstream or refining industry that could make their metal resource of higher selling value. Creating such industry would, however, result to an additional GHG emission to them. As for Taiwan’s case, waste battery will accumulate in the future which makes them capable of building a recycling industry. Despite generating more GHG emission to them, they would not have to depend on mining countries; thus posing less mining activity and decrease emission for mining countries. The improvement on battery technology – that is the increase in energy efficiency in vehicle, requiring less amount of metal at the same energy capacity – would also reduce mining activity and emission on mining countries’ end.. . 4 .
(18) . Generate GHG emission. Establish battery recycling industry when enough metal waste is attained. Battery Technology Improvement. Promotion of Electric Vehicle in the next decades. Consumer Country. Mining Countries. BOLIVIA. Aggressive mining of metal. Reduce mining activity thus decrease GHG emission. Accumulate waste battery after i years of use phase. TAIWAN. PHILIPPINES. Establish downstream processing industry when metal demand continues to increase. Generate more GHG emission. Figure 2 Interrelated Effects of Technological Development and Resource Management of the Three Stakeholders (Taiwan, Philippines, Bolivia). . 5 .
(19) . 1.2 Scope and Overall Limitations of the Study This study is based on several strong assumptions to allow discussions to highlight the importance of consideration of linkages among the roadmaps. In this section, the key assumptions are described. To implement the considerations in the real policy context, these assumptions must be reconsidered in the future studies. As previously pointed out, there are only three countries – Taiwan, the Philippines, and Bolivia – involved in this study. In other words, it is assumed that Taiwan is the only consumer country, and the other two nations will be the resource country. This means that the flow of the metal resource (Ni and Li) of interest will be demonstrated only among these three nations. Furthermore, only domestic demand of EVs in Taiwan is considered. The number of EVs that will be estimated in the study will not consider the export sales. This assumption brings in unrealistic figures. Namely, the saturation of EVs accumulated in Taiwan will be overestimated, as the roadmap of Taiwanese EV promotion evaluated in this study includes expected exports. Aside from these, another limitation of the study is that the model only considers the battery of EVs as the sole product with which Ni and Li are utilized. Other products, such as stainless steel, glass, ceramic, among others, that make use of Ni and Li are not included in the scope of the model. In reality, the choice between the recycled and mined metals will be made based on various considerations and constraints, including its economy. However, in this study, it is assumed that recycled metals always have the priority in meeting the demand. In other words, the economic competitiveness of the recycling processes is always assumed higher than the mined metals. In summary, the scope and overall limitations of the study are as follows: Metal flow is only demonstrated within the three stakeholders Taiwan is the only consumer; the other two countries (the Philippines and Bolivia) are resource countries Only domestic demand of EV in Taiwan is considered. . 6 .
(20) . Only EV/battery is considered as the product that consume the metals of interest Recycled metal supply is the priority over mined metal. 1.3 Highlights and Objectives of the Study Despite the limitations, the study aims to highlight few key points that could serve as important information to the three stakeholders involved as far as establishing their development strategies. These include the following: How the technological developments (EV introduction, battery improvement, metal recycling establishment) could influence the development strategies (mine production, downstream processing establishment) of mining countries. Considering that the Philippines and Bolivia would only supply their resource to Taiwan. The model could give these mining countries information of the extent of metal resource they need to mine and supply and until when they can do it. Given a lifetime distribution of EVs and batteries, Taiwan could be able to know how much stocks of the disposed metal they could generate and when they can start the recycling industry. The GHG emission associated with the emerging industries. These highlights could be demonstrated by achieving the objective – that is roadmap development of the concerted strategies of stakeholders that focus on: Resource management: o Mined metal of mining countries o Disposed metal stocks in Taiwan Establishment of new industries o Downstream processing or refining in mining countries o Recycling in Taiwan. . 7 .
(21) . Figuree 3 Illustrattion of the Highlightss and Objecctives of thhe Study. . 8 .
(22) . Chapter 2 Literature Review 2.1 Different Type of Electric Vehicles (EV) Electric vehicle (EV) is the collective term, and could be categorized into several types that use electricity in different ways and in combination of other technologies [12], i.e. the use of internal combustion engine together with electric motor for propulsion. This new generation of vehicles, fall into three categories [13] Hybrid Electric Vehicles (HEV), Plug-in Hybrid Electric Vehicles (PHEV), and Battery Electric Vehicles (BEV). The difference among the three is how they use electricity, and how much of it, as their primary fuel or to improve the efficiency of conventional vehicle design [14]. The succeeding paragraphs define the three types and the illustration on how they are different is shown in Figure 4.. 2.1.1 Hybrid Electric Vehicles (HEV) These types of vehicles are powered on two systems – by an internal combustion engine that uses alternative or conventional fuel as well as by electrical energy stored in a battery. The battery is charged through regenerative braking and internal combustion engine. They capture energy that is usually lost during braking through the electric motor as a generator, then storing it in the battery. [13, 14]. 2.1.2 Plug-in Hybrid Electric Vehicles (PHEV) These types of cars also run by the combination of combustion engine and by battery like HEVs. However, PHEVs have larger battery packs compared to the latter, which make it possible to run using only electric power, but within a certain range (e.g. 20 to 40 kilometres). When the battery is drained, they operate like a normal HEV. Batteries can also be charged into an electric power source, besides regenerative braking and internal combustion engine. Comparing with HEVs, they usually cost more, and more dependent on infrastructures such as recharging stations and power grids. [13, 14]. . 9 .
(23) . 2.1.3 Battery B Eleectric Vehiicle (BEV)) T These are also calledd all-electrric vehiclees because they are rrun only on o an electricc motor powered by energy e from battery. BEVs aree charged bby pluggin ng the vehiclee into an electric e pow wer sourcee. It has th he largest battery paacks among g the three tyypes, and obviously o thhe most coostly due to o this fact. [13]. Figure 4 Different D T Types of Ellectric Vehhicles (EV)). 2.2 Diifferent Battery B Technollogies for EVs T There are several typpes of batteeries that can c be used to run ellectric vehicles. Initiallyy, HEVs used lead acid battteries but with the recent addvancemen nts in technollogy, NiMH and Li-ion batteriies are bein ng used prredominanntly [15]; and a it was repported [16]] that the demand d forr battery materials m wiill be driveen by the sttrong growth in the prroduction of Li-ion and nickeel metal hyydride (NiiMH) batteeries. Hence, in this study, only Li-ion and NiMH N are considered c d and discussed.. . 10 .
(24) . 2.2.1 Nickel Metal Hydride (NiMH) This type is already considered a matured technology – offering a reasonable specific energy and specific power capabilities, NiMH has been routinely used in computer and medical equipment; and nowadays, these batteries have been used widely in HEVs [17]. The following features have made NiMH an established battery among the automotive companies: flexible sizes, safe operation at high voltage, flexible vehicle packaging, safety in charge and discharge, has excellent thermal properties, among others. [18] There are few of NiMH, depending on the type of metal alloy (metal hydride) it uses on its anode [19]. The most commonly used alloy group for NiMH battery applications is the AB5 anode. So, this is the type being considered in this study. 2.2.2 Lithium-ion Li-ion batteries are currently used in most portable consumer electronic products because of they have relatively higher energy per unit mass compared to other energy storage system. Other advantages of Li-ion over NiMH and other energy storage systems include higher energy efficiency and long cycle life (the number of charging and discharging cycles in battery’s entire life). While both the HEV and PHEV goals in terms of specific energy and power are either already reached or are close to being accomplished by Li-ion batteries, the goals for BEVs are far beyond today’s technology [20]. There are six types of Li-ion batteries existing in the industry. The classification depends on the cathodic and anodic materials used. Among them, four are being used for vehicle battery, listed in Table 1 [20-22]. These four are classified based on the chemistry of the cathode they use (with graphite as the anode).. . 11 .
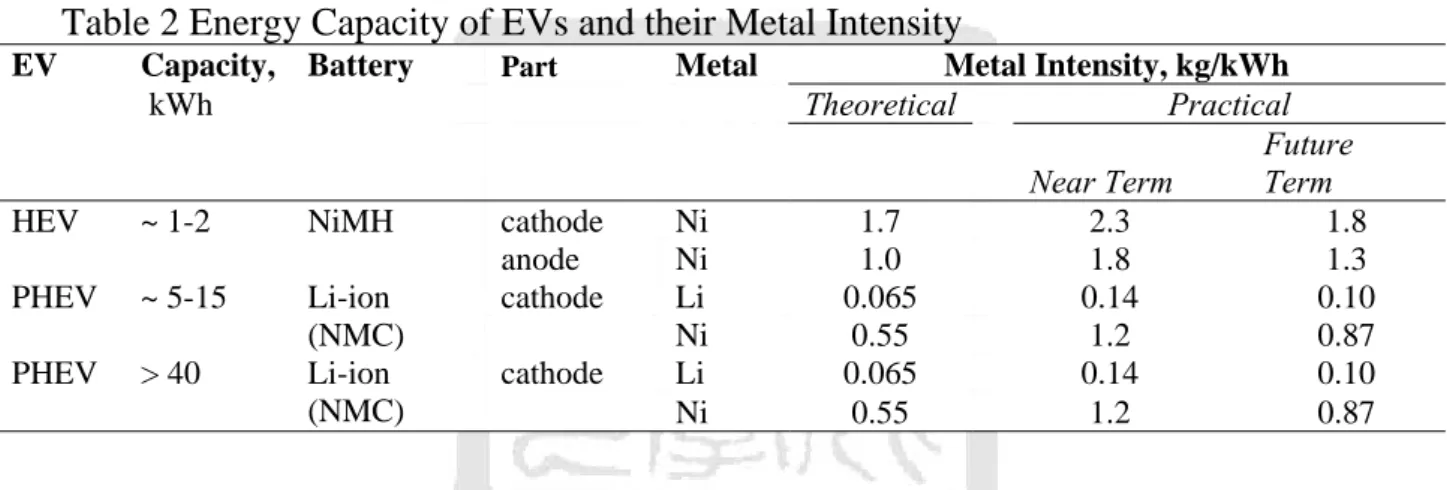
(25) . Table 1 Different Types of Li-ion Batteries according to cathode used Type. Material. Notes. Lithium Manganese. LiMn2O4. Most commonly used in automobile, low. Oxide (LMO). cost, acceptable rate capability, poor cycle and calendar life. Lithium Iron. LiFePO4. Phosphate (LFP). Low cost, improved abuse tolerance, good cycle life and power capability, low capacity and calendar life. Lithium Nickel. LiNiMnCoO2. Manganese Cobalt. Lowest cost, high capacity, life is less than NCA. Oxide (NMC) Lithium Nickel. LiNiCoAlO2. Cobalt Aluminum. Highest capacity, low cost, but with safety concerns. (NCA). And because cost is one of the biggest bottle-neck in the development of Liion battery technology [21], it would be rationale to employ the type with the lowest cost. From this reason, Lithium Nickel Cobalt Aluminum (NMC) is considered in this study.. 2.2.3 Metal Intensity and Energy Capacity The model we are building would help the stakeholders to create a strategy on managing their resource. And as aforementioned, the metal resources sought in this study are Li and Ni. Therefore, it is important to know the metal intensity of the chosen battery pack to demonstrate the model. Rade et. al. estimated [23] some critical metals contained in several electric vehicle industries. The study calculated the metal intensity (Ii), expressed in terms of kg/kWh. This data along with the energy capacity (kWh) [24] of EVs are needed to estimate the total Li and Ni contained in one battery.. . 12 .
(26) . Currently, most HEVs rely on NiMH batteries [5]. However, as per automobile industry consensus that lithium-ion batteries will become the dominant technology for EVs [6]; conversely, PHEVs and BEVs are expected to dominate the market [25]; hence, in this model, it is assume that HEVs use solely NiMH; while PHEVs and BEVs use Li-ion. The values for Ni and Li for NMC and AB5-type NiMH, as well as the energy capacity of different EVs are summarized in Table 2. This is to give an overview of the near term, future-term, and theoretical values of metal content of the battery set and used by Rade at. al in their study. Also, to show that each EV type has different energy capacity, given in range.. Table 2 Energy Capacity of EVs and their Metal Intensity EV. Capacity, Battery kWh. Part. Metal. HEV. ~ 1-2. NiMH. PHEV. ~ 5-15. PHEV. > 40. Li-ion (NMC) Li-ion (NMC). cathode anode cathode. Ni Ni Li Ni Li Ni. cathode. Metal Intensity, kg/kWh Theoretical Practical Future Near Term Term 1.7 2.3 1.8 1.0 1.8 1.3 0.065 0.14 0.10 0.55 1.2 0.87 0.065 0.14 0.10 0.55 1.2 0.87. In this model, only the electrode part of the battery is considered. The Li-ion batteries chosen use graphite as the anode, making only cathode has Li content. Moreover, both anode and cathode of NiMH contain nickel, so both parts are accounted for. Rade et. al. set near term and future term values of metal intensity of different batteries for electric vehicles. They did not, however, specify a timeline as to when the future value will be attained. Since the study was done a decade ago, their near term goal was set to be the current values of metal intensity in this study. As to when the future term will be attained, scenarios are set. This part is discussed in Chapter 3.. . 13 .
(27) Note: From this point on, the terms Ni-based and Li-based batteries will be used to represent NiMH and Li-ion (NMC), respectively.. 2.3 Taiwan Electric Vehicle (EV) Industry Promotion Goals Taiwan government puts EV into National Development Plan as one of the target industries to be invested in the succeeding decades [1]. It is predicted that the market will grow from 1000 unit sales in 2010 to 154,000 units in 2020 [1]. According to the report done by Industrial Technology Research Institute (ITRI), between 2010-2020, HEV will account for the majority of Taiwan EV sales, followed by BEV, and PHEV will have the smallest share. The projection of number of EVs in this study would only consider the domestic sales. And this will be based on the promotional targets, reported by the Ministry of Economic Affairs (MOEA) [2], shown in Table 3.. Table 3 BEV Target Sales of Taiwan Government Year. BEV Domestic Sales Target, units. 2010-2011. 500. 2012. 1,000. 2013. 1,500. 2014. 7,000. 2015. 15,000. 2016. 45,000. 2030. 200,000. According to the report, the sales will continue to increase until it reaches the target of 200,000 unit sales in 2030. Assumptions, which are basically following these targets and the projection trends previously mentioned, are made to predict the demand for HEV and PHEV. This is will be discussed in Chapter 3.. . 14 .
(28) . 2.4 Philippine Nickel Mining Industry Status In 2012, US Geological Survey (USGS) reported [7] that the Philippines is biggest producer of Ni mines in the world. The probable cause could be the “nickel rush” in the country. This phenomenon is described as follows: spike of the metals’ price, accompanied by the rush in explorations of alloying metals, plans of establishing downstream processing, more explorations for detailed delineation of the metal resources, and among others [9]. The government had made amendments on the Mining Act of the country and published an Executive Order pertaining to the latter [26]. Among the changes and orders, one topic is of importance and relevant to this study. This is the ValueAdding Activities and the Development of Downstream Industries for the Mineral Sector. As there could be a plan already on when and how this will be done, this study would further serve as a tool to propose a strategy on this. This will be discussed in Chapter 3. Furthermore, it is not stated on the amendments and orders on how the mining industry would manage the GHG emission generated through the lifetime operation of the sector. This is particularly important because studies done by Nortgate et. al. [27] show that as the ore mine quality deteriorates through the mine site operating lifetime, the GHG emission is exponentially increasing. Therefore, this model would calculate the emission from mining operations, as well as from the downstream processing when it is already establish.. 2.5 Bolivia Lithium Mining Industry Status According to the estimates done by Gruber et. al., Bolivia possesses the most abundant reserve of Li from brine in the world [8]. For that matter, the country is believed to become a big player in the global economy when the prediction of hundred-billion dollar sales of EVs run on Li battery materializes in the next decades [11]. The Bolivian government has already invested in setting up a pilot. . 15 .
(29) . plant to test drive the feasibility of the technology to extracting the Li in the Salar Uyuni, the lake of brine located in Bolivia [11]. Despite this initial step done by the government, there are major challenges that the country would face in their pursuit of becoming a global player in lithium production. One of these, which is inevitable to happen, would be the environmental impact. The geographical location of Salar Uyuni may not be considered as an attractive resource compared to other lithium source salars. The central epicentre of the site where the highest concentration of lithium is found is shallow and spread out – which could mean that much greater surface area is needed to be exploited [28]. That could be more environmentally damaging. Stamp et. al. made a comparative life cycle assessment of Salar Uyuni and Salar de Actama of Chile [29]. Their results showed that production of lithium in Salar Uyuni, having a less concentrated than Salar de Actama, would give a higher GHG emission per kg of lithium extracted. The details of their study would be presented in Section 2.7. Thus, it is important to quantify the GHG emission when amounts of lithium are mined in Bolivia in the next decades. It is aimed that the figures will be of help to the Bolivian government in forming a strategy on managing their lithium reserves. In addition, the Bolivian government plans to produce high purity lithium from brine, which means further establishment of downstream processing is not needed. So, for that matter, instead of recommending such industry, the study will suggest a roadmap on when to shift from pilot test to a higher scale operation.. 2.6 Number of Cars Estimation Methods There are several ways in estimating the number of cars, or any commodity for that matter, using historical data and create a mathematical model to project the future. There are number of established functions that have been used in several studies – for example, the logistic, logarithmic logistic, cumulative normal, and Gompertz function. These functions would create an S-shaped curve, implying that. . 16 .
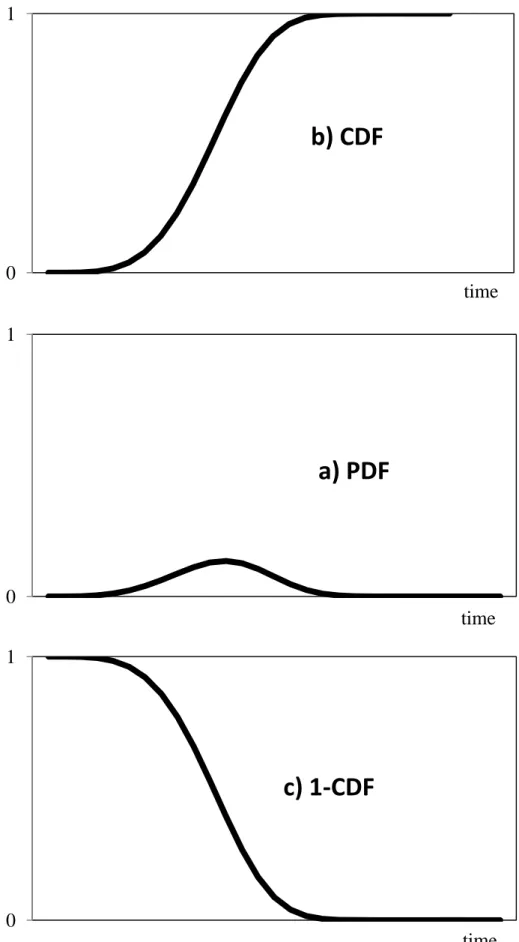
(30) . the vehicle ownership increase slowly with a certain parameter (e.g. per-capita income) at the lowest value of that parameter, and then more rapidly as the value of the parameter increase, and finally slows down as saturation is approached [30]. Gately et. al. used Gompertz function in estimating the number of cars because it is more flexible and easier to use compared to logistic function when the relationship between vehicle ownership and per-capita income is used [30]. However, in this study, to make the estimation simpler, the model employed just used the historical data of vehicle ownership alone and create a mathematical function to project the future number. This function is used by Mohr et. al in estimating the world vehicle ownership [31].. 2.6.1 Vehicle Ownership Function The historical data of vehicle ownership in Taiwan could be calculated because the historical number of cars and population are known. The past data of population are taken from the National Statistics of Republic of China (ROCTaiwan) [32]; while the projection from 2012-2060 is taken from the Council for Economic Planning and Development (CEPD) [33], following the medium projection. Furthermore, the past data of number of vehicles in Taiwan is taken from the Ministry of Transportation and Communications [34]. See appendix 1 for the actual table of data. The function [31] used to simulate the vehicle ownership is defined in equation 2, discussed in Section 3.2.. 2.6.2 Weibull Distribution Function The Weibull Distribution function is used to model the lifetime data of certain commodity [35]. In this study, the lifetime distribution of vehicle is the one being estimated. The equation is discussed in Section 3.2. There are three figures (shown in Figure 5) that can be obtained from the Weibull distribution.. . 17 .
(31) . 1. b) CDF. 0 time 1. a) PDF. 0 time 1. c) 1‐CDF. 0 time Figure 5 Illustration of Weibull Distribution. . 18 .
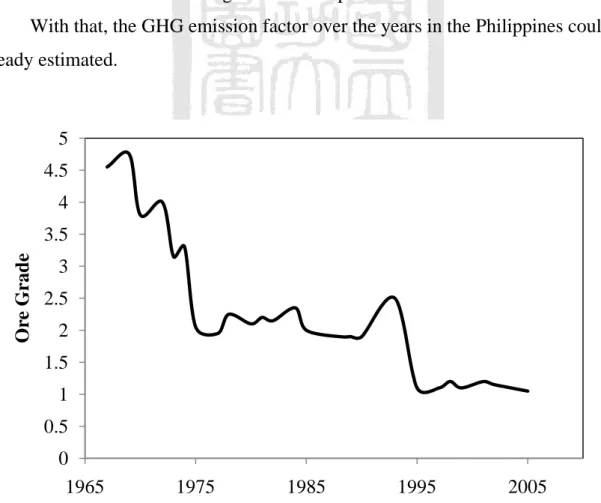
(32) . Figure5a, 4b, 4c show the cumulative discarded distribution, the discarded distribution, and the possessed distribution of vehicle over time. The function basically needs two parameters: the lifetime (defined here as Yi) of car and how the failure rate develops in time (known as the β which dictates the shape of the distribution of vehicle over time). According to study done by Global Climate and Energy Project of Standford University, the lifetime of electric vehicles with high-energy battery should be at least 10 years [36]. The shape parameter, β, for some mechanical components ranges from 1 to 3 [37]. Thus, it is safe to assume that an automobile will have a minimum shape parameter of 3. The lifetime of electric vehicles is assumed to be the same as the lifetime of its battery – meaning, when the vehicle is disposed, the battery is disposed with it as well. Or conversely, the lifetime design of the vehicle is based on the lifetime of the battery. This is because the cost of such vehicle comes mainly from the battery [21].. 2.7 Life Cycle Considerations and GHG Emission Inventories In this model, not all of the life cycle phases of Ni and Li will be considered. Only three phases – mining, downstream processing, and recycling – are discussed. The GHG emission from each industry mentioned are gathered from the existing literatures and is summarized in Table 7 in Chapter 3 Section 3.5.. 2.7.1 GHG Emission of Nickel Mining The type of Ni mine in the Philippines is lateritic [38]; and laterite ores requires more energy to process compared to the other type of nickel mine, the sulphide ore [39]. Thus, the burden of environmental impact on the country has become more serious and need to be considered in resource management. Furthermore, it is found out that the ore grade of Ni has been declining over the years [39], an average of 0.049% decrease per year in the last five decades. Nortgate et. al [27] showed that the GHG emission from mining Ni is exponentially. . 19 .
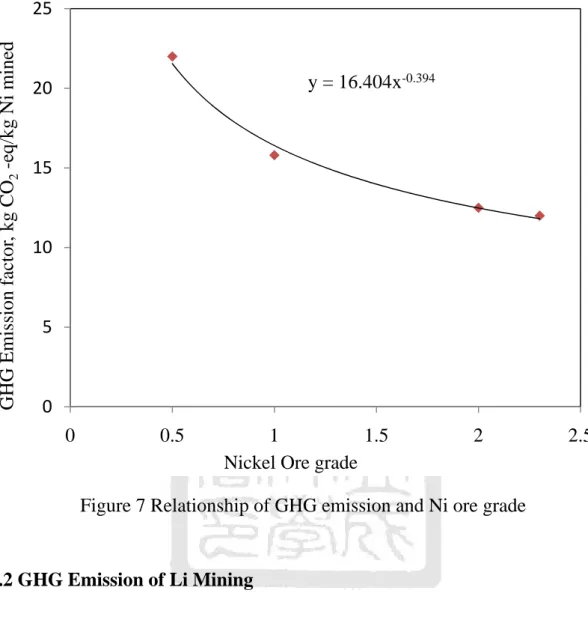
(33) . increasing as its ore grade declines. Figures 6 and 7 show the ore grade decline over time and the results of Nortgate’s studies, respectively. Ni mine life usually lasts for 25 years [40], with the first three years as the construction/start-up phase, and the succeeding years will be the full operations. Ramp down/closing begins in the last 3 years of the mine life. In this study, it is assumed that during the start-up phase, ore grade decline is very minimal or insignificant. The decrease in ore grade happens during the full operation years and stabilizes thereafter. The current average ore grade of Ni in the Philippines is ~1.3% [9]. Figure 11 (Section 3.5) shows the ore grade decline in the Philippines following these assumptions, and the average ore grade decline (0.049% per year), that is derived in Figure 6. These values are the input to the equation of the fitted curve of ore grade decline vs. GWP (kg CO2-eq/kg Ni) in Nortgate’s studies. Results are shown in Figure 11 in Chapter 3 Section 3.5. With that, the GHG emission factor over the years in the Philippines could be already estimated.. 5 4.5 4 Ore Grade. 3.5 3 2.5 2 1.5 1 0.5 0 1965. 1975. 1985. 1995. Figure 6 Nickel ore grade decline. . 20 . 2005.
(34) . GHG Emission factor, kg CO2 -eq/kg Ni mined. 25. y = 16.404x-0.394. 20. 15. 10. 5. 0 0. 0.5. 1 1.5 Nickel Ore grade. 2. 2.5. Figure 7 Relationship of GHG emission and Ni ore grade. 2.7.2 GHG Emission of Li Mining Li in Bolivia is sourced out of brine; thus the ore grade decline model is not applicable in this case. As previously discussed, a study made by Stamp et. al. on the comparative life cycle assessment between Li processing from Bolivia and Chile, coining the latter as with favourable conditions and the former with unfavourable conditions, showed that the former would generate more GHG emission per kg of LiCO3 processed. Table 4 shows the comparison of the results. Lithium from brine is processed to LiCO3, which is the base form of the mineral needed to produce any commercial product [11]. So, a kg of LiCO3 means a kg of Li processed.. . 21 .
(35) . Table 4 GHG Emission Factor Comparison of Li Mining from Two Different Sites Chile’s Li Processing (favourable). Bolivia’s case (unfavourable). 2.02. 82.01. 2.7.3 GHG Emission of Downstream Processing The Philippines has already a downstream processing for Ni. However, the nickel grade the country has been producing is just about 60% [41] which is still far short from the percent purity required by battery industry – that is above 99.9% [42]. If they would have to put a further refining, it would require more energy and thus generating more GHG emission. In the case of laterite ore, the downstream processing that should be employed is the hydrometallurgical route [43]. A study by Rankin et. al. showed that in refining a kg of nickel to 99.9% purity will generate about 16.1 kg CO2-eq. As for Li case, the Bolivian government wishes to produce a LiCO3 with purity of above 99.5% with the help of the technology brought by foreign investors [11, 43]; so the GHG emission by refining is already accounted for in the mining processing. In this model, “Li mining” means “Li mining and processing”.. 2.7.4 GHG Emission of Recycling The result of life cycle assessment done by Ishihara et. al [44]. will be utilized in this study. They reported the GHG emission as kg CO2-eq per kWh of EV-application Li-ion and NiMH batteries. This will be then converted to kg CO2eq per kg of metal by knowing the amount of metal contained in a battery (or the metal intensity, Ii) with a certain energy capacity expressed in kWh. This is already discussed in Section 2.2.3. This also means that the emission from recycling will change over time as the metal intensity, Ii, also changes with time. A mathematical expression for this will be discussed in Section 3.5.. . 22 .
(36) . 2.8 Battery Recycling Participation Rate and Efficiency Sullivan and Gaines reported that only little information is available on battery and battery material recycling; and most of the data represent primarily PbA (lead-acid) batteries and not advanced batteries such as NiMH and Li-ion [45]. In fact, USA EPA reports that nearly 90% of all PbA batteries are recycled [46]; and the International Lead Management Center reports that in many countries, recycling participation (that is the collection rate, will be mathematically defined based on material flow of metal in Chapter 3 Section 3.4) could go as high as 96% [47]. Also, based on the study done by Gruber at. al., recycling efficiency of Li-ion batteries could be feasible up to 90% [8]. It is assumed that Taiwan government also hope to employ as high efficiency; thus, in this model 90% is targeted, setting 50% as the initial efficiency with certain annual increase until it attains the maximum. As for the recycling participation, the initial is set to 50% as well; however, the maximum is set to 100%. This is to see check if Taiwan could achieve 100% metal supply share or recycled content of metal input to battery manufacturing when full participation of disposed metal is achieved.. . 23 .
(37) . Chapter 3 Methodology 3.1 Overall Framework To achieve the objectives, the methodology, shown in Figure 5, is designed. It shows the overall framework of the study which includes six subparts. First is the Demand Calculation, consists of series of estimations – from number of cars to metal* demands in Taiwan. This would require the second part that is the Scenario Setting to estimate the fraction of EVs out of the total number of cars, as well as to know how much metal are demanded by the EV industry over the years. Another part is the Life Cycle Considerations that consists of GHG emission inventories of Mining, Downstream Processing, and Recycling metal. After those steps, the metal supply allocation, and the associated GHG emission are calculated. Lastly, using all those information, roadmaps of recycling industry, and resource management and downstream processing industry for Taiwan and mining countries*, respectively, are developed.. *Note: From this point on, the term metal is referred to Ni and Li. Mining countries are the Philippines and Bolivia.. . 24 .
(38) . Improvement on Battery Technology. Calculate Ni and Li demands and disposals. Metal supply coming from mining, and recycling. Metal Supply Allocation Improvement on Recycling System and Technology. Inventories of Mining, Downstream Processing, and Recycling Ni and Li. Estimate number of EVs and the fraction of each type (BEV, PHEV, HEV). Vehicle Promotion Targets. Life Cycle Considerations. GHG Emission Calculation Total GHG emission from mining, downstream and recycling. Demand Calculation Est ima te nu mb er of car s. Scenario Setting. Roadmap Development • Taiwan’s metal recycling industry and battery technology improvement • Mining countries’ metal production management and downstream processing industry . Figure 8 Overall Framework of the Study. 25 .
(39) . 3.2 Number of Car Estimation (in-use, disposed, new) The first goal is to estimate the number of cars (in-use, disposed, and new). New demand car is estimated by the population balance model (equation 1), in which we need the number of in-use and disposed cars as inputs.. Ni. E E D i. i 1. i 1. eq. 1. where, Ni = demand for new cars at year i Ei – Ei-1 = annual increase in the number of in-used cars Di-1 = number of discarded cars As discussed on Literature Review, the equation by Mohr et. al. is modified and used to estimate the number of in-used cars in Taiwan: Ei p ( i )C (i ). eq. 2. where, p(i) = estimated population at year i C(i) = number of car/people at year i The number of car/people function is defined in equation 2:. C (i ) . 1 C sat (C max C sat ) exp[ (i io )]. eq. 3. where, io = 1979 (the initial year of simulation) Cmax = 51.5 (the number of people/car on the set initial year of simulation) Csat = 3.47 (the number of people/car will saturate at this value based on optimization) α = 0.182096 (constant based on optimization). . 26 .
(40) . The value of Csat and α are calculated based on optimization. The two parameters are varied and set to certain constraints in such a way that the sum of squares of residues (SSR) of actual and simulated number of car/people C(i) is minimized. The values of the constraints are set according to the literature review. Mathematically, this is expressed as follows: 2011. min SSR ( C ( i ) actual C ( i ) ,imulated ). 2. i 1979. 1.9. 3.9. eq. 4 eq. 5. and α is the variable.. The number of discarded cars is calculated using the Weibull Distribution function. The following shows the cumulative discarded ratio f vehicles in year i.. Y 1 W (i ) 1 exp Y 1 . eq. 6. i. where, W(i) = cumulative disposal ratio Yi = car life (assumed to be 10 years as per literature review) β = shape parameter (which is equal to 3 in this study, as per literature review) Γ = gamma function. To obtain the number of discarded cars, we need to multiply the discarded ratio – that is equal to [W(i) – W(i-1)] – with the actual number of new cars. The spread sheets of the simulations of number of cars are shown in Appendix.. . 27 .
(41) . 3.3 Scenario Setting and Demand Estimation There are two sets of scenarios created in this study, first is based on the Taiwan government EV promotion targets and the other is the battery technology improvement. These two sets of scenarios are created to estimate the fraction of EVs out of the total number of cars and the total metal demands, respectively. 3.3.1 Vehicle Promotion Target and EV Demand Estimation. On this part, there are two scenarios. The reference scenario (Government Plan) is partially based on the Taiwan’s EV promotion plan in which the unit sales until 2030 for BEV, and until 2020 both for PHEV and HEV are projected. Thus, additional assumptions are made that until 2060, BEV and PHEV will continue to increase in numbers; while HEV will decline after its peak in 2025. These assumptions are in accordance to the EV fleet promotion, i.e., the use of battery and plug-in electric vehicles, driven by zero exhaust or clean zone policy [48]. The Government Plan is considered to be the aggressive scenario and the second one, which is the Ten-year Delay is the conservative case. Figure 9 shows the car sales fraction of EVs in selected years, both for the two scenarios. The number of EV demand can now be calculated by multiplying the fraction from the total number of new demand previously estimated. Mathematically,. Ei , y Ei fi , y. eq. 7. where, Ei,y = EV demand fi,y = car sale fraction y = type of EV {HEV, PHEV, BEV}. . 28 .
(42) . 3.3.2 Battery Technology Improvement and Total Metal Demand Calculation. In this study the improvement in battery technology would mean an increase in Specific energy capacity (Ci) in terms of kWh/kg metal, or conversely a decrease in metal intensity (Ii) kg metal/kWh in one battery unit. As per literature review, the goal set by Rade et. al. is followed. They set a near term and future term goal of how much the metal intensity will decrease over the years. Since their study has been conducted more than a decade ago, their near term goal value will be used as the 2010 value in this study. Then it is assumed to have a linear decrease until the future term value they set is attained. The year in which the future term value is attained will be based on two cases. First case is when the annual decrease is 2.4% of the initial metal intensity, while the second case is 1.4%. The values of percentage decrease are set in such a way that the future term value is achieved in ten and twenty years’ time, respectively.. Government's Plan. Ten-year delay. Figure 9 Two Scenarios Designed in the Study . 29 .
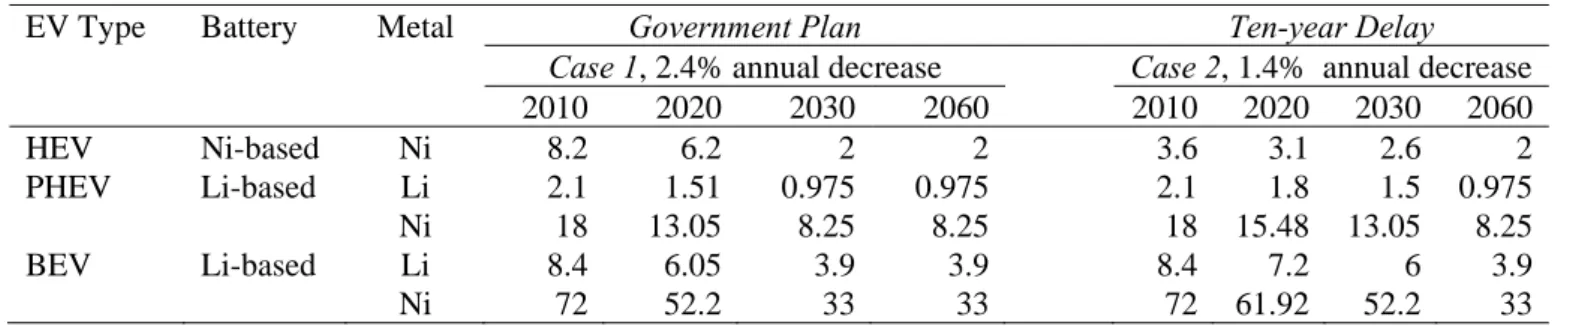
(43) . The following table summarizes the two cases for years 2010, 2020, 2030, and 2060 aligned with the Government Plan and Ten-year Delay scenarios previously set for EV demand estimation. Table 5 Metal Intensity Values based on Two Scenarios, kg/kWh EV Type. Battery. HEV PHEV. Ni-based Li-based. BEV. Li-based. Metal. Ni Li Ni Li Ni. Government Plan Case 1, 2.8% annual decrease 2010 2020 2030 2060 1.8 1.3 1 1 0.14 0.1 0.065 0.065 1.2 0.87 0.55 0.55 0.14 0.1 0.065 0.065 1.2 0.87 0.55 0.55. Ten-year Delay Case 2, 1.4% annual decrease 2010 2020 2030 2060 1.8 1.55 1.3 1 0.14 0.12 0.1 0.065 1.2 1.032 0.87 0.55 0.14 0.12 0.1 0.065 1.2 1.032 0.87 0.55. It is assumed that the metal intensity value will stop decreasing and stabilise at the theoretical values. The theoretical values of Ni in Ni-based, Ni in Li-based, and Li are 1.0, 0.55, and 0.065 kg/kWh, respectively [10]. To be able to know the amount of metal is needed per one unit of battery, the energy capacity of the EVs should be known. Based on the report made by US Department of Energy [24], the capacity requirements for HEVs, PHEVs, and BEVs are 2, 15, and 60 kWh respectively, which is followed in this model. The summary of metal requirement, expressed in kg, is shown in Table 6. Table 6 Metal Content of EV Batteries based on Two Scenarios, kg EV Type. Battery. HEV PHEV. Ni-based Li-based. BEV. Li-based. Metal. Ni Li Ni Li Ni. Government Plan Case 1, 2.4% annual decrease 2010 2020 2030 2060 8.2 6.2 2 2 2.1 1.51 0.975 0.975 18 13.05 8.25 8.25 8.4 6.05 3.9 3.9 72 52.2 33 33. Ten-year Delay Case 2, 1.4% annual decrease 2010 2020 2030 2060 3.6 3.1 2.6 2 2.1 1.8 1.5 0.975 18 15.48 13.05 8.25 8.4 7.2 6 3.9 72 61.92 52.2 33. The values above are multiplied to the estimated number of EVs to get the total metal demand. This is expressed mathematically below:. . 30 .
(44) . M i , Ni ,Total M i , Li ,Total. [( E. i. (E. i. f i , HEV ) ( I i , Ni 2 ). eq. 8. fi , PHEV ) ( I i , Li 15)] [( E i fi , BEV ) ( I i , Li 60 )]. eq. 9. 3.4 Metal Supply Allocation After estimating the total metal demand, the next step is to know how much will be supplied separately by Mining and Recycling industries. To make the allocation, it is important to know the material flow of the metal (see Figure 7). Based on the material flow above, the information we have is the sum of mi,x and ri,x, which is equivalent to the total metal demand (equations 10 and 11 for Ni and Li, respectively). Furthermore, Di,x is equal to the disposed metal, previously estimated. The next step is to estimate the values of Recycling Participation (Ri,x,par), or the collection rate, and Recycling Efficiency (Ri,x, eff) defined in equations 12 and 13, respectively. In this model, values for both starts at 50%, then the latter would have 1% (for Li-based battery) and 0.5% (for Ni-based) increase per annum until it reaches the 100%. Recycling efficiency for both metals is also set at 50% initially; however the maximum is just 90% (following the recycling efficiency for leadbased batteries).. Ri , x , par. . Ei , x. eq. 10. Di ,x F. i 1 , x. Ri , x ,eff. . ri , x. eq. 11. Ei ,x Gi1, x. F and G are the stock metals that are not being collected and recycled in the previous year i-1, respectively. Thus they are defined as,. . Fi1,x. (1 R. Gi1,x. (1 R. i , x , par. i , x ,eff. ) Di1,x. eq. 12. ) Ei1,x. eq. 13. 31 .
(45) . Knowing Ri,x,par and Ri, x,eff, the recycled metal, ri,x, can now be estimated; and also mi,x, which is just the difference of the total metal demands (Mi,Ni,Total and Mi,Li,Total) and ri,x. Results for the trend of Ri,x,par and Ri, x,eff is shown in Figure 18. The parameters ri,x and mi,x are expressed in terms of RCi,x, which could tell the percentage of recycled content input to battery manufacturing, conversely the percent share of Taiwan from the total metal supply.. RCi , x. . ri , x ri , x mi , x. 1. eq. 14. There might come a point that the metal stocks are more than enough to supply the demand, so the equation is restricted not to exceed 1. The rationale behind the constraint, i.e. set not to a more practical number e.g. less than one, is that to see until what year the stocks of disposed metal will equal to the demand, indicating a sufficiency of resource input to recycling industry. Thus, arises the importance of this parameter – a basis on when to establish a recycling industry in Taiwan.. . 32 .
(46) . Figure 10 Material Flo ow of Metal . 33 .
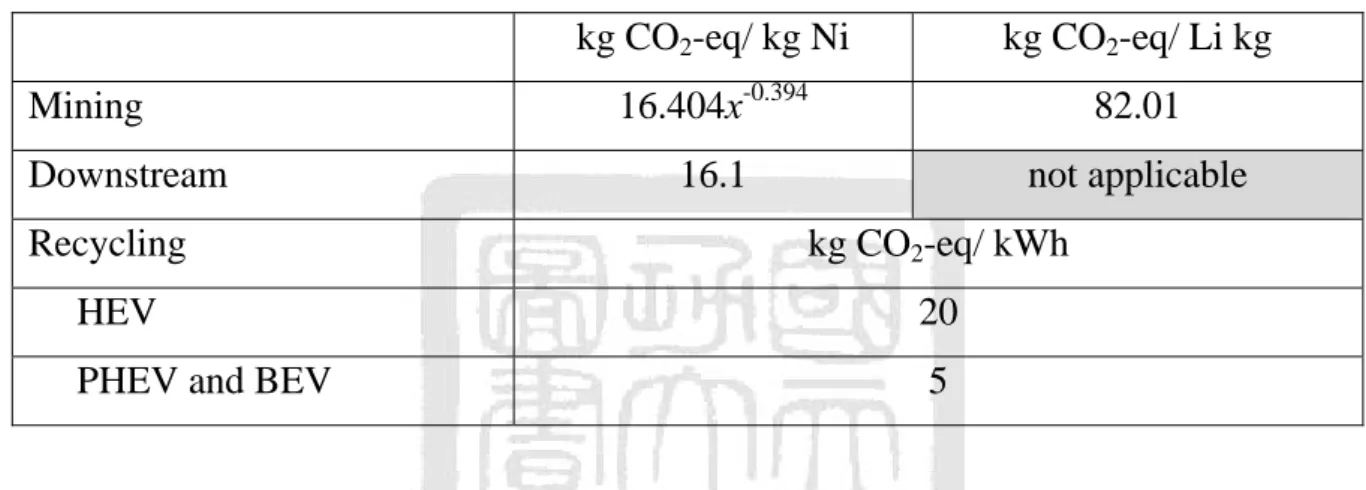
(47) . 3.5 Life Cycle Considerations and GHG Emission Calculation It has been pointed out already in the literature review section that not all of the metal life cycle will be covered in this model. Only the mining, downstream processing, and recycling phases are considered. Table 7, Figure 8, Figure 9 show the summary of the inventories of GHG emission of the three phases. The values are based on literature review, discussed in the previous chapter.. Table 7 GHG Emission Summary of three Industries. Mining Downstream. kg CO2-eq/ kg Ni. kg CO2-eq/ Li kg. 16.404x-0.394. 82.01. 16.1. not applicable. Recycling. kg CO2-eq/ kWh. HEV. 20. PHEV and BEV. 5. It is discussed that the GHG emission of Ni mining is dependent on the ore grade. Figure 5 (of Chapter 2 Literature Review Section 2.8.1) shows the relationship of the ore grade and the GHG emission factor. From the fitted curve and resulting equation shown in Table 7, the GHG emission at certain ore grade, x, can be calculated. Figure 11 shows how the GHG emission from Ni mining will go at ore grade of the metal in each year. The initial x is set to 1.3 (based on the current average ore grade of Ni in the Philippines), then will have a 0.049 annual year decrease until it gets to saturate at 0.271 (this is the assumed minimum ore grade, which will be attained after 25 years of mine life following the ore grade decline rate). The downstream processing emission in Li mining in Bolivia is already associated in the mining phase, as already tackled in the literature review. Recycling GHG emission is based on per energy capacity of the battery. HEV battery contains nickel; while PHEV and BEV contain both Ni and Li. To. . 34 .
(48) . convert the emission to kg CO2-eq / kg metal, the energy capacity and metal content of the battery must be known. This has already been presented in Section 3.3.2. The. 1.4. 30. 1.2. 25. 1 20 GHG Emission of Ni Mining Ore Grade Decline. 0.8. 15 0.6. Ore Grade. GHG Emission of Ni Mining, kg CO2-eq/kgNi. result of calculation is shown in Figure 12.. 10 0.4 5. 0 2010. 0.2. 2020. 2030. 2040. 2050. 0 2060. Figure 11 GHG Emission of Ni Mining in the Philippines at certain ore grade. . 35 .
(49) . GHG Emission factor, kg CO2-eq/ kg metal. 90 80 70 60 Ni in HEV 50 Ni in PHEV and BEV 40 Li in PHEV and BEV 30 20 10 0 2010. 2020. 2030. 2040. 2050. 2060. Figure 12 GHG Emission of Recycling Ni and Li contained in EV batteries. The GHG emission can now be explicitly calculated using the inventories and the equation below: Z i,P ,x. ef. i,P ,x. M i,P ,x. eq. 15. where, i = year P = life cycle phase {mining (m), downstream processing (dp), recycling (r)} x = metal {Ni, Li} ef = emission factor, kg CO2-eq/kg metal M = amount of metal, kg. . 36 .
(50) . 3.6 Roadmap Development In this section, the information of the roadmap to propose for the stakeholders and how the results of the calculations are interconnected with each other will be defined. Figure 10 shows the overall picture of the roadmap contents. Start off with the Ni and Li demands in Taiwan dictated by the number of new EVs deployed (a) and metal intensity of the battery (b). These metal demands will be supplied by the Philippines and Bolivia, denoted by (g) and (k), respectively. Then the amount mined Ni in the Philippines can be the basis of the downstream processing capacity (h) that the country plans to establish. The associated GHG emission, (j) and (l), from mining such metal will be one of the contents of the roadmap as well. The GHG emissions from downstream processing of Ni, (i) is also important information for the Philippines should they establish it in the future. On Taiwan’s end, the amount of metal to be supplied by recycling industry, denoted by (e) is dictated by recycling participation (c) and recycling efficiency (d). And lastly, the associated emission from recycling process (f) is also an input to the roadmap. All of the calculations are done for year 2010 to 2060.. . 37 .
(51) . (l)) (k). (j). (i). (g) ( (h). (f) (c) (d). (e) (a) Fig gure 13 Informaation Overview w of the Roadmap . 38 . (b).
(52) . Chapter 4 Results and Discussion This chapter will focus on Government Plan scenario. The other scenario set in the model, that is the Ten-year Delay of the Government Plan, will be discussed in Chapter 5.. 4.1 Number of Cars Projection and Breakdown The results of estimation of car in-used and new demand are shown in Figures 14 and 15, respectively.. 6,000,000 BEV. PHEV. HEV. ICEV. Number of Cars in Taiwan. 5,000,000. 4,000,000. 3,000,000. 2,000,000. 1,000,000. 0 1990. 2000. 2010. 2020. 2030. 2040. 2050. Figure 14 Number and Breakdown of In-used Cars in Taiwan. . 39 . 2060.
(53) . Number and breakdown of new demand cars, '000 units. BEV. PHEV. HEV. ICEV. 500 450 400 350 300 250 200 150 100 50 0 2010. 2020. 2030. 2040. 2050. 2060. Figure 15 Number and breakdown of new demand cars As seen from the Figure 14, the number of in-used cars of internal combustion engine vehicle (ICEV) will decline after 2010 due to declining sales (shown in Figure 15); the number of sales will then slightly increase and goes to saturation; after that, it declines through 2060. HEV sales peak in 2025 and the inused will increases until 2030 but will decline thereafter as there will be shift from using Ni-based to Li-based battery for EVs. On the other hand, PHEV in-used slowly increases until 2060 due to a very minimal rate of increase in sales. BEV will increase until 2030, and when the goal of the government is attained, that is to reach 200,000 units of domestic sales, it will saturate thereafter. Overall the number of inused cars in Taiwan has a decreasing trend after 2030 as the population of the country is declining.. . 40 .
(54) . 4.2 Total Metal Demand Based on the number of EV estimation, the Ni and Li demands are calculated as the amount of the metal contained in one unit of the battery is known. The metal content is calculated based on the improvement on battery – that is requiring less metal intensity, Ii, as technology continues to advance in the next decades. Figure 16 shows the metal demand by EV industry from 2010 to 2060. EV will demand more Ni than Li, in general, because HEV’s metal requirement is larger than PHEV’s and BEV’s per one unit of battery; and also, PHEV and BEV also use Ni as one of components of its battery. Ni demand, however, still experiences a declining trend after 2030 as HEV demand will decrease from that year on. Ni demand declines after 2030 because in. Ni - Government Plan. Li - Government Plan. 9. Metal Demand, kt. 8 7 6 5 4 3 2 1 0 2010. . 2020. 2030 2040 Figure 16 Total Metal Demand. 41 . 2050. 2060.
(55) . this year, majority of Ni-based batteries have been already replaced by Li-based. However, although there is a shift from Ni- to Li-based, the amount of Ni demand does not decline significantly. This is because Li-based batteries contain Ni as well. Li demand, on the other hand, becomes relatively stable due to the saturation of BEV demand and slow increase rate of PHEV. Furthermore, these metal demands are allocated to Mining and Recycling industries – that is how much of the total metal demand will be supplied by the mining countries (Philippine and Bolivia) and by Taiwan to its own. These will be discussed in Section 4.5.. 4.3 Improvement on Battery’s Metal Intensity, Ii, In this model, improvement on battery technology means the development on the metal intensity of the battery. The metals of interest are Ni and Li only. Ni is contained in the chosen battery of the three EV types, while Li is only contained in PHEV and BEV. In addition, Ni is present both in cathode and anode of HEV’s battery; while Li is only in cathode part of PHEV and BEV’s chosen battery. Figure 17 illustrates how the intensities of these metals are improved over the years according to the set scenario. The figure shows that Ni intensity for HEV will attain saturation, that is the theoretical value, in year 2024. Its metal intensity in PHEV and BEV are equal and will reach saturation in 2033. Li intensity in PHEV and BEV is likewise equal and saturates in 2030.. 4.4 Improvement on Recycling System and Technology This study defines recycling system as Recycling Participation, Rpar, which means the rate at which EV batteries are collected to be sent to recycling facilities. Recycling technology, on the other hand, refers to the recyclability of the battery in terms of recovering Ni and Li. This is basically the Recycling Efficiency, Reff. Figure 18 shows how the trend of the improvement will go through the next decades.. . 42 .
(56) . Metal Intensity, kg/kWh. 4.50 4.00. Ni intensity - HEV. 3.50. Ni intensity - PHEV and BEV Li intensity - PHEV and BEV. 3.00 2.50 2.00 1.50 1.00 0.50 0.00 2010. 2020. 2030. 2040. 2050. 2060. Figure 17 Metal intensities over time. Recycling Participation and Efficiency. 1.0 1.0 0.9 0.9 0.8 0.8 0.7 0.7. Li and Ni Recycling Efficiency. 0.6. Li and Ni Recycling Participation. 0.6 0.5 2010. 2020. 2030. 2040. 2050. Figure 18 Improvement on recycling participation and efficiency . 43 . 2060.
數據


+7

相關文件
A good way to lead students into reading poetry is to teach them how to write their own poems.. The boys love the musical quality of
Report to the class what you have found out about the causes of the social problem identified (i.e. what the causes are, and how details and examples are given to
• Teaching grammar through texts enables students to see how the choice of language items is?. affected by the context and how it shapes the tone, style and register of
With the aid of a supply - demand diagram, explain how the introduction of an effective minimum wage law would affect the wage and the quantity of workers employed in that
The course objective is designed to let students learn the following topics: (1) international trade, (2) business letters highly used in trade, (2) business letters highly used
OpenGL 4.2 Reference card: Blue means!. deprecated
grep - print lines matching a pattern. $ grep [OPTIONS]
Mount Davis Service Reservoir Tentative cavern site.. Norway – Water
