國立臺灣大學工學院暨醫學院醫學工程學研究所 碩士論文
Graduate Institute of Biomedical Engineering College of Medicine and college of Engineering
National Taiwan University Master Thesis
多模式功能性造影研究中嗎啡類蛋白對傷害覺反應之調停
Multi-modality functional imaging of opioid intervention in nociception
江昀真 Yun-Chen Chiang
指導教授:張 程 博士, 趙福杉 博士
Advisor: Chen Chang, Ph.D. and Fu-Shan Jaw, Ph.D.
中華民國 98 年 5 月
致 致 致 致 謝謝謝謝
這本論文能夠順利完成,首先要鄭重感謝彥宇學長這幾年來不厭其煩地指 導,自大學時代一直到研究所都受惠你良多,不管是在實驗上的執著還是想法 上的創新,總是有我學不完的地方。感謝建源學長,在機器操作上給予我最大 的支持並不時提供建議,讓我每每遭遇困難的時候,得以參考你豐富的經驗。
謝謝明煌學長幫忙管理實驗所需要的動物和物資,細心的記錄所需成為每次實 驗的最佳補給。感謝益華學長在 histology 和 anatomy 方面的教導,淺白的說 明讓人獲益良多。感謝本立、瑀潔、乙立學姊,謝謝你們的帶領,在課業上或 是生活上都給我很大的鼓勵。感謝 imaging group 偉杰、庭毅、英原、建翔和 大為等,相輔相成的學習過程中多虧有你們的陪伴,我才能學習更多成長的更 快,在這裡先預祝你們實驗成功順利。還要感謝 NTU 電生理實驗室的學長姐及 夥伴,尤其是右宗和仲軒兩位學長的耐心陪伴。謝謝 fMIC 的每一位盡心盡力為 實驗室付出的朋友們,你們的努力讓實驗室更美好。
感謝趙福杉老師給予我的信任和自由,不吝於讓學生與其他老師學習所 長,關心我們的課業生活卻不多加管束,使學生更能清楚省視自我,或許正因 如此大家總能保持積極進取的態度,為將來所打拼,能沉浸在這樣的學習環境 裡真的十分幸福。感謝張程老師在研究上對我的大力支持,實驗上給我最大的 自由卻又同時關心每一個細節,點滴為學生著想,不單對現在的生活或是未來 的規劃都給予中肯的建議和無私的鼓勵,永難忘記老師在思考上的嚴謹以及言 談間所自然流露出對於研究的熱誠,這已是我念研究所最值得的收穫。
最後要感謝爸、媽和妹妹,從小到大在學習的路上我總是帶著自我的堅持,
多虧你們義無反顧地支持,才讓我能一直無憂無慮地走自己的路,這個學位是
與你們共享的。感謝我的摯友們(在此就不逐一列舉),不知不覺你們又陪我走
過了生命中的一個里程碑,謝謝你們一直以來不斷帶給我力量。謝謝熊,這兩
年來的陪伴無可取代。
中文摘要中文摘要中文摘要 中文摘要
由於大腦對於疼痛機制的調節非常複雜,要能夠了解各個腦區的對於痛覺 的調節作用便需要同時得知神經活動於時間和空間上的變化。近幾年來,功能 性造影技術大量的應用在痛覺研究中。功能性磁振照影和正子電腦斷層是最常 見的非侵入式造影技術。這兩種造影技術可以反應腦血流相關動態變化及分子 間作用等相關訊息,以利於我們將結果類推至大腦中神經之活動。然而在疼痛刺 激下,腦部產生之自主止痛的調節作用可能會對疼痛訊息產生干預。其中,又 以多巴胺及類嗎啡系統在痛覺緩解作用中佔了相當重要的角色。本論文利用氟
-18 標定去氧葡萄糖正子照影及腦血量權重功能性磁振照影,觀察大鼠痛覺反
應下血液動力參數變化和代謝的反應。基於全腦神經代謝活動與特定腦區內生
性神經傳導物質所調控的神經血管偶和反應等實驗結果,我們探討在這些功能
性訊號中類嗎啡蛋白所扮演的調停角色。藉此,提出利用功能性照影技術時需
要注意神經傳遞物質及自體調節現象對於影像訊號的影響。
Abstract
Due to the complexity of the pain processing in brain, understanding the antinociceptive modulation within brain areas raises a need for simultaneously detecting the spatiotemporal patterns of neuronal activities. In the last decades, arising consciousness of pain using in vivo imaging techniques have dramatically increased. Functional magnetic resonance imaging (fMRI) and positron emission tomography (PET) are the most commonly used techniques providing non-invasive, in vivo measurement of the cerebral hemodynamics as well as molecular processes.
However, the antinociceptive effect of the autoregulation may shadow the functional signal under nociception. Among all, dopamine and opioid system are considered to play significant roles in pain modulation, in which endogenous opioid peptides potentially act as a positive regulator. This thesis utilizes cerebral blood volume weighted fMRI and
18F-fluorodeoxyglucose microPET to capture nociception induced hemodynamic responses and metabolic features in the rodent brain. Stating from the investigation of the whole brain neuronal activation to the specific cerebral region with neuronal vascular coupling due to endogenous neurotransmitters, the intervention of opioids in the signal of functional imaging was interpreted. The study highlights the awareness of the endogenous neurotransmission and self-regulation interference in in vivo functional studies of pain.
Keywords: Pain; Opioids; fMRI; PET; pain
Content
1. Introduction……….. 1
1.1 Preface……… 1
1.2 Outline of opioid system……….……… 2
1.3 Opioid systems and dopaminergic neuron……… 6
1.4 Pain and functional imaging……….……… 9
1.5 Objectives……….. 11
2. Whole Brain Imaging of Morphine Anti-nociception Effect in Rats Using FDG
18microPET……… 12
2.1 Introduction……….……. 13
2.2 Materials and methods………..……… 15
2.2.1 Subjects………..…. 15
2.2.2 Image experiments……….…………. 15
2.2.3 Data analysis………... 16
2.3 Results………..………… 18
2.3.1 Formalin-induced nociceptive maps……….………. 18
3. Involvement of Opioid Peptides in Negative fMRI Signals…....…………..…. 25
3.1 Introduction……….………. 25
3.2 Materials and methods………..……… 26
3.2.1 Subjects………..…. 26
3.2.2 fMRI experiments: Animal preparation……….………. 26
3.2.3 fMRI experiments: pharmacological MRI……….…………. 27
3.2.4 fMRI experiments: Data acquisitions……….………28
3.2.5 fMRI experiments: Data analysis………...29
3.2.6 Histological experiments: Fos immunohistochemistry of the CPu…….30
3.2.7 Electrophysiological recording………...31
3.3 Results.…...………….……….………..………32
3.3.1 CBV changes during graded electrical stimulation……….32
3.3.2 Neural activity of the CPu induced by nociceptive electrical stimulation...33
3.3.3 Effects of dopamine D2/D3 antagonist on striatal vasoconstriction…...34
3.3.4 The lesion of the substantia nigra (SN) with 6-hydroxydopamine……….. (6-OHDA) diminishes the striatal vasoconstriction………34
3.3.5 Effects of morphine on striatal vasoconstriction……….35
3.3.6 The interaction of MOR and D2/D3 systems on striatal
vasoconstriction………..36
3.4 Discussion& Conclusion….………46
References………...56
Abbreviation………....62
Appendix……….…64
1. Introduction
1.1 Preface
Pain can be extremely painful and debilitating with no time limit, which is defined as “an unpleasant sensory and emotional experience associated with actual or potential tissue damage, or described in terms of such damage” – International Association for the Study of Pain (IASP).
According to American Pain Society, 45% of Americans suffer from persistent pain at some point in their lives. Pain is the most common reason Americans seek for medical care. With improvement of medical care, reliability requirement for pain manager has become more critical.
Therefore, in order to manage unpleasant feeling caused by pain, the modulation of the pain inhibition has to be widely investigated. Among all, endogenous opioid peptides play a crucial role as the most effective autoregulated analgesics.
In recent years, in vivo functional neuroimaging, such as positron emission tomography (PET) and functional magnetic resonance imaging (fMRI) providing intact whole-brain functional responses, are frequently used to investigate the antinociception effect in brain. Using these imaging modalities, it has been proved that peripheral noxious stimulation would increase regional cerebral blood flow (rCBF) and cerebral metabolic rate of glucose (CMRglc) in the brain. However, the delicate relationship between pain and endogenous analgesic is still ambiguous, and especially affects the interpretation of imaging data.
1.2 Outline of brain opioid systems
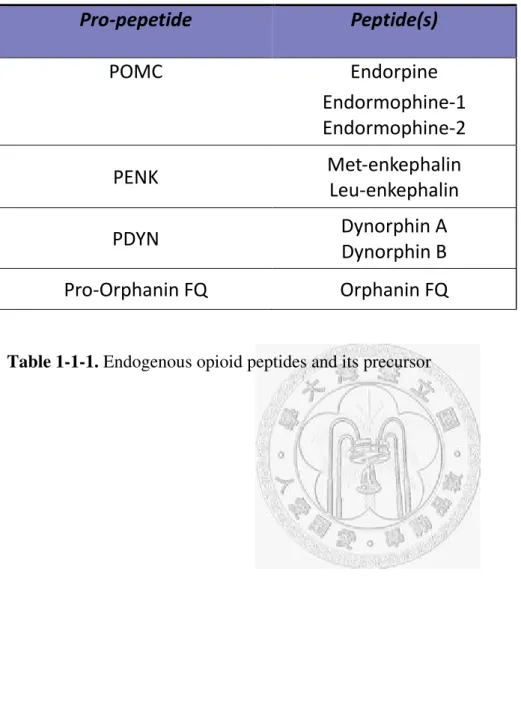
Opioids are the most widely used and extremely effective analgesic drugs to treat moderate to severe pain. Endogenous opioid system plays a critical role in modulating a large number of sensory, motivational, emotional, and cognitive functions. There is an abundance of evidence to suggest the existence of several families of opioid peptides in the mammalian central nervous system (Zadina et al., 1997; Darland et al., 1998). The most commonly recognized endogenous opioids are dynorphins, enkephalins and endorphins, which are all post-transcriptionally generated by their precursors (Table. 1-1-1). For example, Pro-opiomelanocortin’s (POMC) is the pro-peptide of endorpine.
After the post-translational cleavage of the proenkephalin (PENK), PENK can generate four copy of methionine-enkephalin (M-Enk) and one copy of leucine-enkephalin (L-Enk) (Hughes et al., 1975).
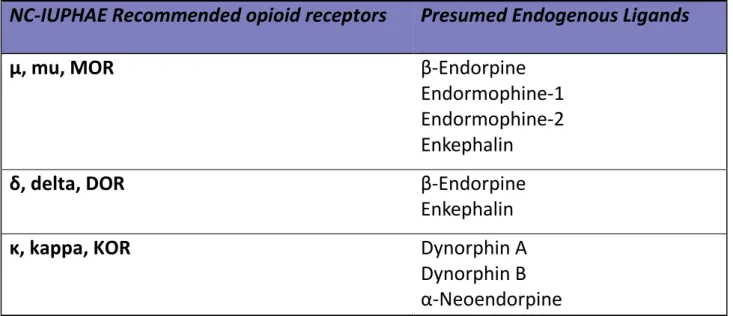
The analgesic ability of an opioid must works by binding to opioid receptors. Opioid receptors are a group of G-protein coupled receptors, separating into three main types: µ, κ and δ. Each of these receptors is differentially distributed in several neuronal circuits (Table. 1-1-2). The µ receptors (MOR) are widely distributed in the rat brain, and mainly located in amygdala (Amyg), hippocampus (HIP), ventral dentate gyrus, presubiculum, nucleus accumbens (NAs), caudate putamen (CPu), thalamus (Th), habenula, interpeduncular nucleus, pars compacta of the substantia nigra (SN), superior and inferior colliculi, and raphe nuclei. The Kappa binding test showed not widely spread but densely distributed in the Amyg, olfactory tubercle (OT), NAs, CPu, medial preoptic area, hypothalamus (HT), median eminence, periventricular thalamus, and interpeduncular nucleus. Besides, the binding of δ was restricted only to few cerebral areas, such as anterior cingulate cortex (ACC), neocortex, Amyg, OT, NAs, and CPu.
coupling, in most cases leading to the decrease of cAMP concentration in target cells. The downstream signaling will promote the opening of K+ channels and inhibit the opening of voltage gated Ca 2+ channels, and then decrease the firing of target cells, mostly GABAergic interneurons.
Although three types of opioid receptors are all considered to involve in analgesia, based on pharmacological and clinical observation, MOR are generally recognized as the major site of interaction in clinical analgesics, such as morphine (Appendix 1: the structure of morphine). MOR mediation of much morphine-induced analgesia often company with reduced blood pressure, nausea, euphoria, and decreased respiration.
Pro-pepetide Peptide(s)
POMC Endorpine
Endormophine-1 Endormophine-2 PENK Met-enkephalin
Leu-enkephalin
PDYN Dynorphin A
Dynorphin B Pro-Orphanin FQ Orphanin FQ
Table 1-1-1. Endogenous opioid peptides and its precursor
NC-IUPHAE Recommended opioid receptors Presumed Endogenous Ligands
μ, mu, MOR β-Endorpine
Endormophine-1 Endormophine-2 Enkephalin
δ, delta, DOR β-Endorpine
Enkephalin
κ, kappa, KOR Dynorphin A
Dynorphin B α-Neoendorpine
Table 1-1-2. Types of opioid receptors and its endogenous ligands
1.3 Opioid systems and dopaminergic neuron
As reported by Choi et al., stimulating the dopamine D1/D5 systems causes cerebral vasodilation, whereas stimulating the D2/D3 systems, in contrast, causes vasoconstriction (Choi et al., 2006). In another aspect, while opioid exerts its effect directly from the binding of opioid receptors, still there are numerous secondary interaction thought to be mediated by its target—
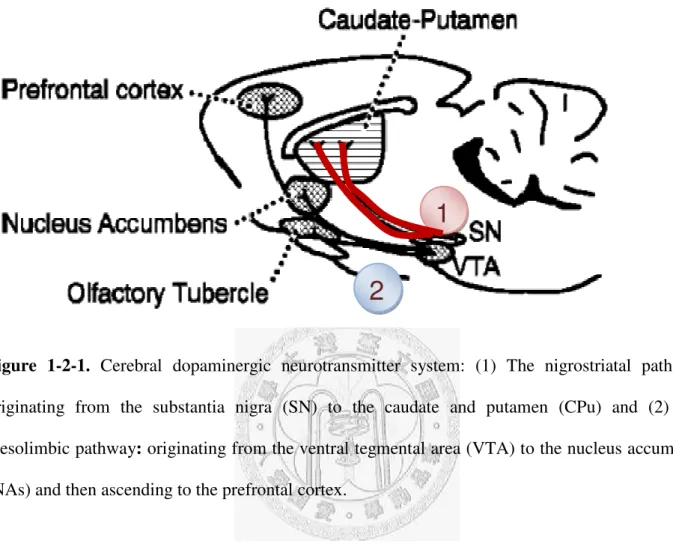
GABAergic cells (Johnson and North, 1992). Acting on cerebral dopamine neurotransmitter systems, opioids are considered to modulate both the nigrostriatal and the mesolimbic dopaminergic neuronal transmission (Fig. 1-2-1). Several pharmacological studies have shown that selective agonism of MOR using morphine and methadone increase turnover and metabolism of dopamine in brain (Clouet and Ratner 1970). After morphine administration, both the concentration of dopamine precursor DOPA and corresponding metabolites are accumulated (Moleman et al., 1984). Most of the studies suggested that µ-opioid agonists activate dopaminergic neurons via inhibiting the GABAergic neurons that serve as an inhibitory control in the firing of dopaminergic neurons (Henry et al., 1992; Johnson and North, 1992).
The opioid-enhanced of dopamine release in the mesolimbic dopaminergic pathway is widely recognized. Studies conducted by in vivo microdialysis indicate that binding of MOR increases synaptic dopamine levels in the nucleus accumbens as well as in the prefrontal cortex in animals (Di Chiara and Imperato, 1988; Spanagel et al., 1990; Devine et al., 1993). Electrophysiological evidences on local drug injections have shown that peripherally administered µ-opioid agonists generally enhance the firing frequency of dopaminergic neurons in the ventral mesencephalon (Gysling and Wang, 1983; Hommer and Pert, 1983). Furthermore, the infusion of an enkephalinase
However, the evidence for opioid-induced dopamine release effect in the nigrostriatal pathway is not as clear as in the mesolimbic pathway. Some claimed that the application of MOR agonists evaluated the dopamine release in the CPu (Di Chiara and Imperato, 1988); while, other experiments contrarily reported that the activation of MOR might have an inhibitory effect on dopamine release in the CPu (Piepponen et al., 1999). The specific mechanism and regulation is still not well understood.
Figure 1-2-1. Cerebral dopaminergic neurotransmitter system: (1) The nigrostriatal pathway:
originating from the substantia nigra (SN) to the caudate and putamen (CPu) and (2) The mesolimbic pathway: originating from the ventral tegmental area (VTA) to the nucleus accumbens (NAs) and then ascending to the prefrontal cortex.
1
2
1.4 Pain and functional imaging
In traditional pain research, scientists often apply electrophysiology such as single-unit recording and field potential recording to record signals of neuronal activity. It involves measurements of voltage change or electrical current flow on neurons, and particularly action potential activity. A major limitation for traditional neuronal signal recording techniques in small animals is the restricted recording areas, the undetectable depth, and the limited signal sensitivity.
Also, it is not easy to simultaneously obtain the global signals induced by painful stimuli among a large number of nuclei in different positions. These traditional electrophysiological methods may have a better temporal resolution but do not have the capability to record the whole brain signals.
Functional images, such as PET and fMRI, can provide intact functional signals by using brain mapping techniques. These imaging techniques provide non-invasive, in vivo measurement of the cerebral hemodynamics as well as molecular processes (Phelps, 2000; Logothetis et al., 2001;
Heeger and Ress, 2002; Jacobs et al., 2003; Zanzonico, 2004; Heiss and Herholz, 2006).
In 1990, Ogawa proposed the blood-oxygenation-level-dependent (BOLD) fMRI method based on cerebral hemodynamics (Ogawa et al., 1990). And then in 1992, Kwong applied this theory to depict the activation of visual and motor cortex (Kwong et al., 1992). Several groups also used the BOLD theory to illustrate the brain function (Bandettini et al., 1992; Frahm et al., 1992; Ogawa et al., 1992). Since then it comes a brand-new era of neuroscience in fMRI. The principle of BOLD is based on the existence of paramagnetic substance, such as deoxy-hemoglobin, which could interfere with magnetic field and further reduce the intensity of signal. Generally speaking, the local cellular activity is supported by blood flow, and the consumption of glucose is directly related to synaptic activity (Schwartz et al., 1979; Fox et al., 1988; Chugani et al., 1991; Sibson et al., 1998). Therefore, these mechanisms could roughly infer that the blood flow increase is related to the activation of neurons (Branston, 1995; Cohen et al., 1996). The activation of neurons would further induce arteriolar vasodilatation and over-compensate the regional cerebral blood flow (CBF) to bring more
oxygen and glucose. Hence, it causes the ratio of paramagnetic deoxy-hemoglobin in blood to be reduced when the neural activity increases in brain, so more intensive signal can be obtained in the activated regions (Hyder et al., 2001; Logothetis et al., 2001; Heeger and Ress, 2002).
PET is another noninvasive imaging technique which is one of the important tools in clinical diagnosis and research. The image of PET is formed by detecting the distribution of positron emitter.
Positrons are given off during the decay of the nuclei of specific radioisotopes. When a positron annihilate with an electron, after a succession of collision and deceleration , two gamma rays having the same 511keV energy, at an angle of 180 ± 0.25 degree will be produced. The gamma rays leave the body and are detected by the PET scanner. The information is then reconstructed by a mathematic algorithm and fed into a computer to be converted into a complex picture of the activities. Since microPET is designed for small animals which could conduct preclinical studies and facilitate basic researches, it can eliminate the need of sacrificing animals by enabling noninvasive, longitudinal, and serial studies. As noted, microPET can be used for serial assessment of metabolic function of individual, awake rats with a minimal degree of invasiveness, and therefore, has the potential for use in the study of brain disorders and repair. To conduct the scan, a short-lived radioactive tracer isotope, which has been chemically incorporated into a metabolically active molecule, is injected into the living subject. Therefore, the function being studied during a PET scan determines which radiopharmaceutical is used. Recently, the molecule most commonly used in the observation of the brain’s glucose metabolism is fluorodeoxyglucose (18F-FDG). Since incorporation of deoxyglucose reflects the metabolic activity of the brain (Sokoloff et al., 1977), microPET studies permit assessment of brain metabolic activity in conscious animals, followed by scanning in sedated animals.
1.5 Objectives
Although nociception studies have widely used in vivo functional imaging to track neuronal activities, whether the endogenous neurotransmitters would affect the function signals under nociceptive stimulation is still obscure. It has been commonly known that extracellular dopamine concentration is regulated by opioids, which are highly implicated in the antinociceptive response.
Also, it has been reported that different dopamine subtypes would cause vascular coupling effect and affect the functional signal in rat brain. Therefore, it is reasonable to speculate the possibility that opioids may modulate dopamine systems and affect the imaging signals.
The goal of the present thesis was to map the opioids intervention in functional imaging of pain.
First, microPET is used to examine whole brain metabolic responses as well as antinociceptive effect of opioids. Further assessments were performed by phMRI to address the effect of opioid system in the generation of fMRI signals. With the aid of multimodality imaging, the results could extensively interpret neurovascular modulations under antinoceptive regulation of opioids.
2. Whole Brain Imaging of Morphine Antinociception Effect in Rats using
18F-FDG microPET
The present experiment used high resolution microPET to evaluate brain glucose metabolism following peripheral noxious stimuli. 18F-FDG was used as a radiotracer and was intravenously injected following 5% formalin stimuli at the left hindpaw. Animals were then returned to their cage for 45 min uptake during the conscious state. The results demonstrated that an injection of formalin into the hindpaw resulted in significant activation (p<0.05) in the bilateral ACC, motor cortex (M), primary somatorysensory cortex (S1), secondary somatorysensory cortex (S2), insular cortex (IC), CPu, HIP, periaqueductal gray (PAG), Th, contralateral auditory cortex (AC),
visual cortex
(VC), Amyg, and HT. Among the measured areas, clear lateralization (p<0.05) was observed in S1, VC, and HT. Compared to the formalin group, pretreatment of lidocaine (4 mg/kg, i.v.) significantly decreased 18F-FDG uptake in bilateral ACC, M, S1, S2, IC, AC, CPu, HIP, PAG, Th, HT, and ipsilateral Amyg. In addition, pretreatment of morphine (10 mg/kg, i.v.) suppressed 18F-FDG uptake in bilateral ACC, M, S1, S2, IC, AC, CPu, HIP, PAG, Th, HT, ipsilateral VC, and Amyg. The present protocol allowed identification of the brain levels involving in pain modulation, and also provide evidence of each brain area under antinociceptive control of morphine and lidocaine.2.1 Introduction
Exploring the nociceptive responses in brain is an important issue. In recent years, new pain-relief drugs and technologies have been sequentially developed to alleviate human suffering of pain. These advancements were indispensable to the animal testing stage and thus reinforce the importance of the pain study in small animals. The mechanisms and circuitries underlying nociception in the brain are extremely complex, involving not only the sensory responses to noxious stimuli, but also cognitive and emotional factors (McMahon and Koltzenburg, 2005). This makes it difficult to conclusively identify the brain areas that specifically process and respond to nociceptive signals. Imaging approaches such as PET and fMRI can provide intact functional mapping of the brain and allow measurement of the responses in different brain areas simultaneously (Phelps et al., 1979; Ogawa et al., 1990).
In the studies of nociception, formalin is one of the most commonly used chemical stimulants for generating nociceptive responses since it evokes a chemical pain without the influence of other sensory modalities (Tjolsen et al., 1992). However, during fMRI experiments, anesthesia is usually needed to achieve animal sedation and reduce motion artefacts. This tackles a very difficult technical obstacle that is to image nociceptive responses in anesthetized animal. Therefore, the present study aimed to use high resolution microPET with the aid of MRI to investigate the rat brain nociceptive response to formalin stimuli. In order to accurately illustrate the brain nociceptive maps, anesthesia was not applied during the uptake period, thus minimizing the possible confounding which may influence the induced nociception. Compared to the previous small animal nociceptive imaging studies, the glucose metabolism instead of indirect hemodynamic compensation was measured (Morrow et al., 1998; Tuor et al., 2000; Shah et al., 2005; Shih et al., 2008b; Shih et al., 2008e). In addition, the effect of pain-relief drugs, morphine and lidocaine, were examined under formalin induced nociception. The present study establishes a non-invasive glucose metabolism measuring protocol which can be used for illustrating the nociceptive responses in the conscious rat
brain. Moreover, antinociceptive effects reflected to neuronal activation in each cerebral region could be acquired for further investigation.
2.2 Materials and methods
2.2.1 Subjects
Nineteen adult male Wistar rats (8–10 weeks old; weighing approximately 250–300 g;
National Laboratory Animal Center, Taiwan) were used in the present study. The animals were housed in a well-controlled environment with a 12:12-hour light:dark cycle and constant humidity and temperature. Rats were housed in plastic cages at three animals per cage with free access to food and water. All experimental procedures were approved by the Institutional Animal Care and Use Committee, National Taiwan University, College of Medicine.
2.2.2 Imaging experiments
Seven rats were used to produce the formalin-induced nociceptive maps. The 18F-FDG was used as a radiotracer to reveal brain glucose metabolism. Each rat was initially lightly anesthetized using ether, and 0.5 ml of 18F-FDG with an activity of 1.0–1.2 mCi was administered intravenously via the tail lateral vein, after which the rat was returned to its cage in a quiet environment for 45 min uptake in the conscious state. Following the uptake, the rat was lightly anesthetized using 1.5%
isoflurane and fixed in a custom-built stereotaxic head holder by two ear bars and an incisor fixer so as to minimize motion artifacts (Shih et al., 2007). The body temperature was maintained using a warming lamp whose light field was restricted to avoid additional visual stimulation. MicroPET imaging (R4, Concorde Microsystems/Siemens, Knoxville, TN, USA) was performed for 30 min, with the images reconstructed using the MAP algorithm (Qi et al., 1998). After 1 week, 50 µl of 5%
formalin was injected into the left hindpaw prior to 18F-FDG injection. The imaging procedures were identical to those described above.
Another two groups containing six rats each were used to evaluate the effects of lidocaine and morphine. The drugs were given prior to the formalin stimulation, followed by an identical imaging protocol. Rats were intravenously injected with 4 mg/kg lidocaine in one group and 10 mg/kg
morphine in the other group.
MRI anatomical images were captured using a 4.7-T Biospec 47/40 spectrometer to define the brain margin. A 72-mm volume coil was used as the RF transmitter, and a 2-cm quadrature surface coil placed on the head was used as the receiver. A T2-weighted scout image was taken in the mid-sagittal plane to localize the anatomical position by identifying the anterior commissure (bregma –0.8 mm). T2-weighted template images were then acquired using RARE sequence with a repetition time of 4000 ms, echo time of 80 ms, field of view of 2.56 cm, slice thickness of 1.2 mm, number of excitation of 2, and an acquisition matrix of 256×128 (zero-filled to 256×256).
2.2.3 Data analysis
Images were analyzed using PMOD (PMOD Technologies, Adliswil, Switzerland) and a custom-built ISPMER system (Shih et al., 2007). MicroPET images were initially coregistered among the subjects using a mutual-information algorithm and then averaged to generate the incidence images. A pixel value in incidence images represents the averaged percentage injected dose per gram (%ID/g) of an experimental group, where a higher pixel value indicates a greater number of rat responses consistent with the given task (Fig.2-2-1).
The statistical analysis was based on the %ID/g values sampled from different brain structures of each rat. Repeated-measures ANOVAs were used to examine whether formalin stimulation induced metabolic changes in the corresponding brain regions in both hemispheres, with the significance level set at P<0.05. Factorial ANOVAs were used to assess differences in 18F-FDG uptake among the groups with formalin stimulation alone, formalin stimulation with lidocaine
Fig. 2-2-1. 18F-FDG-microPET and T2-weighted MR images were registered and fused with the rat atlas by custom-built ISPMER system. These templates provide anatomical alignment and corresponding ROI. The locations of the three images are (A) bregma +0.7 mm, (B) -1.8 mm, and (C) -7.8 mm.
2.3 Results
2.3.1 Formalin-induced nociceptive maps
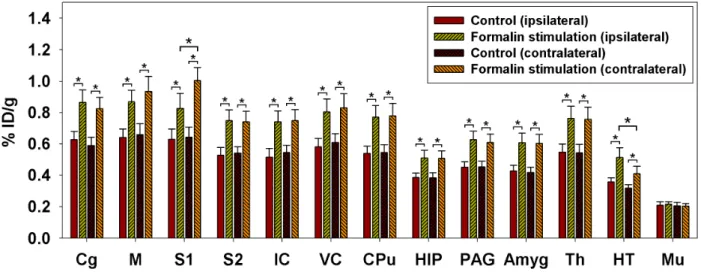
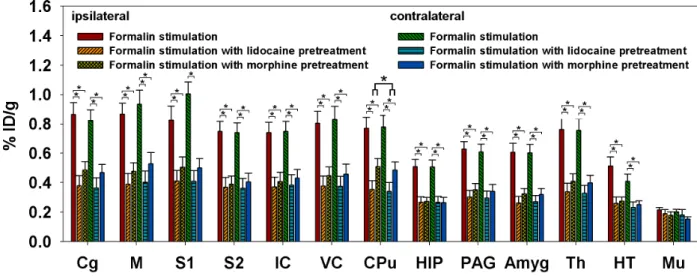
The present study used 18F-FDG microPET to elucidate the nociception-induced glucose metabolic changes in the brains of conscious rats. In order to further improve the accuracy with which anatomical locations were determined, microPET and MRI images were coregistered and fused with a digital atlas of the rat brain (Paxinos and Watson, 1998). This method allowed regions of interest to be selected based on clear spatial references (Fig. 2-3-1). Averaged formalin-induced metabolic maps overlaid on the MRI images are shown in Fig. 2-2-1. The averaged 18F-FDG uptake in the hindlimb area of the S1 (S1HL) was higher on the contralateral side than on the ipsilateral side. Statistical comparisons of the 18F-FDG uptake in the control and formalin groups are shown in Fig. 2-3-2. Repeated-measures ANOVAs with Fisher’s post-hoc tests indicated the presence of significant activations in the bilateral ACC, M, S1, S2, IC, VC, CPu, HIP, PAG, Amyg, Th, and HT, whereas no changes were evident in muscle tissue (Mu). In addition, clear lateralization was only observed in S1 and HT (Fig. 2-3-2).
2.3.2 Antinociceptive effects of lidocaine and morphine
The effects of antinociceptive drugs are shown in Fig. 2-3-3. These reduced the brain 18F-FDG uptake, with no clear lateralized differences evident in the sensory cortices. Factorial ANOVAs with Fisher’s post-hoc tests showed that 18F-FDG uptake in the bilateral ACC, M, S1, S2, IC, VC, CPu, HIP, PAG, Th, Amyg, and HT was lower for pretreatment with lidocaine and morphine than for formalin stimulation alone. Among the measured areas, 18F-FDG uptake in the CPu was higher for morphine treatment than for lidocaine treatment.
Fig. 2-3-1. Incidence 18F-FDG microPET maps overlaid on the MRI images showing the cerebral metabolic changes in three groups of rats, quantified as the averaged %ID/g. (A) Averaged response of seven rats subjected to left hindpaw formalin stimulation alone. (B) Averaged response of six rats subjected to left hindpaw formalin stimulation with lidocaine pretreatment. (C) Averaged response of six rats subjected to left hindpaw formalin stimulation with morphine pretreatment. Clear lateralization is only evident in (A), in which the 18F-FDG uptake is highest in the contralateral S1 and the responsive region match with that of the hindlimb region defined by the rat brain atlas. The image position was 1.8 mm posterior to the bregma.
Fig. 2-3-2. Formalin-induced metabolic increases and cerebral laterality. Repeated-measures ANOVAs with Fisher’s post-hoc tests indicated activations in the bilateral ACC, M, S1, S2, IC, VC, CPu, HIP, PAG, Amyg, Th, and HT. Among the measured areas, clear lateralization was evident in S1 and HT, with 18F-FDG uptake being higher in the contralateral S1 than on the ipsilateral side, and in the ipsilateral HT than on the contralateral side. * denotes P<0.05. Error bars represent SEM values.
Fig. 2-3-3. Effects of lidocaine and morphine pretreatments on formalin-induced metabolic changes.
Pretreatment with lidocaine and morphine reduced 18F-FDG uptake by different amounts. Factorial ANOVAs with Fisher’s post-hoc tests indicated significant decreases in the bilateral ACC, M, S1, S2, IC, VC, CPu, HIP, PAG, Amyg, Th, and HT compared with the groups subjected to formalin stimulation alone. * denotes p<0.05. Error bars represent SEM values.
2.4 Discussion
The present study clearly revealed formalin-induced nociceptive maps, with strong activations evident in the ACC, M, S1, S2, IC, VC, CPu, HIP, PAG, Amyg, Th, and HT. Although functional imaging techniques have been used previously to examine pain-related responses in rodent brains, such as a blood-flow-based autoradiographic method (Morrow et al., 1998) and fMRI (Tuor et al., 2000; Shah et al., 2005; Shih et al., 2008a; Shih et al., 2008d), the method employed in the current study provides new information and methodological improvements for preclinical pain research.
First, our findings complement the previous pain studies in animals by revealing the relative metabolic changes instead of the responses related to blood flow. Second, the 18F-FDG microPET technique provides an opportunity for in vivo, longitudinal follow-up of the response in the same animal, whereas the blood-flow-based autoradiographic method can only be applied once in each animal. Third, fMRI is usually performed under anesthesia, which would alter the representation of behavior-related brain functions and has been reported to strongly influence neuronal activity (Lindauer et al., 1993; Matsumura et al., 2003). Fourth, most fMRI studies in rodents have utilized invasive surgical procedures such as cannulation to control anesthesia, deliver pharmacological compounds, or monitor physiological parameters. Neuronal activation might be affected by the associated surgical pain that would activate the responsive brain region prior to stimulation. In other words, neurovascular coupling around responsive nuclei might already be in a responding state rather than a baseline state due to the surgical wound. These invasive procedures therefore inevitably generate confounding pain reactions. Moreover, if the invasive procedures induce bleeding, the measured hemodynamic responses are very likely to be affected by blood flow changes resulting from the alteration of blood pressure. It is therefore difficult to determine whether
2008a; Shih et al., 2008d). These disadvantages can be overcome by using microPET, which also shows better homogeneity and fewer artifacts near the air–tissue interface.
Among the measured areas, bilateral activations of the IC and VC as well as S1, S2, Th, and ACC in the spinothalmic tract are consistent with fMRI data (Tuor et al., 2000; Malisza et al., 2003;
Shah et al., 2005; Shih et al., 2008a; Shih et al., 2008d). Besides, our results indicate that 18F-FDG microPET shows better delineation of the sensory–motor laterality of formalin-induced nociception than fMRI, since the 18F-FDG uptake was significantly higher in the contralateral S1 than on the ipsilateral side (Figs2-3-2). A possible explanation of this feature is the lack of anesthesia, and the use of a glucose analog rather than hemodynamic compensation, which is less sensitive to the blood-pressure-induced nonspecific activation in fMRI (Tuor et al., 2002). It has also been suggested that the CPu and M are activated by painful stimuli (Chudler et al., 1993; Lorenz et al., 2003; Malisza et al., 2003), with bilateral activation in these areas possibly associated with the representation of mirror pain behavior in animals, where licking of the contralateral untreated paw was observed following unilateral formalin stimulation (Aloisi et al., 1993).
In the subcortical regions, the PAG and HT were also activated, both of which are known to be intimately involved in pain modulation. The PAG is considered a major integration site for nociception signals and a center of analgesic action for opiates that influences the activity of the spinal cord dorsal horn through projections from the ventromedial medulla (Mason, 2005). Previous studies have shown that a nociception signal in the HT can simultaneously excite the central autonomic nervous system, and that the HT might play a complex role in antinociceptive reactions (Pinto-Ribeiro et al., 2008). Our findings suggest that the 18F-FDG uptake was higher in the ispilateral HT than on the contralateral side; however, the underlying mechanism remains obscure.
Increased glucose metabolism in the Amyg during activation has been observed in a rat model of neuropathic pain (Mao et al., 1993). The findings of several studies indicate that the Amyg is associated with unconscious memorization of nociceptive stimuli and involved in emotional
processes and automatic functions (Bingel et al., 2002; Alkire and Nathan, 2005; Neugebauer, 2007). As far as the activity in HIP is concerned, an immunohistochemical study showed that a unilateral injection of formalin induced bilateral c-fos expression in the HIP, suggesting that the HIP is linked by numerous reciprocal neural connections and further implicating that this area is involved in the perception of chronic pain (Aloisi et al., 1997).
In addition to formalin-induced nociception, the present study examined the antinociceptive effects of lidocaine and morphine. In this section, lidocaine is served as positive control of morphine in analgesia. Fig. 2-3-3 shows that pretreatment with lidocaine and morphine resulted in different reductions in 18F-FDG uptake in the measured brain areas, indicating that formalin-induced metabolic changes can be inhibited by these two drugs. Moreover, the inhibition by lidocaine might also result from the blocking effect of voltage-gated sodium channels, thus reducing glucose metabolism globally (Abdi et al., 1998; Gold and Thut, 2001;
Rykaczewska-Czerwinska, 2006), whereas morphine has been widely used for pain alleviation (Yaksh et al., 1988; Franklin et al., 1990; Lamas et al., 1994; Tuor et al., 2000; Shah et al., 2005) and also reportedly induces additional anaesthesia, thus attenuating glucose utilization in widespread brain regions (Cohen et al., 1991; Chudler and Dong, 1995). Although the mechanisms underlying widespread inhibition in the brain are not fully understood, it cannot be ruled out that the down-regulation of global metabolic states is initiated by the brain processing of antinociceptive signals aimed at reducing sensory–motor reactions, and also emotional responses. Furthermore, the differences in the effects of lidocaine and morphine at the used dosages were largest in the CPu, which suggests that this region exhibits higher neuronal activities under morphine regulation. In regard to this unexpected regulation in the CPu, subsequent studies deserve to be continuously
3. Involvement of Opioid Peptides in Negative fMRI Signals
3.1 Introduction
Accumulative evidence suggests that the CPu plays an important role in complex sensory-motor processing as well as nociception (Chudler and Dong, 1995). Our previous microPET study showed that the striatal neuronal activities may be modulated by opioid peptides.
However, the involvement of the CPu in nociception was difficult to be observed in traditional BOLD fMRI studies (Tuor et al., 2000; Lowe et al., 2007). One possibility causing minimal BOLD signals in this region may be vascular inhibition of the local BOLD response such as vasoconstriction effects since the modulation of major neurotransmitters in the CPu is known to mediate vascular activity (Cohen et al., 1996; Cauli et al., 2004; Chen et al., 2005a; Chen et al., 2005b; Dixon et al., 2005; Peppiatt et al., 2006; Gozzi et al., 2007). Of the various neurotransmitters and the corresponding receptors in the CPu that may influence the nociceptive responses, dopamine D2 receptor is previously proposed to be an important target for both the diagnosis and treatment of pain (Hagelberg et al., 2004a). The D2/D3 system are also suggested to strongly alter the neurovascular coupling in the CPu (Choi et al., 2006). However, the opioid and dopamine system are often considered to have reciprocally modulation. Studies also indicated that the stimulation of opioidnergic neuron alters the release of dopamine in the CPu, consequentially affecting the binding of dopamine receptors. Thus, the present study aimed to use graded electrical stimulation and CBV-weighted fMRI technique to explore the underlying mechanisms of the pain-induced neurovascular coupling in the CPu. The findings will be important in revealing the missing role of the CPu in neurohemodynamics modulation under nociceptive stimuli.
3.2 Material and methods
3.2.1 Subjects
A total of 52 adult male Wistar rats (8–10 weeks old; weighing approximately 250–300 g;
National Laboratory Animal Center, Taiwan) were used in the present study. The animals were housed in a well-controlled environment with a 12:12-h light–dark cycle and controlled humidity and temperature. Rats were triple-housed in plastic cages with free access to food and water. All experimental procedures were approved by the Institute of Animal Care and Utilization Committee at Academia Sinica, Taipei, Taiwan.
3.2.2 fMRI experiments: animal preparation
On the experiment day, each rat was initially anesthetized with 3% isoflurane. A PE-50 catheter was inserted into the right femoral vein for administering anesthetic and the contrast agent.
Alpha-chloralose (70 mg/kg) prepared by dissolving in 0.9% saline and 10% polyethylene glycol was then administered for subsequent anesthesia. The femoral artery was also catheterized to monitor the arterial blood gas parameters (OPTI CCA Blood Gas Analyzer, Osmetech, Roswell, GA, USA) and the arterial blood pressure (IX-214, iWorx, Dover, NH, USA). The rats were allowed to breathe spontaneously on their own so as to avoid the possible influence of tracheotomy on brain nociceptive processing; this also kept the physiological autoregulation intact whilst studying nociception without external intervention (Liu et al., 2004; Lowe et al., 2007; Shih et al., 2008a; Shih et al., 2008d). The rat was fixed in a customized head holder by two ear bars and an incisor fixer. The body temperature was maintained at 37°C using a warm-water blanket, and the
was higher than 110 mmHg. The mean arterial blood pressure before stimulation was 115–125 mmHg, and this increased during electrical stimulation by 5–25 mmHg; such changes are lower than the threshold for inducing nonspecific activation (Tuor et al., 2002). For the CBV-weighted fMRI study, superparamagnetic iron oxide nanoparticles (SPIO; Resovist, Schering, Berlin, Germany) were administered intravenously to the rat at a dose of 30 mg Fe/kg as a contrast agent.
SPIO nanoparticles are known to have a long blood half-life, of 2.4–3.6 h.
Electrical stimulation was then applied to the rat forepaw. Two needle electrodes were inserted under the skin of the right forepaw: one between the first and second digits and the other between the third and fourth digits. These electrodes were then fixed with surgical tape and the stimulation was confirmed by observing digit twitching. Image acquisition commenced once the rat had been conditioned as described above. Electrical stimulation with a 3-Hz square wave and a 0.5-ms pulse duration was applied to the rats by a constant-voltage stimulator (Digitimer, Welwyn Garden City, UK) or a constant-current stimulator (AM system, model 2100, Carlsburg, WA, USA), with trials separated by at least 10 min to avoid adaptation. The 60-V and the current level at about 10 mA was known to activate Aδ and C-fibers and induce nociception (Tuor et al., 2000; Chang and Shyu, 2001; Liu et al., 2004; Zhao et al., 2008b).
3.2.3 fMRI experiments: pharmacological MRI
A dopamine D2/D3 receptor antagonist, eticlopride (Sigma-Aldrich, St Louis, MO, USA), was first used to study nociception-induced vasoconstriction (as described in 3.3.1) since previous studies have demonstrated that injection of D2/D3 receptor agonist causes CBV decreases (Choi et al., 2006) whereas injection of D2/D3 receptor antagonist increases the amphetamine-induced CBV increases (Chen et al., 2005). Five rats received 60-V right forepaw stimulation followed by CBV-weighted fMRI. Eticlopride was then administered intravenously at 1 mg/kg. After allowing
performed with the same stimulation parameters described above. In the following experiments, morphine was used to activate MOR and test for the involvement of the opioid systems in the observed vasoconstriction. Five rats received 10-mA right forepaw stimulation followed by CBV-weighted fMRI. Morphine at 5 mg/kg was then intravenously administered and identical imaging protocols were performed with the same stimulation parameters. After 30 min of morphine treatment, naloxone at 0.7 mg/kg was intravenously given to antagonize the residual effect of morphine. In the last trial of the experiment, five rats received 10-mA right forepaw stimulation followed by CBV-weighted fMRI. First, morphine at 5 mg/kg was intravenously administered.
Following 10 min of morphine treatment, eticlopride at 1 mg/kg was then administered intravenously to examine the blockage of D2/D3 receptors. Identical imaging protocols were performed with the same stimulation parameters. Also, the resting CBV signal alteration was all documented following each drug administration.
3.2.4 fMRI experiments: data acquisition
For fMRI experiments, images were captured using a 4.7-T Bruker Biospec 47/40 spectrometer with a 72-mm volume coil used as the RF transmitter and a quadrature surface coil placed on the head as the receiver. A T2-weighted pilot image was taken in the axial and mid-sagittal plane to localize the anatomical position by identifying the anterior commissure (bregma –0.8 mm). Since the rat head was fixed firmly to the stereotaxic frame with two ear bars in an identified interaural line through the external auditory meatus, the image appeared to be horizontal. If rotation occurred, the stereotaxic frame in the magnetic bore was adjusted to correct the angle until the scanned image showed no rotation. After localization, 3 slices with a FLASH
9.6 s. The centers of the three slices were located at the bregma +0.7 mm, –0.8 mm, and –2.3 mm.
An off–on–off paradigm was used to detect the responses to electrical stimulation, with the first and last 20 frames categorized as baseline, and the middle 20 frames collected during stimulation.
3.2.5 fMRI experiments: data analysis
Images were analyzed using a custom-built image processing interface (Shih et al., 2007; Shih et al., 2008c; Shih et al., 2008d; Shih et al., 2008f). Correlation coefficient (CC) analysis was performed on a pixel-by-pixel basis to correlate MR signal changes and electrical stimulation. Each time course was calculated with an off–on–off paradigm to generate the correlation maps. These maps were then spatially transformed into a rat-atlas reference domain to obtain the averaged CC images by spatial averaging. The averaged CC images presented here represent the averaged correlation maps of an experimental group, in which higher and lower pixel values indicate larger and smaller numbers of rat responses consistent with the stimulation, corresponding to CBV decreases and increases, respectively.
The number of pixels with signal changes that differed significantly from the baseline values was quantified. The signals were compared between before (time frames 1–20) and during (time frames 21–40) electrical stimulation using two-tailed paired t-tests, with P< 0.05 considered indicative of a responsive pixel. The ∆R2* values were defined as
pre stim
S S R * TE1 ln
2 =−
∆
where Spre and Sstim are the signal intensity before and during stimulation, respectively.
The ROI selection was consistent with a rat brain atlas (Paxinos and Watson, 1998) and the image located at thebregma +0.7 mm was selected for analysis since both the response of the S1 and the striatum can be clearly demonstrated in this section. A repeated-measures ANOVA was
used to compare changes in responsive area or ∆R2* values. Homogeneity of the variances was assessed by Levene’s test, where the samples with equal variances were followed by Fisher’s or Bonferroni post-hoc, whereas unequal variances were followed by Games-Howell post-hoc analysis, respectively. The significance level was set at P < 0.05.
3.2.6 Histological experiments: Fos immunohistochemistry of the CPu
Fos immunostaining was applied to brain tissues from the 60-V, control, and formalin groups as described above. Fos expression in the CPu was determined by the summed number of Fos-ir cells from three axial sections (bregma +0.7 mm, –0.8 mm, and –2.3 mm), which covered the CPu from rostral to caudal. The statistical analysis method was similar to that used to quantify spinal Fos.
Seven rats prepared in the same way were used for the electrophysiological experiment. The rats were implanted stereotaxically with pairs of eight microwire electrode arrays (no. 15140/13848, 50 µm in diameter; California Fine Wire, USA) in the bilateral CPu (Fig. 3-3-4C). The coordinates used were 0.7 mm anterior to the bregma, ±2.5 mm lateral to the midline, and 4.5–5.2 mm below the cortical surface (Paxinos and Watson, 1998). The recording protocol involved 50 s of rest alternated with 50 s of electrical stimulation (60-V, 3-Hz square wave of 0.5-ms duration).
Neuronal activity was recorded using a 16-channel multichannel neuronal acquisition processor (Plexon, Dallas, TX, USA). The electrophysiological signals from the headset were fed to an amplifier and band-pass filtered (spike preamp filter: 0.45–5.00 kHz, gain: 15,000–20,000). Neural ensemble data were analyzed using NeuroEXplorer (Nex Technologies, Littleton, MA, USA), and
the location of the implanted electrodes.
3.2.7 Electrophysiological recording*
Seven rats prepared in the same way were used for the electrophysiological experiment. The rats were implanted stereotaxically with pairs of eight microwire electrode arrays (no. 15140/13848, 50 µm in diameter; California Fine Wire, USA) in the bilateral CPu (Fig. 3-3-4C). The coordinates used were 0.7 mm anterior to the bregma, ±2.5 mm lateral to the midline, and 4.5–5.2 mm below the cortical surface (Paxinos and Watson, 1998). The recording protocol involved 50 s of rest alternated with 50 s of electrical stimulation (60-V, 3-Hz square wave of 0.5-ms duration).
Neuronal activity was recorded using a 16-channel multichannel neuronal acquisition processor (Plexon, Dallas, TX, USA). The electrophysiological signals from the headset were fed to an amplifier and band-pass filtered (spike preamp filter: 0.45–5.00 kHz, gain: 15,000–20,000). Neural ensemble data were analyzed using NeuroEXplorer (Nex Technologies, Littleton, MA, USA), and the two-tailed paired t-test was used to examine the change in firing rate in the CPu between before and during stimulation. After recording, the animals were perfused with 4% paraformaldehyde, and then debrained. The brain tissues sectioned at 50 µm were stained with 0.1 % cresyl violet to verify the location of the implanted electrodes.
* The experiment of electrophysiological recording was conducted by Dr. You-Yin Chen.
3.3 Results
3.3.1 CBV changes during graded electrical stimulation
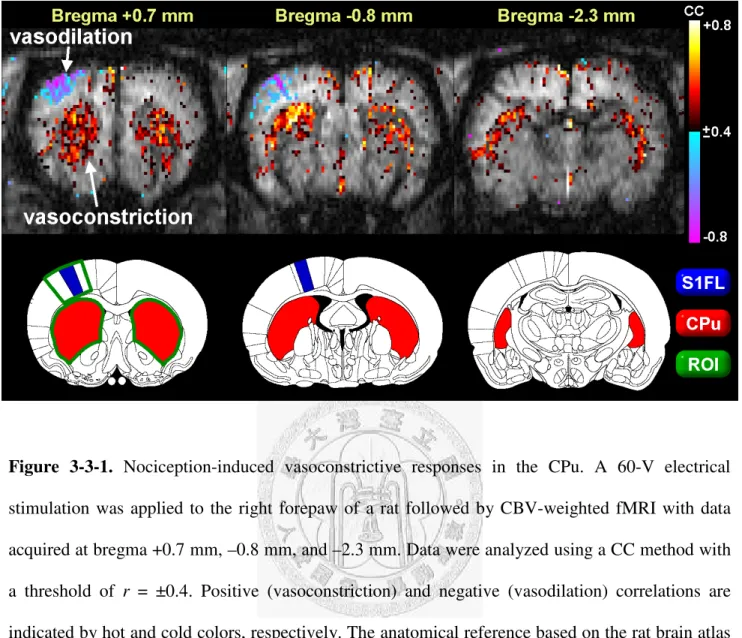
CBV changes in the CPu in response to electrical stimulation were assessed by CBV-weighted fMRI. Fig. 3-3-1 shows the results following CC analysis for 60-V stimulation to the right forepaw.
Three axial T2*
-weighted images at bregma +0.7 mm, –0.8 mm, and –2.3 mm were dynamically acquired to identify changes in CBV. The color-coded regions in Fig. 3-3-1 correspond to areas with CBV changes whose activation patterns were positively or negatively correlated with the off–on–off stimulus paradigm, where positive and negative correlations are associated with vasoconstriction and vasodilation, respectively. The figure indicates that electrical stimulation induced intense vasoconstriction mainly in the CPu across the three slices, which was accompanied by vasodilation in the contralateral forelimb area of primary somatosensory cortex (S1FL).
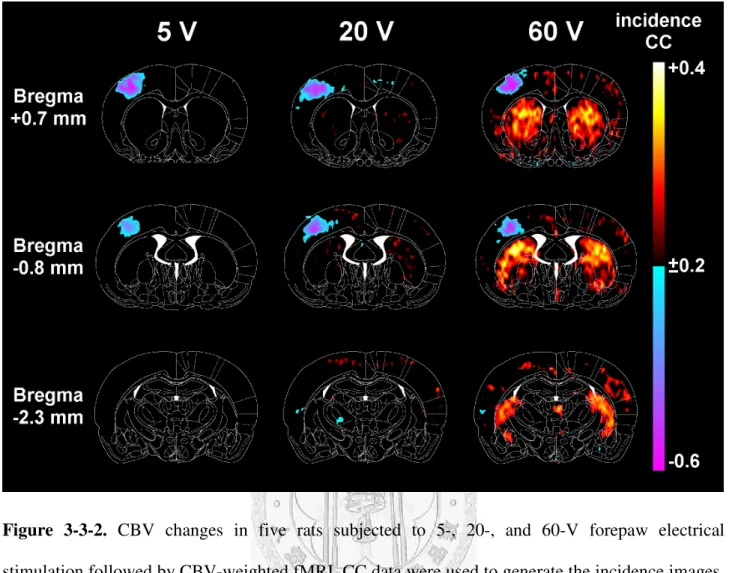
Fig. 3-3-2 presents the CC of the five cases averaged on a pixel-by-pixel basis and color-coded, which shows that the vasodilation response was induced in the S1FL region for all the stimulation intensities. However, the CPu exhibited differing degrees of vasoconstriction that became more widespread with increasing stimulation intensity. Fig. 3-3-3A illustrates the signal-to-time curves of the S1FL and the CPu over the 60 time points (corresponding to an imaging period of about 9.6 min) at each of the graded intensities. The curves indicated that the MR signals in the CPu increased immediately during electrical stimulation, reaching a plateau within 1 min, and staying elevated for the remaining stimulation period. The changes in MR signal intensity at the plateau (defined as the averaged signal values over a 2-min period beginning 1 min after stimulus initiation) in the contralateral S1FL for stimulation at 5, 20, and 60 V were –24.86±1.74%, –27.69±3.34%,
changes from baseline as detected by two-tailed paired t-tests with a significance level of P < 0.05.
Note that correlation and incidence maps provide mapping of responses incident to the stimulation, while the quantification of responsive pixels indicates the level of significant signal changes induced by the stimulation. Referring to Fig. 4B, repeated-measures ANOVA (n = 5) indicated that electrical stimulation intensities affect the degree of striatal vasoconstriction (F2,8 = 86.548, P <
0.0001) despite the absence of differences between the two hemispheres (all P > 0.05). Fisher’s post-hoc tests revealed that the number of vasoconstrictive pixels in the CPu for forepaw stimulation was larger at 60 V than at 5 V (P < 0.0001) and 20 V (P < 0.0001), and larger at 20 V than at 5 V (P < 0.01). Fig. 4C shows that the number of vasodilative pixels in the S1FL was lower for 60-V stimulation than for 5-V stimulation (P < 0.05).
3.3.2 Neural activity of the CPu induced by nociceptive electrical stimulation
Fos immunohistochemistry and neural recording were used to identify whether the vasoconstriction in the CPu was associated with changes in neuronal activity. Photomicrographs of Fos expression in the CPu for the control, formalin, and 60-V groups are shown in Fig. 3-3-4A. A two-way ANOVA (n = 15) showed that the treatment exerted a main effect on the amount of Fos expression in the CPu (F2,19 = 33.884, P < 0.0001). Fisher’s post-hoc tests revealed that the level of Fos expression was higher in the 60-V group than in the control (P < 0.0001) and formalin (P <
0.0001) groups, and higher in the formalin than in the control group (P < 0.05) (Fig. 3-3-4B). The Fos expression did not differ between the ipsilateral and contralateral CPu (all P > 0.05).
Neural electrophysiological signals were assessed as a second measure of the neural activity in the CPu induced by noxious electrical stimulation (n = 7). The recording sites are shown in Fig.
3-3-4C. Traces recorded in the two hemispheres of the CPu are depicted in Fig. 3-3-4D. Consistent with the Fos results, excitatory responses (corresponding to increased firing rates in spikes per
t-tests revealed that the averaged firing rate in the CPu was considerably higher than the baseline for
60-V electrical stimulation (P < 0.00001), and that the responses did not differ between the two hemispheres (Fig. 3-3-4E). Both the Fos immunohistochemistry and electrophysiological recordings indicated that the 60-V stimulation leading to vasoconstriction in the CPu was associated with significantly higher neuronal activity in the region.
3.3.3 Effects of dopamine D2/D3 antagonist on striatal vasoconstriction
Dopamine D2/D3 receptors crucially affect vasoconstriction in the CPu. Consequently, a dopamine D2/D3 receptor antagonist, eticlopride, was used to investigate the possible role of dopamine D2/D3 receptors in modulating striatal vascular responses to noxious electrical stimulation.
Identical imaging procedures were applied to five rats, with 60-V forepaw stimulation applied before and after the intravenous administration of 1 mg/kg eticlopride (Fig. 3-3-5A). Fig. 3-3-5B clearly illustrates the blocking effects of eticlopride. Two-tailed paired t-tests indicated that the administration of eticlopride significantly decreased the number of responsive pixels showing vasoconstriction in the bilateral CPu (P < 0.05), but had no significant effect in the contralateral S1FL. In addition, the use of saline as a vehicle control induced no observable changes (data not presented). These results suggest that dopamine D2/D3 receptors are important mediators of vasoconstriction in the CPu induced by noxious electrical stimulation.
3.3.4 The lesion of the substantia nigra (SN) with 6-hydroxydopamine (6-OHDA) diminishes the striatal vasoconstriction*
the right striatum, with some residual reactions. By contrast, the CBV responses were preserved in the left striatum.
* The SN lesion animal models were conducted by Dr. Chiao-Chin Chen and et al.
3.3.5 Effects of morphine on striatal vasoconstriction
Stimulation of the unilateral forepaw elicited vasodilation in the contralateral primary somatosensory cortex (cS1), and meanwhile, yielded salient bilateral vasoconstriction in the striatum, where preinjection of saline as a vehicle control induced no observable changes in CBV responses. Morphine (5 mg/kg, i.v.) was then used to activate µ-opioid receptors. Pretreatment of morphine caused profound reduction of CBV in both cortical and striatal areas during forepaw stimulation (Fig.3-3-7a). Repeated-measures one-way ANOVA (n = 5) with Bonferroni or Games-Howell post-hoc indicated that the vasoconstrictive area was larger after morphine treatment in the striatum (P < 0.05). The degree of vasoconstriction was also enhanced in the striatum (P <
0.05) and the ipsilateral primary somatosensory cortex (iS1) (P < 0.01). In addition, the vasodilation in the cS1 was reduced after morphine treatment (P < 0.05) (Fig.3-3-7b). The effect of morphine was gradually decreased over time and then the CBV-weighted images reached to a pattern similar to that of the control response at 30 min. A significant main effect of time on the morphine-enhanced striatal negative fMRI signals was observed in both responsive area (F2,12 = 7.332, P < 0.01) and the degree of CBV changes (F2,12 = 4.968, P < 0.05).
After 30 min of morphine treatment, naloxone was given to antagonize the residual effect of morphine. Compared with the response after 30 min of morphine treatment, the striatal vasoconstriction was reduced after administration of naloxone in both the responsive area (P < 0.05) and intensity (P < 0.01). The increase of vasodilative area in the cS1 and ∆R2*
(CBV changes) in the bilateral S1 were also significant (all P < 0.01). Naloxone not only reversed the residual
morphine effect, but predominantly eliminated the entire vasoconstrictive responses and led to vasodilation in multiple brain regions (all at least P < 0.05 compared with control, except ∆R2*
in the iS1). The CBV responses in the CPu and the iS1 were reversed from decreases to slight increases; meanwhile, the vasodilation was also heightened in the cS1 (P < 0.05) after µ-opioid receptor antagonism (Fig.3-3-7).
3.3.6 The interaction of MOR and D2/D3systems on striatal vasoconstriction
Identical imaging procedures with 10 mA forepaw stimulation were applied to another group of rats (n = 5) and a dopamine D2/D3 receptor antagonist, eticlopride (1 mg/kg, i.v.), was given after 10 min of morphine (5 mg/kg, i.v.) treatment. Clear blocking effect of eticlopride was observed (Fig.3-3-8). Pretreatment of eticlopride reduced morphine-enhanced striatal vasoconstriction in both the responsive area (P < 0.01) and intensity (P < 0.05). The degree of vasoconstriction in the iS1 was also reduced (P < 0.05). Compared with the control, the degree of vasodilation was decreased in cS1 and the vasoconstrictive area in the striatum was smaller (P < 0.05) after eticlopride treatment (Fig.3-3-8b).
Figure 3-3-1. Nociception-induced vasoconstrictive responses in the CPu. A 60-V electrical stimulation was applied to the right forepaw of a rat followed by CBV-weighted fMRI with data acquired at bregma +0.7 mm, –0.8 mm, and –2.3 mm. Data were analyzed using a CC method with a threshold of r = ±0.4. Positive (vasoconstriction) and negative (vasodilation) correlations are indicated by hot and cold colors, respectively. The anatomical reference based on the rat brain atlas and the corresponding ROI positions for subsequent analysis are shown in the lower row. Clear vasodilation was evident in the contralateral S1FL, whereas strong vasoconstrictive responses were evident in the bilateral CPu.
Figure 3-3-2. CBV changes in five rats subjected to 5-, 20-, and 60-V forepaw electrical stimulation followed by CBV-weighted fMRI. CC data were used to generate the incidence images.
The rat brain atlas was used as a template for spatial normalization, and the correlation maps of each rat were then averaged on a pixel-by-pixel basis to display the incidence responses, where higher and lower pixel values indicate more rats showing decreases and increases in regional CBV, respectively. These images show that the CPu did not respond to 5-V forepaw electrical stimulation, but that the degree of constriction increased for higher stimulation intensities.
Figure 3-3-3. MR signal changes and the number of responsive pixels during graded electrical stimulation. (A) The signal-to-time curves were computed from the MR signals in the CPu and S1FL, averaged across five rats, and expressed as percentages relative to baseline values. The yellow shaded regions indicate stimulus epochs. The 60-V stimulation induced the highest MR signal increase in the CPu, which can be correlated with the vasoconstriction, whereas the contralateral S1FL showed vasodilation. (B) The number of pixels with significant MR signal increases (P < 0.05) was quantified in the CPu of both hemispheres. No difference was found between the ipsilateral and contralateral CPu for all stimulation intensities. The 60-V stimulation induced the largest number of vasoconstrictive pixels, followed by 20 and 5 V. (C) The number of pixels with significant MR signal decreases was quantified in the contralateral S1FL. The activation area was significantly smaller for 60-V stimulation than for 5-V stimulation. *, **, and ****
indicate significance levels of P < 0.05, P < 0.01, and P < 0.0001, respectively. Error bars represent s.e.m. values.
Figure 3-3-4. Striatal neuronal activity was investigated by Fos immunohistochemistry and electrophysiological recording in response to noxious electrical stimulation that produced vasoconstriction in the region. (A) Photomicrographs (top) of Fos-ir cells and macro schematic drawings (bottom) of Fos-ir cell distribution from each treatment group. Arrowheads indicate Fos-ir cells. (B) Stimulation at 60 V induced the highest level of Fos expression, followed by formalin and control. (C) Recording electrodes implanted into the ipsilateral and contralateral CPu shown in a Nissl stained brain slice. The tips of the electrodes are indicated by white arrows. (D) Traces of neural activity in the ipsilateral and contralateral CPu before and during electrical stimulation at 60 V. The duration of the stimulus is indicated by the black bar. (E) The firing rate was significantly higher during stimulation than at the baseline. Both Fos immunohistochemistry and
Figure 3-3-5. Effects of eticlopride, a dopamine D2/D3 receptor antagonist, on striatal vasoconstriction. (A) Five rats received 60-V forepaw electrical stimulation followed by CBV-weighted fMRI at bregma +0.7 mm. CC data were used to generate the incidence maps, which show that vasoconstriction in the bilateral CPu could be blocked by the intravenous injection of 1 mg/kg eticlopride. (B) Two-tailed paired t-tests indicate that eticlopride significantly reduced the number of vasoconstrictive pixels in the CPu, but had no effect in the S1FL. * indicates a significance level of P < 0.05. Error bars represent s.e.m. values.
Figure 3-3-6. Nociception elicits CBV responses in the intact striatum, but not in the lesioned side.
The majority of the CBV response was found in the intact striatum of the SN-lesioned rats whereas merely scattering reactions were seen in the lesioned side.