Yue-Hsing Huang, Chih-Hsin Chung, Meng-Ling Wu, Cheng-Jung Lin
【 Summary】
This study examined transverse stress wave tomographies and wood density (D) profiles of a royal palm (Roystonea regis) tree trunk at different heights. Moreover, effects of different moisture contents (MCs of 60~270%) on the transverse stress wave velocity (V) during desorption were investigated. Results showed that the highest V and D values on the tree trunk were both located in the peripheral region at 2 m above the ground, while the lowest V and D values on the tree trunk were found in the inner region at 5~6 m above the ground. Corresponding radial V values of the undamaged disc cross-section from the peripheral region to the inner region showed a symmetrical layered structure. Visual inspection of disc cross-section revealed a larger thickness and ratio of the peripheral region in the tree trunk at the tree base. The relationship between the D (at about 12%
MC) and V (green) can be expressed by a second-order polynomial regression (R
2= 0.82, p < 0.01).
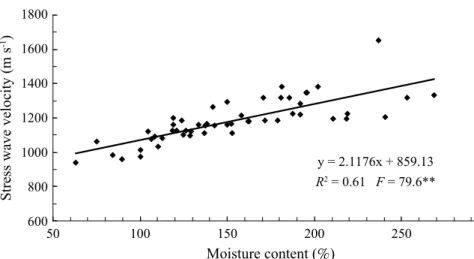
The V was significantly (R
2= 0.61, p < 0.01) affected by the MC and tended to increase with an in- creasing MC. When making an acoustic inspection, it is necessary to adjust the V of standing trees with different MCs for comparison purposes and to achieve higher accuracy, which would in turn yield more-accurate tree inspection assessments.
Key words: evaluation of hazardous trees, tomogram, stress wave, tree risk assessment, wood den- sity profile.
Huang YH, Chung CH, Wu ML, Lin CJ. 2013. Stress wave tomogram and wood density profile in a royal palm tree: a case study. Taiwan J For Sci 28(3):129-44.
1)Director General, Taiwan Forestry Research Institute, 53 Nanhai Rd., Taipei 10066, Taiwan. 林業 試驗所所長室,10066台北市南海路53號。
2)Department of Forest Management, Taiwan Forestry Research Institute, 53 Nanhai Rd., Taipei 10066, Taiwan. 林業試驗所森林經營組,10066台北市南海路53號。
3)Department of Forest Protection, Taiwan Forestry Research Institute, 53 Nanhai Rd., Taipei 10066, Taiwan. 林業試驗所森林保護組,10066台北市南海路53號。
4)Department of Forest Utilization, Taiwan Forestry Research Institute, 53 Nanhai Rd., Taipei 10066, Taiwan. 林業試驗所森林利用組,10066台北市南海路53號。
5)Corresponding author, e-mail:d88625002@yahoo.com.tw 通訊作者。
Received May 2013, Accepted August 2013. 2013年5月送審 2013年8月通過。
研究報告
大王椰子的應力波斷層影像及木材密度圖譜檢測之 案例報告
黃裕星
1)鍾智昕
2)吳孟玲
3)林振榮
4,5)摘 要
本研究檢測大王椰子樹在不同高度的樹幹應力波斷層影像及木材密度(D)圖譜,並調查水分在脫濕 過程中不同含水率(MC = 60~270%)對橫向應力波速度(V)的影響。結果發現樹幹橫斷面中,最高V及 D是位於外圍周邊區域(外殼厚度)及樹高2公尺位置,最低V及D是位於中央區域及樹高5~6公尺位置。
未損壞樹幹橫斷面從外殼區域到中央區域的相對應橫向V圖譜,在橫斷面上形成一個對稱的層狀結構
圖。目視檢查發現樹木基部之樹幹橫斷面有較大的外殼厚度及比例。D(MC約12%)與V(生材狀況)之間 的關係可用一元二次複迴歸表達(決定係數,R2 = 0.82, p < 0.01)。實際檢測樹幹橫斷面時,MC愈高時 V愈高,MC顯著的影響V值(R2 = 0.61, p < 0.01)。因此,當在現場檢測大王椰子立木時,可以依據不同 的MC來調整獲得更精確的橫向V值。
關鍵詞:危險樹木評估、斷層影像、應力波、樹木風險評估、木材密度圖譜。
黃裕星、鍾智昕、吳孟玲、林振榮。2013。大王椰子的應力波斷層影像及木材密度圖譜檢測之案例報 告。台灣林業科學28(3):129-44。
INTRODUCTION
In Taiwan, regular inspection of royal palm trees (Roystonea regia) is imperative for maintaining in situ structural safety and ensuring public safety (Lin et al. 2011). Tree risk inspections provide a systematic method of examining trees, assessing defects present, and estimating the degree of risk that trees pose to public safety (Pokorny 1992). Ar- borists evaluate individual trees, assess their hazard potential, and recommend appropri- ate actions for tree hazard management. The current literature contains methods of decay detection in standing trees, risk assessment guidelines for defective trees, and tree hazard evaluation forms (Matheny and Clark 1994, Harris et al. 2004, Lilly 2010).
Most experts agree that 30~35% of sound wood in the remaining wall (shell) is a
threshold that requires action to be taken; and there are guidelines on the minimum thick- ness of sound wood (shell) surrounding de- caying trunks with and without cavity open- ings to ensure safety (Hayes 2007). However, criteria that apply to hardwood and softwood trees may be not applicable to royal palms due to differences in their structure and func- tion.
Different acoustic nondestructive evalu-
ations (NDEs) were proven to be effective in
detecting and estimating deterioration in tree
trunks (Mattheck and Bethge 1993, Bethge
et al. 1996, Yamamoto et al. 1998, Divos and
Szalai 2002, Pellerin and Ross 2002, Lin et
al. 2008, 2011). However, drawbacks of these
methods are that the correlation between non-
destructive and destructive parameters may
ties (Kasal 2003). Wood density (D) is an important indicator of strength and is gener- ally regarded as the most important property of a wood. Owing to its strong relationships with other strength properties, D is often the parameter assessed in wood evaluations. The acoustic wave method is a useful inspection technique for estimating the physical strength properties of wood-based timbers. However, when applied to living trees, the acoustic ve- locity is significantly affected by the moisture content (MC) of the wood. Many researchers have determined that the velocity of an acous- tic wave varies with the MC of the wood (Sandoz 1993, Bucur 1995, Wang et al. 2002, 2003, Chan 2007). The velocity of an acous- tic wave increases linearly from about satu- ration to the fiber saturation point (FSP) in longitudinal specimens; it is almost constant in radial specimens; and it decreases linearly in tangential specimens (Wang et al. 2002).
However, the effects of different MCs on the transverse stress wave velocity (V) above the FSP in living royal palm trees remain un- known.
In this study, we investigated V tomogra- phies and D profiles in a royal palm tree trunk at different heights. Moreover, the effects of the MC on V during desorption from high MC (270%) to low MC (60%) conditions were ex- amined. The operator must first determine the standardized function between V and MC that should be expected for undamaged wood for a given tree species. Results obtained in this study can facilitate the application of acoustic investigation equipment to risk assessment of royal palm trees to help ensure public sa- fety.
ferent heights, and the effects of different MCs on the transverse V during desorption.
A royal palm tree of 25~30 yr old was se- lected and felled on March 20, 2012. Then, ten 8-cm-thick undamaged discs were cut from its trunk at 0, 1, 2, 3, 4, 5, 6, 7, 8, and 9 m above ground level for V 2D imaging and D profile experiments. Another 4 undamaged discs of the same thickness were randomly cut from the trunk at different heights above the ground level to explore effects of different MCs on the transverse V. All 14 discs were immediately transported to the Taiwan For- estry Research Institute in Taipei, Taiwan for further investigation.
Acoustic 2D tomography was conducted using a Fakopp 2D Microsecond Timer (Fa- kopp Enterprise, Agfalva, Hungary). Multiple stress-wave measurements (8 probes) were made on the first 10 discs at 8 equidistant points. Sensors were installed on the discs, and a transducer was connected at an angle of 90° to the trunk axis to detect the propagat- ing stress wave velocity. Measurements were repeated for all other positions of the trans- mitter probe, allowing for 28 (for a full round trip; 7 receiving probes x 8 transmitter probes
÷ 2 same paths) independent propagation time measurements for each investigated section.
A complete data matrix was obtained through this measurement process for each test disc (Fig. 1).
The weight of the disc was measured immediately after the stress wave inspection.
The green MC was calculated using the fol- lowing formula:
MC (%) = [(Wg – Wo) / Wo]×100; (1)
where Wg is the green weight (g) and Wo is
the oven-dry weight (g).
A diametrical strip about 20 mm wide (from the dense peripheral region to the less- dense inner region of the tree trunk) was sawn from each disk in the same direction (east-west). A thin slice (2×20 mm, virtual longitudinal×tangential) for x-ray scanning was cut from each strip (Fig. 2). All sampled strips were conditioned at an MC of 12% to calculate the wood D profile.
D profiles of the conditioned slices were determined using a direct-reading x-ray den- sitometer (QTRS-01X Tree Ring Analyzer;
Quintek Measurement Systems (QMS), Knoxville, TN, USA). The determination
of density was based on the relationship of x-ray attenuation and density (QMS 1999).
Specimens were conditioned in a controlled environment room at 20℃ and 65% relative humidity (D profile at about an MC of 12%).
Each slice was scanned and moved through the x-ray machine in the radial direction. A standard collimator supplied with the tree ring analyzer yielded an approximate width of 0.038 mm and a height of 1.59 mm at the de- tector. The sample step size could be adjusted at 0.02-mm increments. With the QTRS-01X scanning system, the wood density can be de- termined according to the x-ray attenuation. A positive relationship exists between the wood Fig. 1. Sensor arrangement, path of transverse stress wave measurements, and 2D tomo- gram of the experimental procedure (from A to D).
(A) Acoustic image test using multi-channel stress wave (8 probes).
(B) Constructed 2D image (yellow-green-red).
(C) Conversion of the 2D image (B) into 256 gray shades.
(D) Corresponding transverse acoustic velocity calculated for every grid square.
(A) (B)
(C) (D)
density and x-ray attenuation; that is, the higher the wood density, the larger the x-ray attenuation, and vice versa (QMS 1999).
To study the effects of the MC on V dur- ing desorption, the remaining 4 undamaged discs cut randomly at different heights were first immersed in water for more than 3 wk until they reached a near-saturation MC of 270%. Then, they were removed for acoustic 2D tomographic inspection using the stress wave method described above. In brief, a stress wave was propagated through the disc, and MC levels at which weight loss of about 100~200 g occurred were recorded until the MC reached 60%. The MC was calculated us- ing formula (1).
For each disc, the circumference and distances between sensors were obtained us- ing a tape measure. The measurements served as inputs to the system software to map the approximate geometric form of the cross- sections. With the acoustic measurements obtained, a tomogram (2D image) was con- structed for each cross-section using Fakopp ArborSonic software. To quantitatively assess the tomograms, all corresponding stress wave velocity values at each pixel were further calculated by visualizing and converting the tomogram (Fig. 1), and stress wave velocity maps of the cross-sections were obtained for further analysis.
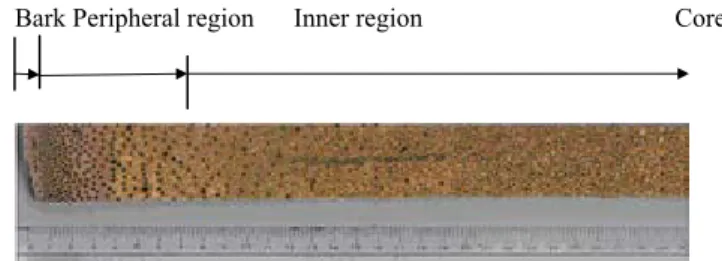
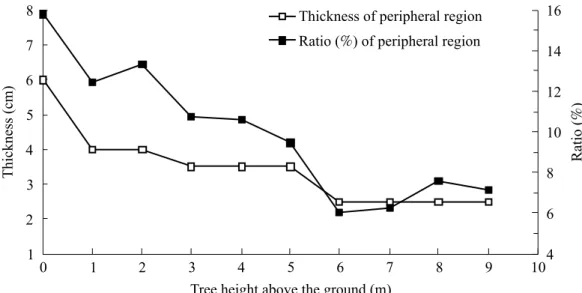
In this study, a cross-section in the radial position was divided by visual observation into 2 regions according to obvious vascular
bundles and color change (actual position for comparing the wood density profile), namely, a dense peripheral region (from the bark in- ward to about 25~50 mm distance from bark) and a less-dense inner region (from about 25~50 mm distance from bark to the inner trunk region), as shown in Fig. 3.
The 2D image was built according to transverse V values of different detection paths. Moreover, all corresponding V values at each pixel were further calculated by im- age analysis, and a V grip map of the cross- sections was obtained for the V profile ac- cording to the smoothing spline method. The correlation coefficient (R
2, determination co- efficient) of the relationship between factors x Fig. 2. X-ray scanning specimen in the radial direction.
Fig. 3. Cross-section of a royal palm tree
trunk.
and y was calculated by a Pearson correlation analysis (at a significance level of α = 0.05).
RESULTS
Trunk diameter and green MC
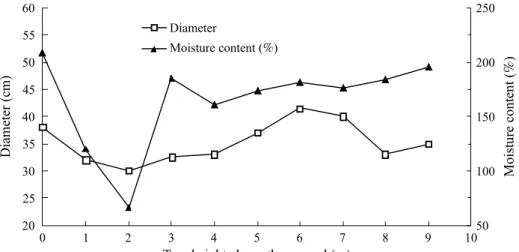
Figure 4 shows variations in the trunk diameter and MC at different tree heights. As can be seen, the trunk diameter first decreased from ground level (0 m) to a minimum of 30 cm at 2 m, increased thereafter to a maximum of 41.5 cm at 6 m above ground, and then de- clined again. With such inconsistent fluctua- tions, the palm trunk was neither cylindrical nor tapering toward the tree top.
As for the MC, a significant drop was observed from a maximum of 208.7% at ground level to a minimum of 67.0% at 2 m above ground. Thereafter, the MC rose signif- icantly to 185.3% at 3 m above ground, fol- lowed by fluctuations of a smaller magnitude.
The average MC of 10 discs in the palm tree was 165.4%.
Variations in V and D from the bark to the core
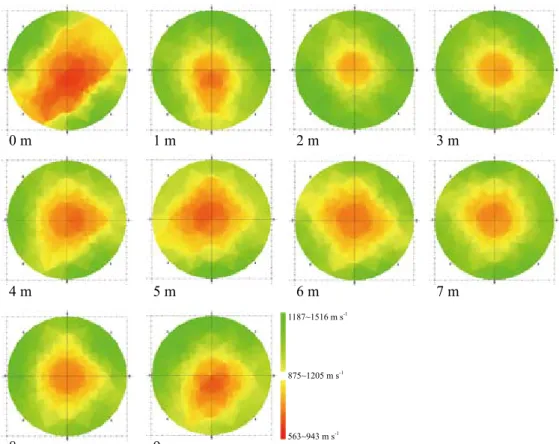
Figure 5 shows corresponding 2D im- ages of the transverse V at different tree
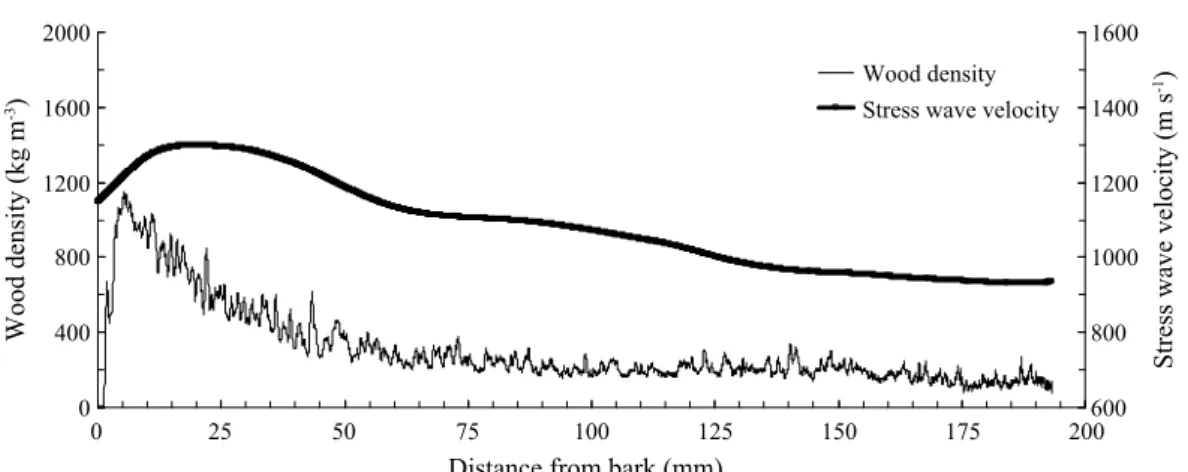
heights. As can be seen, at all tree heights, the peripheral region showed a larger V than the inner region. The same trend can be seen in Fig. 6, in which the bold line (pink) indicates variations in the V with increasing distance from the bark. All bold lines revealed an increase in the V in the peripheral region, reaching its maximum around 25 mm from the bark, followed by a decrease in the V with increasing distance towards the inner region.
At the same time, the V tended to be larger in the peripheral region of higher wood den- sity but smaller in the inner region of lower wood density. The same findings can be seen in Fig. 7, which shows variations in average V and D values at different tree heights with increasing distance from the bark to the core.
As can be seen, the largest V was observed in the peripheral region at about a 10~15-mm distance from the bark, while the smallest V was found in the inner region near the trunk core. Similar changes in the D profile from the bark to the core were observed. As can be seen in Fig. 7, the D increased sharply from the bark inward and peaked at around a 5~10 mm-distance from the bark. It then decreased gradually at 25~60 mm from the bark and re- mained more or less the same thereafter with
Fig. 4. Trunk diameter and moisture content at different tree heights.
increasing distance toward the core. In other words, the peripheral region of the disc was denser than its inner region. The above re- sults and observations reveal that the average thickness of peripheral wood was in general about 25~50 mm at various heights.
Variations in V and D values with tree height
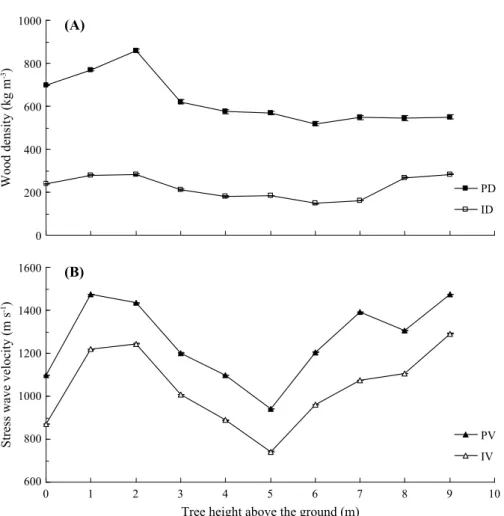
Figure 8 shows variations in V and D values at different tree heights. As can be seen, the transverse V first increased from the ground level, reached an average maximum of 1324.7 m s
-1at 2 m above the ground, then dropped gradually to an average minimum of 842.6 m s
-1at 5 m above the ground, and fi- nally rose again. A similar trend of changes in the D at different tree heights was observed.
As shown in Fig. 8, D first increased from the ground level, reached a maximum of 464.6 kg m
-3at 2 m above the ground, then dropped gradually to a minimum of 242.2 kg m
-3at 6 m above the ground, and finally rose again.
Figure 9 shows average V and D value in the peripheral (PV and PD) and inner re- gions (IV and ID). Both PV and IV exhibited the same trend. They first increased from the ground level, peaked respectively at 1 and 2 m above the ground, dropped to their low- est at 5 m above the ground, and then rose again. Changes in PD and ID values were less marked but had a similar trend. They first increased from the ground level, peaked at 2 m above the ground, dropped to their low- est at 6 m above the ground, and then rose again.
Fig. 5. 2D images of transverse stress wave velocities obtained at different tree heights.
0 m
4 m
8 m
1 m
5 m
9 m
2 m
1187~1516 m s-1
875~1205 m s-1
563~943 m s-1