Department of Agronomy
College of BioResources and Agriculture
National Taiwan University Doctoral Dissertation
Development of Genome-Wide High-Density SNP Markers in Solanum pimpinellifolium and Investigation of Candidate Loci
of Stamen Length in Tomato
YA-PING LIN
Advisor: KAI-YI CHEN, Dr.
108 04
April 2019
S
99
PstI 12,790
24,330 16,365 7,383
PstI
Fst AMOVA
18
50,000
98
style2.1 stamen2.2 stamen2.3
M82 TA3178 TA3178 style2.1
cLED19A24
CT9 18
Solyc02g087960.2 Solyc02g087970.1 Solyc02g088070.2 stamen2.2 stamen2.3
Abstract
Botanists have been fascinated by the genetic mechanism of heterostyly since Darwin’s theory of evolution. It was believed that the genes controlling self-incompatibility and floral morphology were linked tightly, so-called S-locus.
According to the classical evolutionary studies, when a plant evolved from outcrossing to selfing, it was necessary to lose self-incompatibility and then adjusted the positions of male and female floral organs through the rare recombination within the S-locus.
However, new evidence suggested that homostyly resulted from hemizygote rather than the rare recombination. In agriculture, studying the genetic mechanism of self-incompatibility and heterostyly can understand the changes of crop genomes under the selection forces during domestication processes. Additionally, it can accelerate the production of hybrid seeds or ensure the pollination to increase yield.
Solanum pimpinellifolium is a wild tomato originated from the coastal region of Peru and Ecuador. It serves as an important germplasm in tomato breeding programs because it displays many resistant traits and can freely cross to cultivated tomatoes.
Previous studies classified this species as complete or near complete allogamy, complete autogamy and intermediate type based on its mating system. In addition, allogamous accessions displayed higher genetic diversity and more exsertion of stigma than autogamous ones. Because S. pimpinellifolium contains the variations of outcrossing rate and floral morphology within its own species, it could be an ideal material to study the genetic mechanism of self-incompatibility and heterostyly.
Nowadays, molecular markers have been applied to crop breeding extensively.
Accompanying by the cost down of next generation sequencing, the development of genome-wide high-density markers for germplasm becomes essential in breeding
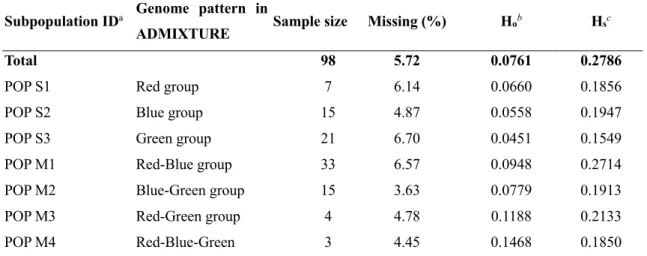
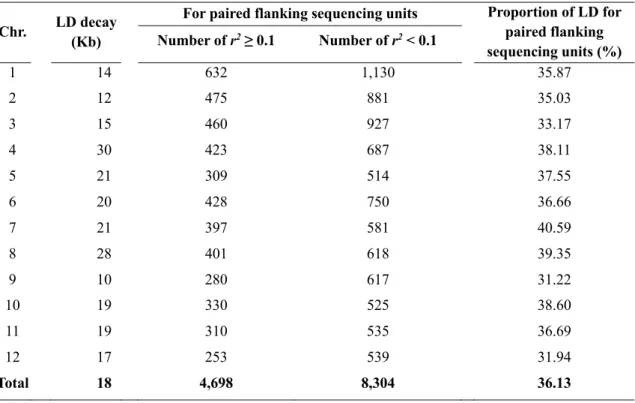
programs. In this research, we performed the PstI-digested associated DNA sequencing for 99 accessions of S. pimpinellifolium, resulting in 24,330 SNPs. The coverage extended to 12,790 genes, and a total of 7,383 genes were targeted directly by 16,365 SNPs. Besides, the sequencing regions and the annotated genes presented similar distributions through each chromosome. This suggested that PstI-digested associated DNA sequencing was an appropriate strategy to investigate candidate genes. This collection was divided into three subpopulations of single-ancestral genome and four subpopulations of mix-ancestral genome by ADMIXTURE. Principle component analysis, pairwise Fst and AMOVA all supported the subpopulations, implying this set of high-density markers was capable to estimate the subpopulations stably. Moreover, the overall LD decay was within 18 Kb, suggesting a fine resolution in genome-wide association study even to a single-gene level. However, to achieve such fine resolution, at least 50,000 markers were required.
Three candidate loci controlling stamen length were identified via the mixed linear model in genome-wide association study of 98 S. pimpinellifolium accessions, but all three loci presented high false discovery rate. Since the power and false positive rate of genome-wide association study depend on the sample size of a studying population, we suggest two approaches to increase sample size. One is to increasing samples in each subpopulation evenly. This approach can potentially make rare alleles to common alleles by increasing the allele frequency. The other is to sampling more individuals in the northern Peru because the accessions in the northern Peru present more genetic diversity. This approach can also increase both rare alleles and common alleles.
On the other hand, following the previous studies, stamen2.2 and stamen2.3 were located in the downstream interval next to style2.1. We performed a RNA sequencing
experiment of M82 and TA3178. TA3178 is an introgression line of M82 and contains a segment of Solanum pennellii near style2.1. We identified this introgression region by comparing the difference of SNPs between these two lines. Afterwards, following the previous work in our team, we screened 18 candidate genes from marker cLED19A24 to CT9 by comparing the fold change and cDNA polymorphism between M82 and TA3178. This result suggested that Solyc02g087960.2, Solyc02g087970.1 and Solyc02g088070.2 should be the candidates of stamen2.2 and stamen2.3.
Contents
... II
... IV
ABSTRACT ... VI
LIST OF FIGURES ... XIII
LIST OF TABLES ... XIV
LIST OF SUPPLEMENTARY DATA ... XV
CHAPTER 1 INTRODUCTION ... 1
1.1HETEROSTYLY ... 1
1.1.1 Evolution of heterostyly ... 1
1.1.2 Heterostyly in tomato species ... 2
1.2SOLANUM PIMPINELLIFOLIUM ... 3
1.2.1 The mating systems and flower characters in S. pimpinellifolium ... 3
1.2.2 S. pimpinellifolium is a diverse and attractive tomato germplasm ... 4
1.2.3 The population differentiation of S. pimpinellifolium ... 4
1.2.4 The genetic diversity of S. pimpinellifolium ... 5
1.3GENOME-WIDE ASSOCIATION STUDY ... 6
1.3.1 The concept of GWAS ... 6
1.3.2 LD determines the resolution of GWAS ... 7
1.3.3 Population structure and kinship cause confounding effects in GWAS ... 8
1.4NEXT GENERATION SEQUENCING (NGS) TECHNOLOGY ... 10
1.4.1 Restriction-site associated DNA sequencing ... 10
1.4.2 RNA sequencing ... 11
1.5DEVELOPMENT OF STAMEN ... 12
1.5.1 MADS box genes determine stamen differentiation ... 12
1.5.2 Phytohormones regulate the stamen development ... 12
1.6CONCLUSION ... 13
1.7REFERENCE ... 14
CHAPTER 2 ASSESSMENT OF POPULATION DIFFERENTIATION AND LINKAGE DISEQUILIBRIUM IN SOLANUM PIMPINELLIFOLIUM USING GENOME-WIDE HIGH-DENSITY SNP MARKERS ... 25
2.1PURPOSE ... 25
2.2MATERIAL AND METHOD ... 25
2.2.1 Plant materials ... 25
2.2.2 RAD sequencing ... 26
2.2.3 SNP calling ... 26
2.2.4 Population differentiation ... 27
2.2.5 Isolation by distance ... 28
2.2.6 Estimate of genetic variation and LD ... 28
2.2.7 Analysis of SolCAP array data of S. pimpinellifolium ... 28
2.3RESULT ... 29
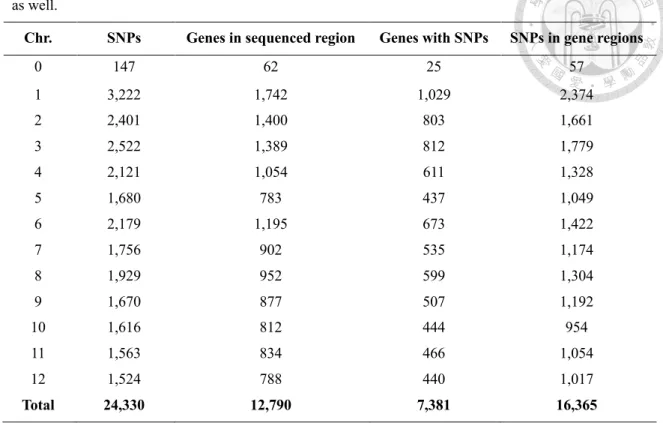
2.3.1 Identification of 24,330 SNPs from PstI-digested DNA libraries ... 29
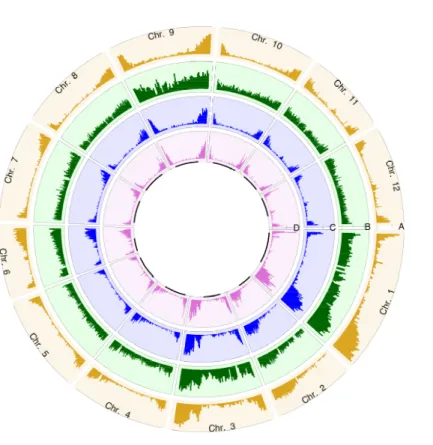
2.3.2 A similar distribution between genes and SNPs was identified in the vicinity of PstI cutting site throughout the genome ... 31
2.3.3 Genetic differentiation of S. pimpinellifolium was corresponding to the geographic area ... 32
2.3.4 Meta-analysis of SolCAP genotyping array resulted in 15 subpopulations ... 35
2.3.5 Rapid LD decay ... 36
2.3.6 Heterogeneity of genetic recombination within each chromosome ... 37
2.4DISCUSSION ... 38
2.4.1 Subpopulations clustering from north to south are expected due to the high correlation between genetic distance and geographic distance ... 38
2.4.2 Discrepancy of genetic clustering in SolCAP meta-analysis ... 40
2.4.3 More markers are required to cover through the genome of S. pimpinellifolium ... 41
2.5REFERENCE ... 42
2.6SUPPLEMENTARY DATA ... 47
CHAPTER 3 GWAS OF THE CANDIDATE GENES CONTROLLING STAMEN
LENGTH IN SOLANUM PIMPINELLIFOLIUM ... 73
3.1PURPOSE ... 73
3.2MATERIAL AND METHOD ... 73
3.2.1 Plant material and phenotyping ... 73
3.2.2 GWAS ... 74
3.2.3 Haplotype block ... 74
3.3RESULT ... 75
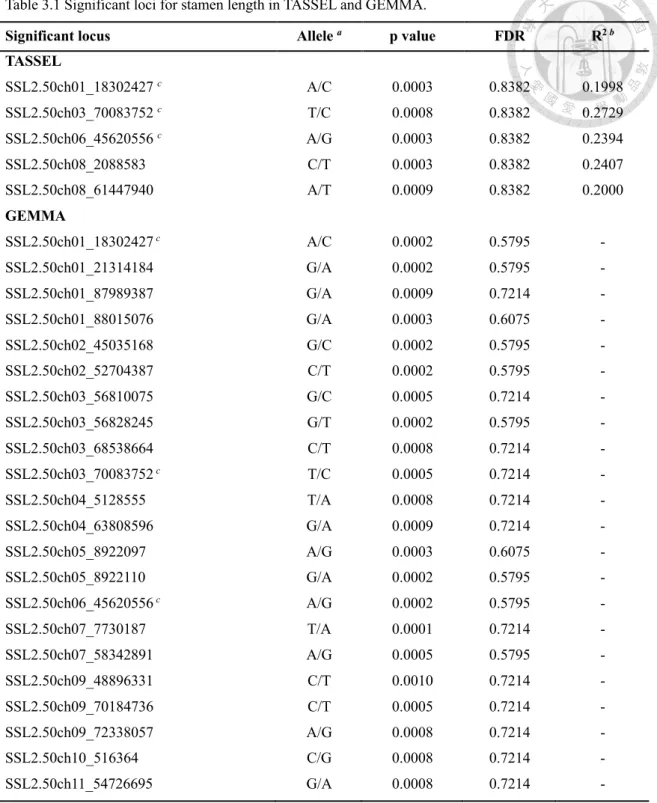
3.3.1 SSL2.50ch06_45620556 is significant among all the GLM and MLM analysis ... 75
3.3.2 The LD patterns of these significant loci ... 78
3.4DISCUSSION ... 78
3.4.1 QTL on chromosome 2, 3 and 7 ... 78
3.4.2 Large sample size is essential for GWAS ... 79
3.4.3 r2 or D’ as an indicator for LD ... 81
3.4.4 A gap between the estimation of r2 in different softwares ... 82
3.4.5 Insufficient coverage makes the build of haplotypes unsuccessful ... 83
3.4.6 More markers or more individuals ... 84
3.5REFERENCE ... 84
3.6SUPPLEMENTARY DATA ... 88
CHAPTER 4 THREE CANDIDATE GENES CONTROLLING STAMEN LENGTH REVEALED VIA THE TRANSCRIPTOME PROFILES OF M82 AND ITS INTROGRESSION LINE TA3178 ... 108
4.1PURPOSE ... 108
4.2MATERIAL AND METHOD ... 109
4.2.1 RNA sequencing ... 109
4.2.2 The boundary of introgression segment in TA3178 ... 109
4.2.3 Differential expression analysis ... 110
4.2.4 The cDNA polymorphisms of the genes from cLED19A24 to CT9 ... 110
4.3RESULT ... 111
4.3.1 The summary of RNA-seq ... 111
4.3.2 The 1.1 Mb introgression segment of S. pennellii ... 111
4.3.3 Only two DEGs in the introgression segment ... 112
4.3.4 Three candidate genes of stamen2.2 and stamen2.3 ... 113
4.4DISCUSSION ... 116
4.4.1 M82 presented more SNPs than TA3178 due to its deeper sequencing ... 116
4.4.2 Lacking biological replications may underestimate DEGs ... 116
4.4.2 Transcription profiles and polymorphisms in the introgression segment .... 117
4.4.4 Narrow down the candidate genes of stamen2.2 and stamen2.3 ... 118
4.5REFERENCE ... 119
4.6SUPPLEMENTARY DATA ... 121
List of Figures
FIGURE 2.1THE DISTRIBUTIONS OF ITAG2.4 GENE MODEL,PSTI CUTTING SITES AND SNPS THROUGH WHOLE GENOME.. ... 32 FIGURE 2.2ANCESTRY AND GEOGRAPHIC DISTRIBUTION OF 98
SOLANUMPIMPINELLIFOLIUM ACCESSIONS FROM THE TOMATO GENETICS RESOURCE
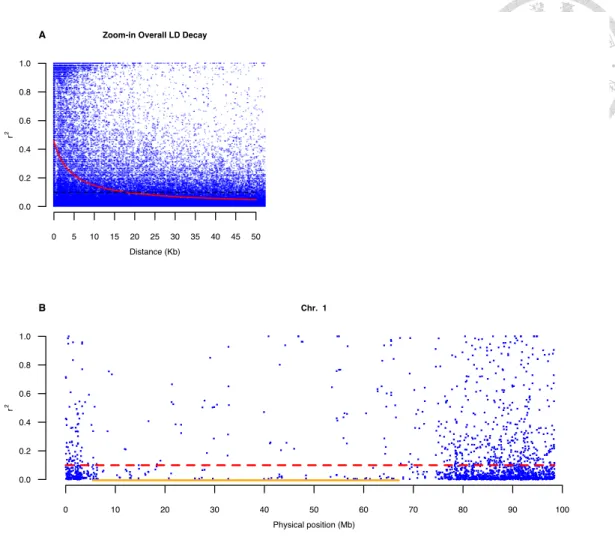
CENTER. ... 34 FIGURE 2.3VISUALIZATION FOR LD.A)THE 50KB INTERVAL OF OVERALL LD DECAY.B)
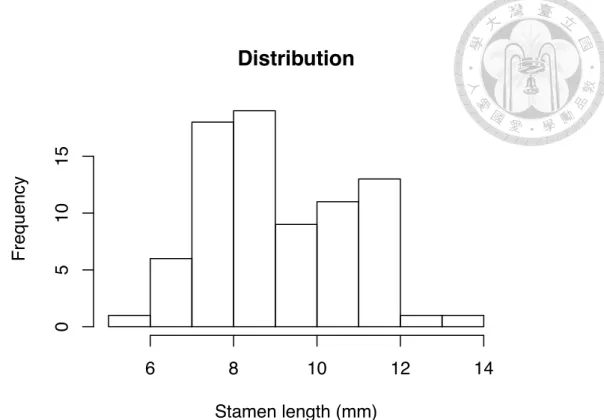
THE LOCAL LD OF CHROMOSOME 1. ... 37 FIGURE 3.1THE DISTRIBUTION OF STAMEN LENGTH ... 376 FIGURE 3.2THE GEOGRAPHIC DISTRIBUTION OF THE STAMEN CHARACTERS AMONG 98
ACCESSIONS.. ... 76 FIGURE 4.1THE SNPS IN THE INTROGRESSION SEGMENT IN M82 AND TA3178 ... 112
List of Tables
TABLE 2.1SUMMARY OF THE MARKERS DEVELOPED WITH THE RAD SEQUENCING
STRATEGY AND THE SEQUENCED GENES AS WELL. ... 30
TABLE 2.2GENETIC VARIATION OF EACH SUBPOPULATION. ... 33
TABLE 2.3THE LOCAL LD PROFILES OF INDIVIDUAL CHROMOSOMES. ... 36
TABLE 3.1SIGNIFICANT LOCI FOR STAMEN LENGTH IN TASSEL AND GEMMA. ... 77
TABLE 3.2THE TWO SIGNIFICANT LOCI BASED ON P=G+Q+E MODEL. ... 78
TABLE 4.1THE SUMMARY OF RNA-SEQ ... 111
TABLE 4.2THE NUMBER OF DEGS IN EACH CHROMOSOME. ... 113
TABLE 4.3THE SUMMARY OF THE CANDIDATE GENES FROM CLED19A24 TO CT9 ... 115
TABLE 4.4THE EXPRESSED GENES AND THE SNP DENSITY THROUGH EACH CHROMOSOME ... 116
List of Supplementary data
SUPPLEMENTARY FIGURE
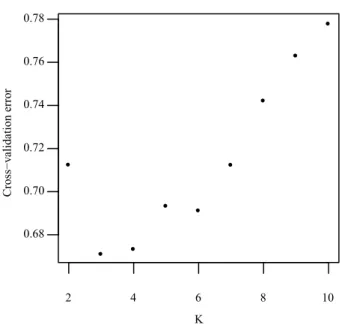
S_FIG 2.1THE CROSS-VALIDATION ERROR OF K VALUE IN ADMIXTURE. ... 47
S_FIG 2.2PAIRWISE ISOLATION BY DISTANCE OF 98 ACCESSIONS. ... 47
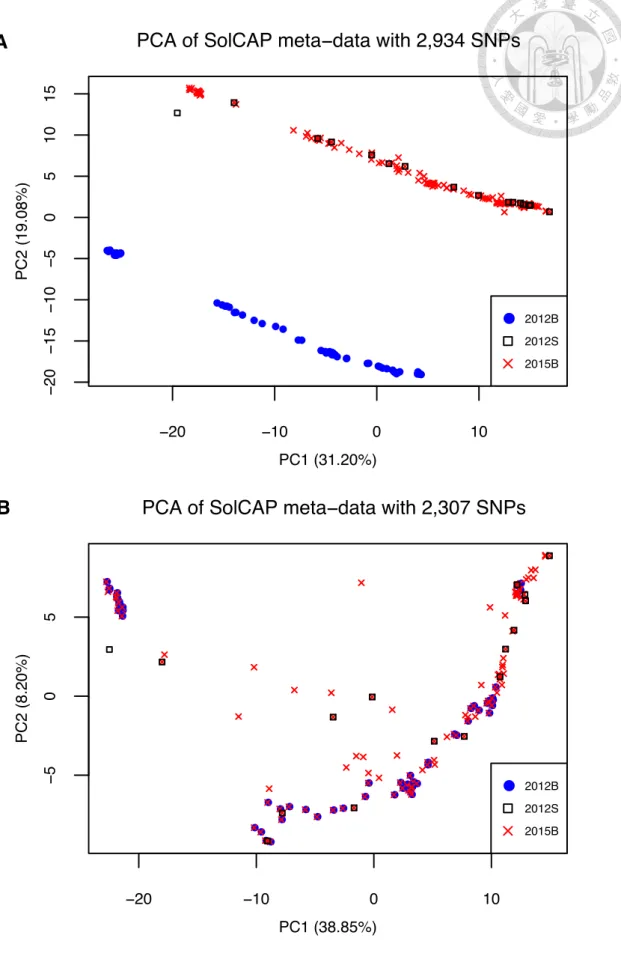
S_FIG 2.3THE PCA OF SOLCAP META-ANALYSIS.A)THE PCA PLOT OF BI-ALLELIC SNPS. B)THE PCA PLOT AFTER REMOVING THOSE SNPS OF REVERSE-COMPLEMENT ALLELE DESIGNATION. ... 48
S_FIG 2.4THE CROSS-VALIDATION ERROR OF SOLCAP META-ANALYSIS ... 49
S_FIG 2.5THE GENOME PATTERNS OF 214 SAMPLES IN SOLCAP META-ANALYSIS. ... 49
S_FIG 2.6PAIRWISE ISOLATION BY DISTANCE OF SOLCAP META−ANALYSIS. ... 50
S_FIG 2.7LD DECAY OF THE WHOLE GENOME. ... 50
S_FIG 2.850 KB INTERVAL LD DECAY OF EACH CHROMOSOME. ... 52
S_FIG 2.9THE LOCAL LD OF EACH CHROMOSOME. ... 56
S_FIG 3.1THE Q-Q PLOTS OF MIXED LINEAR MODELS. ... 88
S_FIG 3.2THE MANHATTAN PLOTS OF TASSEL AND GEMMA RESULTS. ... 89
S_FIG 3.3THE HEATMAP OF LD FOR EACH SIGNIFICANT LOCUS IN GWAS. ... 94
S_FIG 3.4THE HEATMAP OF R2 AND D’ FROM SSL2.50CH03_56790852 TO SSL2.50CH03_56903592. ... 95
S_FIG 3.5THE DIFFERENCE OF R2 BETWEEN TASSEL AND PLINK BASED ON 206,375 PAIR-WISE LD. ... 96
S_FIG 3.6THE OVERALL LD DECAY BASED ON TASSEL. ... 96
S_FIG 4.1THE DIFFERENCE OF SNP NUMBER BETWEEN M82 AND TA3178 THROUGH EACH CHROMOSOME. ... 123
S_FIG 4.2THE DISTRIBUTION OF DEGS. ... 124
SUPPLEMENTARY TABLE
S_TAB 2.1THE DETAILED INFORMATION ON EACH ACCESSION. ... 57 S_TAB 2.2THE STATISTICAL SUMMARIES OF EXPECTED SITES AND SEQUENCED SITES OF
PSTI, THE SITES TARGETED BY SNP AND THE SEQUENCED GENES. ... 62 S_TAB 2.3THE INFORMATION ON 24,330SNPS. ... 65 S_TAB 2.4PAIRWISE FST OF SUBPOPULATIONS. ... 66 S_TAB 2.5THE LOCATIONS AND GENOTYPES OF 214 SAMPLES OF SOLCAP GENOTYPING
ARRAY. ... 67 S_TAB 2.6THE REMOVED 627SNPS WITH REVERSE-COMPLEMENT ALLELE DESIGNATION.
... 68 S_TAB 2.7THE IDENTITY 0F 2,307SNP MARKERS WITHIN ACCESSIONS. ... 72 S_TAB 3.1THE STAMEN LENGTH OF EACH ACCESSION. ... 97 S_TAB 3.2THE DIFFERENCE OF PAIR-WISE R2 BETWEEN TASSEL AND PLINK, TAKING
SSL2.50CH03_56790852 TO SSL2.50CH03_56903592(THE SNPS IN S_FIG 3.4)
FOR EXAMPLE ... 98 S_TAB 3.3THE HAPLOTYPE BLOCKS ESTIMATED BY THE 24,330SNPS. ... 106 S_TAB 3.4THE HAPLOTYPE BLOCKS ESTIMATED BY ABOUT 68,000SNPS ... 107 S_TAB 4.1THE DETAIL INFORMATION OF 159 GENES IN THE INTROGRESSION SEGMENT. 125 S_TAB 4.2THE DETAIL INFORMATION OF THE DEGS BASED ON THE 99.9TH PERCENTILE
METHOD. ... 128 S_TAB 4.3THE DETAIL INFORMATION OF THE DEGS BASED ON THE DESEQ ANALYSIS. . 130
Chapter 1 Introduction
1.1 Heterostyly
1.1.1 Evolution of heterostyly
Heterostyly is a fascinating theme that draws deep interest of many botanists. Two morphs of Primula were appreciated by Charles Darwin for its evolutionary meaning:
long-styled flowers promote outcrossing and short-styled flowers tend to occur self-fertilization (Charles Darwin, M.A., P.B.S., F.L.S. &c., 1862). Darwin proposed that heterostyly with self-incompatibility promoted the selective advantages of outcrossing because it could increase both male and female fitness through pollen transfer between inter-morph individuals, preventing pollen waste, and reducing progenies of inbreeding depression. Even in the case with self-compatibility, heterostyly could still reduce the disadvantage of producing less-fit selfing progenies (Darwin, 1877;
Ganders, 1979; Keller, Thomson, & Conti, 2014).
In dimorphic heterostyly plants, long-styled flowers (pin flowers) show an elongated style at the mouth of flowers and anthers are located within a floral tube.
Short-styled flowers (thrum flowers), on the contrary, show a short style within a floral tube and anthers are exposed at a flower mouth (Darwin, 1862). The genetic mechanism of heterostyly with self-incompatibility was established as a single locus (S locus) that consisted of several functionally related genes, so-called the supergene. The S locus contained at least three genes that controlled the style length (G), pollen size (P) and anther length (A) (Muenchow, 1981). However, recent studies have revealed that the occurrence of self-fertile non-heterostyly flower may result from the mutation of
hemizygote, not the rare recombination within the supergene (Li et al., 2016; Yasui et al., 2016).
The genetic mechanism of heterostyly with self-incompatibility provides another application in agriculture. The common buckwheat (Fagopyrum esculentum) is a heteromorphic self-incompatible crop. Through whole genome sequencing of buckwheat, a segment of at least 5.4 Mb was identified as the short-styled specific allele.
Nearly 75% of this hemizygous segment contained the sequences of transposon elements and the rest was annotated as 32 genes (Yasui et al., 2016). Deciphering the connection between self-incompatibility and heterostyly could increase the yield by removing the self-incompatibility and designing a homomorphic flower to guarantee self-fertilization and increase cereal crop production.
1.1.2 Heterostyly in tomato species
Tomato is a perfect material to study the relationship between mating system and floral morphology because it displays both various mating systems and floral characters (Bedinger et al., 2011; Moyle, 2008; Spooner, Peralta, & Knapp, 2005). For example, S.
pennellii is self-incompatible and has a more exserted style while S. lycopersicum is self-compatible and has a recessed style (Chen, Cong, Wing, Vrebalov, & Tanksley, 2007; Spooner et al., 2005). The quantitative trait loci (QTL) of self-incompatibility and floral morphology have been mapped by different tomato crosses (Bernacchi &
Tanksley, 1997; Fulton et al., 1997; Georgiady, Whitkus, & Lord, 2002; Tanksley &
Loaiza-Figueroa, 1985). According to those studies, the S locus and QTL of floral characters were not located on the same chromosome. The S locus was mapped on chromosome 1 through different tomato populations (Bernacchi & Tanksley, 1997;
Tanksley & Loaiza-Figueroa, 1985). Meanwhile, se2.1, which was responsible for the
recessed stigma of cultivated tomatoes, was mapped on chromosome 2 (Bernacchi &
Tanksley, 1997; Chen & Tanksley, 2004). se2.1 contained five genes: dehisence2.1 for anther dehiscence, stamen2.1, stamen2.2 and stamen2.3 for anther length, and style2.1 for the style length (Chen & Tanksley, 2004). Other QTL controlling the floral characters included: stg2.1 and stg2.9 for stigma exsertion, sty8.1 for style length, ant3.2, atl2.1, and atl7.1 for anther length (Fulton et al., 1997; Georgiady et al., 2002;
Grandillo & Tanksley, 1996). Following Darwin’s theory, the heterostyly in tomato clade is supposed to prevent from producing less-fit selfing progenies because S locus and the QTL of floral characters are not associated.
1.2 Solanum pimpinellifolium
1.2.1 The mating systems and flower characters in S. pimpinellifolium
S. pimpinellifolium is a perennial wild tomato native to Ecuador and Peru. Charles M. Rick utilized S. pimpinellifolium to illustrate the relationship between mating systems and floral characters and their impacts on genetic diversity (Rick, Fobes, &
Holle, 1977; Rick, Holle, & Thorp, 1978). Three mating type were found within this wild tomato: complete autogamy, nearly complete allogamy and intermediate mating types (Rick et al., 1977). Because the exsertion of stigma interfered self-fertilization, both the floral morphology and the outcrossing rate were correlated to the genetic diversity (Rick et al., 1977, 1978). In addition, a F2 population derived from LA1237 (a selfing S. pimpinellifolium accession) crossing to LA1581 (an outcrossing accession) revealed QTL related to floral characters, ant3.2 and sty8.1 (Georgiady et al., 2002). In this case, the QTL controlling anther length is not associated with that of style length, suggesting that floral characters are not always inherited as a single compressed unit.
1.2.2 S. pimpinellifolium is a diverse and attractive tomato germplasm
S. pimpinellifolium is the closest relative to cultivated tomatoes; no reproductive barrier with cultivated tomatoes makes it advantageous in breeding programs (Bedinger et al., 2011; Moyle, 2008; Spooner et al., 2005). Several desired traits, such as abiotic and biotic resistances, have been revealed in some S. pimpinellifolium accessions. For example, Ph1, Ph2, Ph3 and Ph5, the QTL for late blight resistance, were identified in S.
pimpinellifolium. Among them, the most effective Ph3 was further designed as DNA markers to screen the major resistance gene in tomato breeding programs (Jung et al., 2015; Panthee, Gardner, Ibrahem, & Anderson, 2015). Recently, World Vegetable Center has developed a core collection of S. pimpinellifolium in order to conserve and utilize this germplasm efficiently (Rao, Kadirvel, Symonds, Geethanjali, & Ebert, 2012).
In addition, S. pimpinellifolium was involved in genome-wide association studies (GWAS) to increase the genetic diversity of the studying populations and to maintain the allele balance (Bauchet et al., 2017).
1.2.3 The population differentiation of S. pimpinellifolium
S. pimpinellifolium was originated from the northern Peru and then migrated to Ecuador and the southern Peru (Rick et al., 1977). The facultative allogamous S.
pimpinellifolium was separated from the originated allogamous ones because the new environments might not be suitable to outcrossing (Rick et al., 1977). These regions present gradient temperature and precipitation changes from Ecuador towards southern Peru: western Ecuador is equatorial winter dry; northern Peru is a hot, arid desert;
southern Peru is a cold, barren desert (Kottek, Grieser, Beck, Rudolf, & Rubel, 2006).
The selfing and adaptation to different environments created several subpopulations (Rick et al., 1977; Zuriaga et al., 2009). Previous studies have showed the Ecuadorian
and the Peruvian accessions were genetically different subpopulations (Rao et al., 2012;
Zuriaga et al., 2009). Recently, with the aid of SolCAP genotyping array, S. pimpinellifolium was divided into three subpopulations: one in northern Ecuador, one in the mountains of Ecuador extending to the north of Peru, and one in Peru (Blanca et al., 2012; Blanca et al., 2015). Since the genetic distance of these subpopulations was correlated to the major climatic parameters, such as temperature and humidity, special genetic characters could be selected and maintained in differential subpopulations (Blanca et al., 2015; Zuriaga et al., 2009).
1.2.4 The genetic diversity of S. pimpinellifolium
S. pimpinellifolium presents intermediate genetic diversity when comparing with other wild tomatoes (Moyle, 2008). However, this species still provides many attractive genetic variations, especial in resistant genes. For example, at least 26 alleles of Cf-2, a R gene resistant to Cladosporium fulvum, were identified in a set of 138 natural individuals (Caicedo & Schaal, 2004). Previous studies support its relatively high diversity when comparing to cultivated tomatoes (Blanca et al., 2012; Blanca et al., 2015). In addition, the higher outcrossing rate maintained the higher genetic diversity;
therefore, the genetic diversity declined from the northern Peru to the south (Blanca et al., 2015; Caicedo, 2008; Rick et al., 1977; Zuriaga et al., 2009). The outcrossing could break the linkage disequilibrium of S. pimpinellifolium, suggesting faster LD decay. The LD decay of S. pimpinellifolium ranged from 73 to 2,035 Kb, implying a finer resolution in GWAS in comparison with that from 3,178 to 15,554 Kb in S.
lycopersicum (Bauchet et al., 2017).
1.3 Genome-wide association study
1.3.1 The concept of GWAS
GWAS is basically the association mapping of a germplasm but with markers through whole genome. A significant marker is identified when the phenotypes between different genotypes are statistical different, usually examined by t-test or ANOVA. In this process, no linkage map is required. Once a significant marker is revealed, the QTL should be located within the LD interval of this marker. That is to say, GWAS utilizes markers through whole genome to examine which markers are associated with a studying phenotype. Comparing to a bi-parental cross population, GWAS involves more alleles because a germplasm accumulates mutations and recombinant events through its whole history. Together with the cost down of sequencing that makes the genotyping of a natural population much redundant, an explosive growth of GWAS in plants is now happening (Huang & Han, 2014; Soto-Cerda & Cloutier, 2012; Zhu, Gore, Buckler, &
Yu, 2008). Following the concept of GWAS, number of markers and the LD between markers and QTL in a given population will determine the GWAS result (Korte &
Farlow, 2013). More markers and more individuals mean more detectable recombinant events between markers and QTL, suggesting more precise estimations of LD and QTL effects. Unfortunately, QTL controlled by small-effect alleles and/or rare alleles could not be detected in a small population due to the limitation of statistical methods (Ingvarsson & Street, 2011; Korte & Farlow, 2013; Visscher et al., 2017). Despite many statistical models were proposed to rescue the problem, the fundamental solution would be a population of large sample size.
1.3.2 LD determines the resolution of GWAS
LD is the non-random assortment between pairwise alleles; it is measured by allele frequency and recombination using generally two statistics, r2 and D’. In brief, r2 summarizes the recombinant events and mutations, while D’ presents only the information of recombination. A main concern for D’ is that it is affected heavily by allele frequency, especially for a small population, because it is less possible to find a genotypic combination containing a rare allele. Meanwhile, r2 has a relatively small bias in a small population and additionally, it can reflect the correlation between markers and QTL. Therefore, r2 is utilized much more common in GWAS (Flint-Garcia, Thornsberry,
& Buckler, 2003). Since allele frequency and recombination determine LD, any factor that affects these two factors may have an influence on LD and consequently GWAS results. (Flint-Garcia et al., 2003; Slatkin, 2008). In population history, allele frequency serves as an essential parameter; therefore, migration, mutation, selection and populations with or without subdivision all reflect on LD. Generally, migration and mutation that provide new genetic materials to a population would increase genetic diversity and consequently decrease LD. Strong selection force or genetic bottleneck would decrease genetic diversity and then create LD in a population (Flint-Garcia et al., 2003; Slatkin, 2008).
Recombination is basically determined by mating system in a natural population. In selfing genomes, generally an extensive region of LD would be observed because alleles tend to be fixed after selfing (Huang et al., 2012; Yano et al., 2016). In addition, great selection force during domestication process made LD extending to hundreds Kb, leading rough resolution in GWAS (Bauchet et al., 2017; Sauvage et al., 2014). To overcome the natural disadvantages of selfing plants, discovering new materials of high
genetic diversity or designing diverse population panels have become common strategies. The population that consists of hybrid genomes, the multi-parent advanced generation intercross population or the population involving in wild relatives can increase genetic diversity and consequently improve GWAS resolution (Bauchet et al., 2017; Crowell et al., 2016; Huang et al., 2012; Ranc et al., 2012). In addition, more markers for a world-wide collection could also detect higher diversity, resulting in a better resolution as well (Kim et al., 2007).
1.3.3 Population structure and kinship cause confounding effects in GWAS
Any factor contributing to LD can inflate the significance of GWAS result because the associations between markers and phenotypes determine the results of GWAS (Huang & Han, 2014; Soto-Cerda & Cloutier, 2012; Korte & Farlow, 2013). The confounding is created when LD is formed by only different allele frequency among families or among subpopulations. Two main confounding effects are the population structure, the distant common ancestry of a population, and the kinship, the existence of relatedness in a relatedness-unknown population (Astle & Balding, 2010). So far, the mixed linear model is a standard procedure to correct both confounding factors (Astle &
Balding, 2010; Korol, Ronin, Itskovich, Peng, & Nevo, 2001; Yu et al., 2006; Zhang et al., 2010). However, population structure and kinship actually reflect a part of the genetic nature in a studying population rather than a problem. Simply using any correction could underestimate the genetic factors (Vilhjálmsson & Nordborg, 2013).
Therefore, the correction would be strongly recommended when performing a candidate gene research but would be optional when investigating the genetic architectures of a given trait (Korte & Farlow, 2013).
The most practical method to correct population structure into GWAS would be the
integrations of the matrix from principal component analysis (PCA) or STRUCTURE and/or ADMIXTURE. PCA transforms a large data of possibly correlated variables into a smaller set of linearly-uncorrelated principal components (PCs) (Patterson, Price, &
Reich, 2006). The first PC has the largest variance of the observation, meaning it accounts for the largest variation, and the succeeding PCs have the largest variance in a condition of orthogonal to the former components. By reducing the variables, PCs could reflect the main pattern of the genotypic data and distinguish the genetic difference among samples. Therefore, PCA is widely applied to cluster subpopulations of a studying population and PCs are added as a matrix of fixed effect into GWAS (Price, Zaitlen, Reich, & Patterson, 2010). On the other hand, STRUCTURE and/or ADMIXTURE is an algorism that using the posterior probability to estimate the best number of subpopulations (K) (Pritchard, Stephens, & Donnelly, 2000). It identifies the simplest haplotypes among individuals and then assigns the individuals into subpopulations as probabilities. The best K can be determined by the natural logarithm of the probability of K or delta K (Evanno, Regnaut, & Goudet, 2005; Pritchard et al., 2000). Once K is determined, the probability of each individual assigned to each subpopulation can also reflect the portion of different genomes for each individual. And this probability matrix can be added as a fixed effect in GWAS.
Kinship refers to the degree of genetic relatedness and traditionally is estimated by identical by descent (IBD) while pedigree information is well informed (Jacquard, 1972). When incorporating to a pedigree-unknown germplasm, two identical alleles are considered as IBD or random sampling from a gene pool. Hence, the kinship can be modified by allele frequency and treated as the correlation coefficient of pairwise individuals (Anderson & Weir, 2007). Generally, kinship would be a random effect in GWAS because traditionally the relatedness is used to estimate the variance of heritable
components (Yu et al. 2006; Astle & Balding 2009; Zhang et al. 2010).
1.4 Next generation sequencing (NGS) technology
1.4.1 Restriction-site associated DNA sequencing
So far, the genetic characteristics for S. pimpinellifolium accessions were mainly investigated based on SSR markers and the SolCAP array what were developed based on many genetic backgrounds (Blanca et al., 2012; Blanca et al., 2015; Rao et al., 2012;
Zuriaga et al., 2009). Although the SolCAP array contains 7,720 SNPs derived from cDNA and functional markers and indeed accelerates the genotyping, more SNPs are desired in GWAS (Bauchet et al., 2017; Sim et al., 2012). In reality, limited resource makes it a dilemma to choose higher marker density or greater population size.
Restriction-site associated DNA sequencing (RADseq) is one of the genome-wide genotyping techniques that applies NGS technology in a selective way (Davey &
Blaxter, 2010). The advantage of RADseq is to force the sequencing resource on the vicinity of restriction enzyme cutting sites. Therefore, it provides the flexibility of experimental design regarding to the trade-off between budget saving and marker density. Choosing restrict enzymes depends on the number of cutting sites or special purposes. One can predict the sites via reference genomes to estimate the reduced coverage of a genome (Shirasawa, Hirakawa, & Isobe, 2016). And, one can also use methylation-sensitive restriction enzymes, such as PstI, to concentrate the sequencing resource on gene-rich regions, preventing the resource from large heterochromatin on plant genomes (Bhakta, Jones, & Vallejos, 2015; Chen et al., 2014; Hohenlohe et al., 2010).
1.4.2 RNA sequencing
RNA can be converted into cDNA libraries to perform high-throughput sequencing, so-called RNA sequencing (RNA-seq). RNA-seq profiles the transcriptome of a certain tissue or organ in a certain development process through two major evaluations: the differentially expressed genes (DEGs) between groups and the polymorphisms in the coding sequences (Wang, Gerstein, & Snyder, 2009). However, the relative high cost of RNA-seq makes researchers struggle in the experiment design: more technical replications, more sequencing depth or more biological replications? First of all, it is recommended to prepare RNA-seq with technical replications in a balanced block design, to multiplex bar-coding samples in a single lane, because it can eliminate the confounding lane effect and simultaneously create technical replications (Auer &
Doerge 2010). Second, increasing depth can produce greater power to detect DEGs but with a reduced feedback when passing over a threshold (Liu, Zhou, & White, 2014;
Robles et al., 2012). Surprisingly, reducing depth as low as 15% did not affect false positive or true positive rates (Robles et al., 2012). Finally and most importantly, biological replications can increase power and the percentage of differentiated expressed (Robles et al., 2012). Therefore, to prepare biological replication is more essential than to increase sequencing depth. In tomato, two biological replications were often prepared and the reads ranged from 10 to 70 million per sample (Li et al., 2016;
Tan et al., 2015; Zhang et al., 2016; Zhu et al., 2015; Zouari et al., 2014). This implied the quantities of reads heavily depended on the sequencing resources from case to case.
1.5 Development of stamen
1.5.1 MADS box genes determine stamen differentiation
Two main types of genes control flower development: one identifies floral organ differentiation, so-called ABC model genes; the other generally regulated by phytohormones participates in organ initiation or later development processes (Haughn
& Somerville, 1988; Song, Qi, Huang, & Xie, 2013). In the ABC model, B- and C-class genes are responsible for stamen differentiation. Mutations of these genes can cause abnormal stamens. The B-class mutant of Tomato MADS gene 6 (TM6) and TOMATO APETALA 3 (TAP3) showed carpelloid stamen and sepaloid petal (de Martino, 2006).
The C-class mutant of TOMATO AGAMOUS 1 (TAG1) displayed not only petaloid stamen but also abnormal carpels (Pnueli, 1994). Since B and C genes all belong to the MADS box, these MADS box transcription factors are heavily responsible for stamen development (Smaczniak, Immink, Angenent, & Kaufmann, 2012).
1.5.2 Phytohormones regulate the stamen development
Previous studies have reviewed that auxin, gibberellin (GA), jasmonate (JA), brassinosteroid (BR) and cytokinin regulate the stamen development in different stages (Cardarelli & Cecchetti, 2014; Mandaokar et al., 2006; Song et al., 2013). Therefore, genes participating in phytohormone biosynthesis and/or regulated by phytohormones affect stamen development. For example, mutants of auxin synthesis (yuc2 yuc6) and auxin response factor (arf6 arf8) display non-elongated or shorter stamen (Cheng, Dai,
& Zhao, 2006; Nagpal et al., 2005). Meanwhile, phytohormones contribute to stamen development in crosstalk manners. Taking JA-regulated mechanism for example, the jasmonate zim-domain proteins release R2R3-type MYB transcription factors (MYB21
and MYB24) to participate stamen development when JA receptor receives JA and recruits jasmonate zim-domain proteins for degradation (Wu et al., 2011). In addition, JA biosynthesis is triggered not only by ARF6 and ARF8 but also by GA via the down regulation of DELLA, which suppresses the JA biosynthesis gene DAD1 (Cheng et al., 2009; Ishiguro, Kawai-Oda, Ueda, Nishida, & Okada, 2001; Nagpal et al., 2005; Tabata et al., 2010). The complicated mechanism of stamen development implies that many genes of small effect may be involved in the stamen length.
1.6 Conclusion
The natural variation of outcrossing rate and floral morphology within S.
pimpinellifolium made it an ideal material to study the relationship between self-incompatibility and heterostyly via GWAS. In this research, we intended to identify the QTL or candidate genes controlling stamen length with different tomato materials.
In chapter 2, we developed a set of genome-wide high-density SNP markers for a collection of 99 S. pimpinellifolium accessions through RADseq. Afterwards, population differentiation was investigated via this SNP set. In addition, LD analysis revealed the advantage and the weakness of this collection in GWAS. In chapter 3, we performed a GWAS to map the QTL controlling stamen length with the same S. pimpinellifolium population. We checked the false discovery rate (FDR) of the candidates and made some suggestions to reduce the high FDR. Finally, in chapter 4, a RNA-seq experiment was performed for M82 and its introgression line TA3178, which contained a segment of S. pennellii near style2.1. Based on the previous work in our team, stamen2.2 and stamen2.3 were located in the interval from marker cLED19A24 to CT9. This interval was annotated as 18 candidate genes. We narrowed the candidate list of stamen2.2 and stamen2.3 by comparing the expression level and cDNA polymorphisms between M82
and TA3178.
1.7 Reference
Anderson, A. D., & Weir, B. S. (2007). A maximum-likelihood method for the estimation of pairwise relatedness in structured populations. Genetics.
https://doi.org/10.1534/genetics.106.063149
Astle, W., & Balding, D. J. (2010). Population Structure and Cryptic Relatedness in Genetic Association Studies. Statistical Science. https://doi.org/10.1214/09-sts307 Auer, P. L., & Doerge, R. W. (2010). Statistical design and analysis of RNA sequencing
data. Genetics. https://doi.org/10.1534/genetics.110.114983
Bauchet, G., Grenier, S., Samson, N., Bonnet, J., Grivet, L., & Causse, M. (2017). Use of modern tomato breeding germplasm for deciphering the genetic control of agronomical traits by Genome Wide Association study. Theoretical and Applied Genetics. https://doi.org/10.1007/s00122-017-2857-9
Bedinger, P. A., Chetelat, R. T., McClure, B., Moyle, L. C., Rose, J. K. C., Stack, S.
M., … Royer, S. (2011). Interspecific reproductive barriers in the tomato clade:
Opportunities to decipher mechanisms of reproductive isolation. Sexual Plant Reproduction. https://doi.org/10.1007/s00497-010-0155-7
Bernacchi, D., & Tanksley, S. D. (1997). An interspecific backcross of Lycopersicon esculentum X L. hirsutum: Linkage analysis and a QTL study of sexual
compatibility factors and floral traits. Genetics.
Bhakta, M. S., Jones, V. A., & Vallejos, C. E. (2015). Punctuated distribution of recombination hotspots and demarcation of pericentromeric regions in Phaseolus vulgaris L. PLoS ONE. https://doi.org/10.1371/journal.pone.0116822
Blanca, J., Cañizares, J., Cordero, L., Pascual, L., Diez, M. J., & Nuez, F. (2012).
Variation Revealed by SNP Genotyping and Morphology Provides Insight into the Origin of the Tomato. PLoS ONE. https://doi.org/10.1371/journal.pone.0048198 Blanca, J., Montero-Pau, J., Sauvage, C., Bauchet, G., Illa, E., Díez, M. J., … Cañizares,
J. (2015). Genomic variation in tomato, from wild ancestors to contemporary breeding accessions. BMC Genomics. https://doi.org/10.1186/s12864-015-1444-1 Caicedo, A. L. (2008). Geographic diversity cline of R gene homologs in wild
populations of Solanum pimpinellifolium (Solanaceae). American Journal of Botany. https://doi.org/10.3732/ajb.95.3.393
Caicedo, A. L., & Schaal, B. A. (2004). Heterogeneous evolutionary processes affect R gene diversity in natural populations of Solanum pimpinellifolium. Proceedings of the National Academy of Sciences of the United States of America, 101,
17444–17449. https://doi.org/10.1073/pnas.0407899101
Cardarelli, M., & Cecchetti, V. (2014). Auxin polar transport in stamen formation and development: how many actors? Frontiers in Plant Science.
https://doi.org/10.3389/fpls.2014.00333
Charles Darwin M.A., P.B.S., F.L.S., &c. (1862). On the two forms, or dimorphic conditions in the species of Primula, and on their remarkable sexual relations. The Journal of Linn Soc Lond Bot, 6, 77–69.
Chen, A. L., Liu, C. Y., Chen, C. H., Wang, J. F., Liao, Y. C., Chang, C. H., … Chen, K.
Y. (2014). Reassessment of QTLs for late blight resistance in the tomato accession L3708 using a restriction site associated DNA (RAD) linkage map and highly aggressive isolates of Phytophthora infestans. PLoS ONE.
https://doi.org/10.1371/journal.pone.0096417
Chen, K. Y., Cong, B., Wing, R., Vrebalov, J., & Tanksley, S. D. (2007). Changes in regulation of a transcription factor lead to autogamy in cultivated tomatoes.
Science. https://doi.org/10.1126/science.1148428
Chen, K. Y., & Tanksley, S. D. (2004). High-resolution mapping and functional
analysis of se2.1: A major stigma exsertion quantitative trait locus associated with the evolution from allogamy to autogamy in the genus lycopersicon. Genetics.
https://doi.org/10.1534/genetics.103.022558
Cheng, H., Song, S., Xiao, L., Soo, H. M., Cheng, Z., Xie, D., & Peng, J. (2009).
Gibberellin acts through jasmonate to control the expression of MYB21, MYB24, and MYB57 to promote stamen filament growth in Arabidopsis. PLoS Genetics.
https://doi.org/10.1371/journal.pgen.1000440
Cheng, Y., Dai, X., & Zhao, Y. (2006). Auxin biosynthesis by the YUCCA flavin monooxygenases controls the formation of floral organs and vascular tissues in Arabidopsis. Genes and Development. https://doi.org/10.1101/gad.1415106 Crowell, S., Korniliev, P., Falcão, A., Ismail, A., Gregorio, G., Mezey, J., & McCouch,
S. (2016). Genome-wide association and high-resolution phenotyping link Oryza sativa panicle traits to numerous trait-specific QTL clusters. Nature
Communications. https://doi.org/10.1038/ncomms10527
Darwin, C. (1862). On the Two Forms, or Dimorphic Condition, in the Species of Priumla, and on their remarkable Sexual Relations. Journal of the Proceedings of the Linnean Society, Botany, 6, 77–96.
Darwin, C. (1877). The different forms of flowers on plants of the same Species. The Different Forms of Flowers on Plants of the Same Species.
https://doi.org/10.1017/CBO9780511731419
Davey, J. W., & Blaxter, M. L. (2010). RADseq: Next-generation population genetics.
Briefings in Functional Genomics. https://doi.org/10.1093/bfgp/elq031 de Martino, G. (2006). Functional Analyses of Two Tomato APETALA3 Genes
Demonstrate Diversification in Their Roles in Regulating Floral Development.
THE PLANT CELL ONLINE. https://doi.org/10.1105/tpc.106.042978
Evanno, G., Regnaut, S., & Goudet, J. (2005). Detecting the number of clusters of individuals using the software STRUCTURE: A simulation study. Molecular Ecology. https://doi.org/10.1111/j.1365-294X.2005.02553.x
Flint-Garcia, S. A., Thornsberry, J. M., & Buckler, E. S. (2003). Structure of Linkage Disequilibrium in Plants. Annual Review of Plant Biology.
https://doi.org/10.1146/annurev.arplant.54.031902.134907
Fulton, T. M., Beck-Bunn, T., Emmatty, D., Eshed, Y., Lopez, J., Petiard, V., … Tanksley, S. D. (1997). QTL analysis of an advanced backcross of Lycopersicon peruvianum to the cultivated tomato and comparisons with QTLs found in other wild species. Theoretical and Applied Genetics.
https://doi.org/10.1007/s001220050639
Ganders, F. R. (1979). The biology of heterostyly. New Zealand Journal of Botany.
https://doi.org/10.1080/0028825X.1979.10432574
Georgiady, M. S., Whitkus, R. W., & Lord, E. M. (2002). Genetic analysis of traits distinguishing outcrossing and self-pollinating forms of currant tomato, Lycopersicon pimpinellifolium (Jusl.) Mill. Genetics.
Grandillo, S., & Tanksley, S. D. (1996). QTL analysis of horticultural traits
differentiating the cultivated tomato from the closely related species Lycopersicon pimpinellifolium. Theoretical and Applied Genetics.
https://doi.org/10.1007/BF00224033
Haughn, G. W., & Somerville, C. R. (1988). Genetic control of morphogenesis in Arabidopsis. Developmental Genetics, 9(2), 73–89.
https://doi.org/10.1002/dvg.1020090202
Hohenlohe, P. A., Bassham, S., Etter, P. D., Stiffler, N., Johnson, E. A., & Cresko, W.
A. (2010). Population genomics of parallel adaptation in threespine stickleback using sequenced RAD tags. PLoS Genetics.
https://doi.org/10.1371/journal.pgen.1000862
Huang, X., & Han, B. (2014). Natural Variations and Genome-Wide Association Studies in Crop Plants. Annual Review of Plant Biology.
https://doi.org/10.1146/annurev-arplant-050213-035715
Huang, X., Zhao, Y., Wei, X., Li, C., Wang, A., Zhao, Q., … Han, B. (2012).
Genome-wide association study of flowering time and grain yield traits in a worldwide collection of rice germplasm. Nature Genetics.
https://doi.org/10.1038/ng.1018
Ingvarsson, P. K., & Street, N. R. (2011). Association genetics of complex traits in plants. New Phytologist. https://doi.org/10.1111/j.1469-8137.2010.03593.x Ishiguro, S., Kawai-Oda, a, Ueda, J., Nishida, I., & Okada, K. (2001). The
DEFECTIVE IN ANTHER DEHISCIENCE gene encodes a novel phospholipase A1 catalyzing the initial step of jasmonic acid biosynthesis, which synchronizes pollen maturation, anther dehiscence, and flower opening in Arabidopsis. Plant Cell, 13(10), 2191–2209. https://doi.org/10.1105/tpc.010192
Soto-Cerda, B. J., and S. Cloutier, 2012 Association mapping in plant genomes, in Genetic Diversity in Plants, edited by C. Mahmut. InTech, Rijeka.
Jacquard, A. (1972). Genetic Information Given by a Relative. Society.
https://doi.org/10.2307/2528643
Jung, J., Kim, H. J., Lee, J. M., Oh, C. S., Lee, H. J., & Yeam, I. (2015). Gene-based molecular marker system for multiple disease resistances in tomato against Tomato yellow leaf curl virus, late blight, and verticillium wilt. Euphytica.
https://doi.org/10.1007/s10681-015-1442-z
Keller, B., Thomson, J. D., & Conti, E. (2014). Heterostyly promotes disassortative pollination and reduces sexual interference in Darwin’s primroses: Evidence from experimental studies. Functional Ecology.
https://doi.org/10.1111/1365-2435.12274
Kim, S., Plagnol, V., Hu, T. T., Toomajian, C., Clark, R. M., Ossowski, S., …
Nordborg, M. (2007). Recombination and linkage disequilibrium in Arabidopsis thaliana. Nature Genetics. https://doi.org/10.1038/ng2115
Korol, A. B., Ronin, Y. I., Itskovich, A. M., Peng, J., & Nevo, E. (2001). Enhanced efficiency of quantitative trait loci mapping analysis based on multivariate complexes of quantitative traits. Genetics.
https://doi.org/10.1534/genetics.107.080101
Korte, A., & Farlow, A. (2013). The advantages and limitations of trait analysis with GWAS: A review. Plant Methods. https://doi.org/10.1186/1746-4811-9-29 Kottek, M., Grieser, J., Beck, C., Rudolf, B., & Rubel, F. (2006). World map of the
Köppen-Geiger climate classification updated. Meteorologische Zeitschrift, 15(3), 259–263. https://doi.org/10.1127/0941-2948/2006/0130
Li, J., Cocker, J. M., Wright, J., Webster, M. A., McMullan, M., Dyer, S., … Gilmartin, P. M. (2016). Genetic architecture and evolution of the S locus supergene in Primula vulgaris. Nature Plants. https://doi.org/10.1038/nplants.2016.188
Li, J., Tao, X., Li, L., Mao, L., Luo, Z., Khan, Z. U., & Ying, T. (2016). Comprehensive RNA-seq analysis on the regulation of tomato ripening by exogenous auxin. PLoS ONE. https://doi.org/10.1371/journal.pone.0156453
Liu, Y., Zhou, J., & White, K. P. (2014). RNA-seq differential expression studies: More sequence or more replication? Bioinformatics.
https://doi.org/10.1093/bioinformatics/btt688
Mandaokar, A., Thines, B., Shin, B., Markus Lange, B., Choi, G., Koo, Y. J., … Browse, J. (2006). Transcriptional regulators of stamen development in Arabidopsis identified by transcriptional profiling. Plant Journal.
https://doi.org/10.1111/j.1365-313X.2006.02756.x
Moyle, L. C. (2008). Ecological and evolutionary genomics in the wild tomatoes (Solanum Sect. Lycopersicon). Evolution.
https://doi.org/10.1111/j.1558-5646.2008.00487.x
Nagpal, P., Ellis, C. M., Weber, H., Ploense, S. E., Barkawi, L. S., Guilfoyle, T.
J., …Reed, J. W. (2005). Auxin response factors ARF6 and ARF8 promote jasmonic acid production and flower maturation. Development.
https://doi.org/10.1242/dev.01955
Panthee, D. R., Gardner, R. G., Ibrahem, R., & Anderson, C. (2015). Molecular
Markers Associated with Ph- 3 Gene Conferring Late Blight Resistance in Tomato.
American Journal of Plant Sciences, 6, 2144–2150.
https://doi.org/10.4236/ajps.2015.613216
Patterson, N., Price, A. L., & Reich, D. (2006). Population structure and eigenanalysis.
PLoS Genetics. https://doi.org/10.1371/journal.pgen.0020190
Pnueli, L. (1994). Isolation of the Tomato AGAMOUS Gene TAG1 and Analysis of Its Homeotic Role in Transgenic Plants. The Plant Cell Online, 6(2), 163–173.
https://doi.org/10.1105/tpc.6.2.163
Price, A., Zaitlen, N., Reich, D., & Patterson, N. (2010). New approaches to population stratification in genome-wide association studies. Nature Reviews Genetics, 11(7), 459–463. https://doi.org/10.1038/nrg2813.New
Pritchard, J. K., Stephens, M., & Donnelly, P. (2000). Inference of population structure using multilocus genotype data. Genetics.
Ranc, N., Munos, S., Xu, J., Le Paslier, M. C., Chauveau, A., Bounon, R., … Causse, M.
(2012). Genome-wide association mapping in tomato (Solanum lycopersicum) is possible using genome admixture of Solanum lycopersicum var. cerasiforme. G3, 2(8), 853–864. https://doi.org/10.1534/g3.112.002667
Rao, E. S., Kadirvel, P., Symonds, R. C., Geethanjali, S., & Ebert, A. W. (2012). Using SSR markers to map genetic diversity and population structure of Solanum
pimpinellifolium for development of a core collection. Plant Genetic Resources:
Characterisation and Utilisation. https://doi.org/10.1017/S1479262111000955 Rick, C. M., Fobes, J. F., & Holle, M. (1977). Genetic variation in Lycopersicon
pimpinellifolium: Evidence of evolutionary change in mating systems. Plant Systematics and Evolution. https://doi.org/10.1007/BF00984147
Rick, C. M., Holle, M., & Thorp, R. W. (1978). Rates of cross-pollination in
Lycopersicon pimpinellifolium: Impact of genetic variation in floral characters.
Plant Systematics and Evolution. https://doi.org/10.1007/BF00988982
Robles, A., Qureshi, S. E., Stephen, S. J., Wilson, S. R., Burden, C. J., Taylor, J. M., … Taylor, J. M. (2012). Efficient experimental design and analysis strategies for the detection of differential expression using RNA-Sequencing. BMC Genomics, 13(1), 484. https://doi.org/10.1186/1471-2164-13-484
Sauvage, C., Segura, V., Bauchet, G., Stevens, R., Do, P. T., Nikoloski, Z., … Causse, M. (2014). Genome-Wide Association in Tomato Reveals 44 Candidate Loci for Fruit Metabolic Traits. Plant Physiology, 165(3), 1120–1132.
https://doi.org/10.1104/pp.114.241521
Shirasawa, K., Hirakawa, H., & Isobe, S. (2016). Analytical workflow of double-digest restriction site-associated DNA sequencing based on empirical and in silico optimization in tomato. DNA Research. https://doi.org/10.1093/dnares/dsw004
Sim, S. C., van Deynze, A., Stoffel, K., Douches, D. S., Zarka, D., Ganal, M. W., … Francis, D. M. (2012). High-Density SNP Genotyping of Tomato (Solanum lycopersicum L.) Reveals Patterns of Genetic Variation Due to Breeding. PLoS ONE. https://doi.org/10.1371/journal.pone.0045520
Slatkin, M. (2008). Linkage disequilibrium - Understanding the evolutionary past and mapping the medical future. Nature Reviews Genetics.
https://doi.org/10.1038/nrg2361
Smaczniak, C., Immink, R. G. H., Angenent, G. C., & Kaufmann, K. (2012).
Developmental and evolutionary diversity of plant MADS-domain factors: insights from recent studies. Development. https://doi.org/10.1242/dev.074674
Song, S., Qi, T., Huang, H., & Xie, D. (2013). Regulation of stamen development by coordinated actions of jasmonate, auxin, and gibberellin in Arabidopsis. Molecular Plant. https://doi.org/10.1093/mp/sst054
Spooner, D. M., Peralta, I. E., & Knapp, S. (2005). Comparison of AFLPs with other markers for phylogenetic inference in wild tomatoes [Solanum L . section Lycopersicon (Mill.) Wettst.]. Taxon, 54(1), 43–61.
Tabata, R., Ikezaki, M., Fujibe, T., Aida, M., Tian, C. E., Ueno, Y., … Ishiguro, S.
(2010). Arabidopsis AUXIN RESPONSE FACTOR6 and 8 regulate jasmonic acid biosynthesis and floral organ development via repression of class 1 KNOX genes.
Plant and Cell Physiology. https://doi.org/10.1093/pcp/pcp176
Tan, G., Liu, K., Kang, J., Xu, K., Zhang, Y., Hu, L., … Li, C. (2015). Transcriptome analysis of the compatible interaction of tomato with Verticillium dahliae using RNA-sequencing. Frontiers in Plant Science.
https://doi.org/10.3389/fpls.2015.00428
Tanksley, S. D., & Loaiza-Figueroa, F. (1985). Gametophytic self-incompatibility is
controlled by a single major locus on chromosome 1 in Lycopersicon peruvianum.
Proceedings of the National Academy of Sciences.
https://doi.org/10.1073/pnas.82.15.5093
Vilhjálmsson, B. J., & Nordborg, M. (2013). The nature of confounding in genome-wide association studies. Nature Reviews Genetics.
https://doi.org/10.1038/nrg3382
Visscher, P. M., Wray, N. R., Zhang, Q., Sklar, P., McCarthy, M. I., Brown, M. A., &
Yang, J. (2017). 10 Years of GWAS Discovery: Biology, Function, and Translation. American Journal of Human Genetics.
https://doi.org/10.1016/j.ajhg.2017.06.005
Wang, Z., Gerstein, M., & Snyder, M. (2009). RNA-Seq: A revolutionary tool for transcriptomics. Nature Reviews Genetics. https://doi.org/10.1038/nrg2484 Wu, D., Liu, Y., Song, S., Chang, C., Peng, J., Peng, W., … Qi, T. (2011). The
Jasmonate-ZIM Domain Proteins Interact with the R2R3-MYB Transcription Factors MYB21 and MYB24 to Affect Jasmonate-Regulated Stamen Development in Arabidopsis. The Plant Cell, 23(3), 1000–1013.
https://doi.org/10.1105/tpc.111.083089
Yano, K., Yamamoto, E., Aya, K., Takeuchi, H., Lo, P. C., Hu, L., … Matsuoka, M.
(2016). Genome-wide association study using whole-genome sequencing rapidly identifies new genes influencing agronomic traits in rice. Nature Genetics, 48(8), 927–934. https://doi.org/10.1038/ng.3596
Yasui, Y., Hirakawa, H., Ueno, M., Matsui, K., Katsube-Tanaka, T., Yang, S. J., … Mori, M. (2016). Assembly of the draft genome of buckwheat and its applications in identifying agronomically useful genes. DNA Research.
https://doi.org/10.1093/dnares/dsw012
Yu, J., Pressoir, G., Briggs, W. H., Bi, I. V., Yamasaki, M., Doebley, J. F., … Buckler, E. S. (2006). A unified mixed-model method for association mapping that accounts for multiple levels of relatedness. Nature Genetics. https://doi.org/10.1038/ng1702 Zhang, S., Xu, M., Qiu, Z., Wang, K., Du, Y., Gu, L., & Cui, X. (2016). Spatiotemporal
transcriptome provides insights into early fruit development of tomato (Solanum lycopersicum). Scientific Reports. https://doi.org/10.1038/srep23173
Zhang, Z., Ersoz, E., Lai, C. Q., Todhunter, R. J., Tiwari, H. K., Gore, M. A., … Buckler, E. S. (2010). Mixed linear model approach adapted for genome-wide association studies. Nature Genetics. https://doi.org/10.1038/ng.546
Zhu, B., Yang, Y., Li, R., Fu, D., Wen, L., Luo, Y., & Zhu, H. (2015). RNA sequencing and functional analysis implicate the regulatory role of long non-coding RNAs in tomato fruit ripening. Journal of Experimental Botany.
https://doi.org/10.1093/jxb/erv203
Zhu, C., Gore, M., Buckler, E. S., & Yu, J. (2008). Status and Prospects of Association Mapping in Plants. The Plant Genome, 1(1), 5–20.
https://doi.org/10.3835/plantgenome2008.02.0089
Zouari, I., Salvioli, A., Chialva, M., Novero, M., Miozzi, L., Tenore, G. C., … Bonfante, P. (2014). From root to fruit: RNA-Seq analysis shows that arbuscular mycorrhizal symbiosis may affect tomato fruit metabolism. BMC Genomics.
https://doi.org/10.1186/1471-2164-15-221
Zuriaga, E., Blanca, J. M., Cordero, L., Sifres, A., Blas-Cerdán, W. G., Morales, R., &
Nuez, F. (2009). Genetic and bioclimatic variation in Solanum pimpinellifolium.
Genetic Resources and Crop Evolution.
https://doi.org/10.1007/s10722-008-9340-z
Chapter 2 Assessment of population differentiation and linkage disequilibrium in Solanum pimpinellifolium using genome-wide high-density SNP markers
2.1 Purpose
Before performing a GWAS, the population structure and the LD should be investigated to understand the genetic nature of a studying population. First of all, a PstI-digested RADseq of 99 accessions was conducted to develop a genome-wide high-density SNP set. The population differentiation was examined by different approaches, including ADMIXTURE, PCA, pair-wise Fst and AMOVA. Afterwards, the LD and the marker density were evaluated to reveal the advantage and the potential weakness of this collection in GWAS. This chapter is modified based on the published paper on G3; Genes/Genomes/Genetics: Assessment of Genetic Differentiation and Linkage Disequilibrium in Solanum pimpinellifolium Using Genome-Wide High-Density SNP Markers (https://doi.org/10.1534/g3.118.200862).
2.2 Material and Method
2.2.1 Plant materials
All plant materials and their information were obtained from TGRC (S_Tab 2.1;
http://tgrc.ucdavis.edu/). A total of 12 accessions from Ecuador and 87 accessions from Peru were utilized in this study. According to their mating types, 43 accessions were facultative self-compatible (FSC), and 56 accessions were autogamous self-compatible (ASC). Seeds were propagated by self-pollination for two generations using the method
of single-seed descent in a greenhouse. Young leaves collected from plants of these single-seed descendent seeds were used for DNA extraction.
2.2.2 RAD sequencing
Total genomic DNA was extracted from young leaves using a modified CTAB method (Fulton, Chunwongse, & Tanksley, 1995) and purified with a DNeasy Blood &
Tissue Kit (QIAGEN, Venlo, Netherland) following the manufacturer’s instructions. We chose PstI to select the sequencing regions because PstI is a methylation-sensitive restriction enzyme and it may cut more frequently in euchromatin regions than heterochromatin regions (Dobritsa & Dobritsa, 1980). PstI-digested DNA libraries were prepared following the protocol of Etter et al. (Etter, Bassham, Hohenlohe, Johnson, &
Cresko, 2011). Four RADseq libraries were constructed, and each was sequenced in one lane of an Illumina HiSeq2000 flow cell (100 bp single-end reads) (Illumina Inc., San Diego, CA, USA). All the sequences of RADseq were submitted to the NCBI SRA database, and the BioProject Number is PRJNA358110.
2.2.3 SNP calling
Reads were analyzed with Stacks version 1.37 (Catchen, Hohenlohe, Bassham, Amores, & Cresko, 2013) and with CLC Genomics Workbench software version 6.5.1 (QIAGEN, Venlo, Netherlands). First, the process_radtags command in Stacks filtered out low-quality reads with Q scores less than 20. The remaining reads were mapped to the tomato reference genome SL2.50 (Fernandez-Pozo et al., 2015) using the “Map Reads to Reference” tool in the CLC Genomics Workbench software. Considering that genetic variation between the tomato reference genome S. lycopersicum and S. pimpinellifolium is larger than genetic variation within S. lycopersicum, mapping
parameters were set as 0.5 for the length fraction and 0.9 for the similarity fraction. The reads of the same individual in different lanes were merged. In the subsequent analyses using Stacks, the ref_map.pl command set the parameter –m (minimum read depth to create a stack) as 10, and the populations command set the parameter –p (minimum number of populations a locus must be present) as 75. SNPs with a minor allele frequency of less than 0.05 were further excluded, and a set of 24,330 SNP markers was obtained. This set of 24,330 SNP markers was utilized for the analyses of genetic variation, LD, Fst and AMOVA. Another SNP set without ‘redundant SNP markers’ was used to conduct the principal component analysis (PCA) and ADMIXTURE because these two matrices are expected to correct the structure in GWAS. To remove
‘redundant SNP markers’, we defined a sequencing unit as a sequencing region surrounding a PstI site, usually 186 bp long, which has at least one SNP with a minor allele frequency greater than 0.05 in the S. pimpinellifolium population. If more than one SNPs are located in a sequencing unit and they are in complete LD (r2 = 1), only the first SNP is kept. This process resulted in a total of 19,993 SNP markers. ITAG2.4 gene model from SGN was used as the reference gene annotation.
2.2.4 Population differentiation
PCA was performed in TASSEL5.0 (Bradbury et al., 2007). ADMIXTURE was completed following the manual; the best K was determined following the procedure of cross-validation in the manual (Alexander, Novembre, & Lange, 2009). Pairwise Fst
(Weir & Cockerham, 1984) and analysis of molecular variance (AMOVA) (Excoffier, Smouse, & Quattro, 1992) were conducted in the R package StAMPP (Pembleton, Cogan, & Forster, 2013).