Synthesis and Luminescent Properties of MgIn
2−xGa
xO
4:Eu
3+Phosphors
Bin-Siang Tsai, Yen-Hwei Chang,zand Yu-Chung Chen
Department of Materials Science and Engineering, National Cheng Kung University, Tainan 70101, Taiwan
As the novel Eu-doped MgIn2−xGaxO4共x = 0-0.3兲 phosphors were synthesized by solid-state method, their characterization and luminescent properties were also investigated. X-ray dirraction results revealed that the Eu3+ions are well dissolved into the MgIn2−xGaxO4host below x = 0.2. The Eu3+ions preferred to occupy the distorted octahedral sites in the MgIn2−xGaxO4structure making the electric-dipole transition prominent. The extraordinary excitation spectrum showed only intense f-f transition of Eu3+ ions around 467 nm without a charge transfer band. Under excitation, the as-obtained powders emitted bright red light at 615 nm 共5
D0→ 7
F2兲. The intensity ratio of5D0→ 7
F2to 5
D0→ 7
F1increased with Ga concentration and reached the maximum of x = 0.2. Thus, the MgIn1.8Ga0.2O4:5 atom % Eu3+phosphor has good luminescent performance.
© 2005 The Electrochemical Society. 关DOI: 10.1149/1.1921128兴 All rights reserved.
Manuscript submitted January 13, 2005; revised manuscript received March 3, 2005. Available electronically May 17, 2005.
Raearth-ion-doped crystallite has attracted considerable re-search interest because of its excellent luminescent properties.1-5In particular, the Eu3+-doped compounds emitting bright red light were
extensively investigated and were always used as phosphor in many fields.6-8In recent years, many oxide based phosphors were synthe-sized to improve the luminescent performances including color pu-rity, emission intensity, and quantum efficiency. In this paper, a new type of oxide phosphor host “MgIn2−xGaxO4” is introduced.
Accord-ing to the compositions, the MgIn2−xGaxO4共MIGO兲 crystallites ex-hibit three distinct phases, including MgIn2O4, MgInGaO4, and
MgGa2O4.9Due to the excellent optical and electrical properties, the
MIGO crystallites have the potential as the candidate of transparent conductive oxides.9-11 To our knowledge, no phosphors based on MIGO were reported. That is why we were interested in investigat-ing the luminescent properties of Eu-doped MIGO, especially for the MgIn2−xGaxO4 phase with x艋 0.3. The MgIn2O4 stacked in inverse-spinel structure belongs to cubic space group Oh7共Fd3m兲. It is well-known that the luminescent property is affected by the local structure symmetry around the activators. In this structure, there are two sites, tetrahedral and octahedral sites, for trivalent cation to occupy. For the consideration of ionic radius, the Eu3+ion is pre-ferred to occupy the distorted octahedral site. In this paper, while MgIn2−xGaxO4phosphors with x = 0-0.3 activated by the trivalent
Europium ion have been prepared by the solid-state reaction process at 1400°C, the characterization and luminescent properties were also investigated.
Experimental
In this study, a solid-state reaction method was employed to syn-thesize the MgIn2−xGaxO4:Eu 共where x = 0.0, 0.1, 0.2, and 0.3兲
powders. Stoichiometric amount of MgO, In2O3, Ga2O3, and Eu2O3 were mixed by high-energy vibration ball-milling and then calcined at 1400°C in air for 10 h. After heat-treatment, the remaining pow-ders were characterized by X-ray diffractrometry共XRD兲 and field-emission scanning electron microscopy 共FE-SEM兲 共Philips XL-40FEG兲. The luminescent property were measured with an Hitachi F-4500 fluorescence spectrophotometer.
Results and Discussion
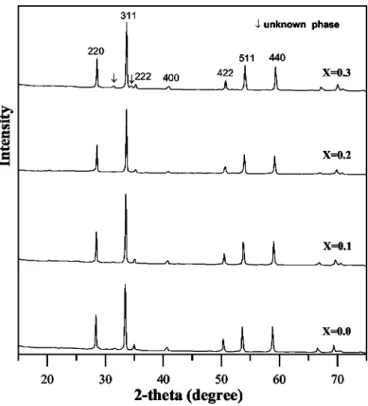
The novel oxide phosphor MIGO:Eu3+ were prepared and the structure information was investigated. Figure 1 shows the variation of XRD patterns of MgIn2−xGaxO4:5 atom % Eu powders. The
re-sults of XRD indicate that only single phase of the inverse-spinel type MgIn2O4 was observed in the sample as x = 0.0-0.2. Further arising the Ga content to x = 0.3, two unknown impurity peaks ap-pear at 2-theta of 31.4 and 34.6°. In this study, the In3+ions were
substituted by the Eu3+ions in the MgIn
2−xGaxO4. The ion radius of
Eu3+ion for six-fold coordination is 0.1087 nm, and the radius of
In3+ion for four- and sixfold coordination are 0.076 and 0.094 nm, respectively.12Due to the large radius difference in tetrahedral site, the Eu3+ion is presumable to occupy the octahedral site. Despite the above-mentioned conjecture, the extra local stress will be introduced to distort the lattice. On the other hand, the local strain will be compensated to enhance the solubility of Eu3+ ions in MgIn
2O4
phase owing to the incorporation of smaller Ga3+ions 共0.076 nm兲
into the host. The introduction of Ga3+also decreases the structure symmetry of octahedral site in inverse spinel structure.
The crystallinity of MIGO:Eu3+ powders could be estimated from the XRD patterns. The full width at half-maximum共fwhm兲 for all prepared samples with x = 0.0, 0.1, 0.2, and 0.3 are 0.22, 0.20, 0.18, and 0.20, respectively. The small values of fwhm for all pre-pared samples imply that Eu-doped MgIn2−xGaxO4exhibit excellent crystallinity. It is also important to point out that the sample with
zE-mail: [email protected]
Figure 1. XRD patterns of the MgIn2−xGaxO4:5 atom % Eu3+powders pre-pared at 1400°C.
Electrochemical and Solid-State Letters, 8共7兲 H55-H57 共2005兲
1099-0062/2005/8共7兲/H55/3/$7.00 © The Electrochemical Society, Inc.
H55
x = 0.2 exhibits the minimum fwhm, suggesting that the MgIn1.8Ga0.2O4: 5 atom % Eu3+ has the best crystallinity. The
lower the crystallinity, the more defects will be introduced into the host. That makes the nonradiative process more manifest and de-creases the emission intensity.
Figure 2 shows the SEM images of MgIn1.8Ga0.2O4:5 atom %
Eu powders obtained at 1400°C in air for 10 h. After heat-treatment at high temperature, the crystallites sintered together to form large clusters. The morphology of the MgIn1.8Ga0.2O4:5 atom % Eu seems to be irregular and the grain size is difficult to be well de-fined. The particle size and surface morphology which always affect the luminescent properties could be well controlled to improve the luminescent performance.
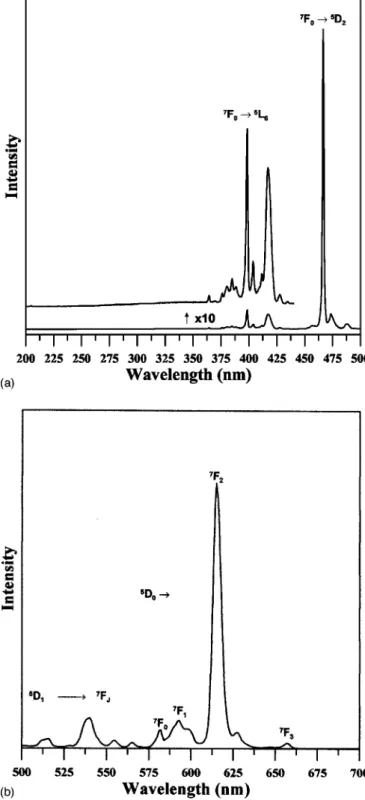
Figure 3 illustrates the excitation共Fig. 3a兲 and emission 共Fig. 3b兲 spectra of MgIn2−xGaxO4:5 atom% Eu powders. The excitation
spectrum 共Fig. 3a兲 measured by monitoring the transition 5D0
→7F
2at 615 nm reveals that only several sharp lines were observed
at the region from 350 to 500 nm which are assigned to the f-f tran-sitions within the Eu3+ ions. The prominent peak around 467 nm corresponds to electric-dipole transition7F0→ 2D2which is consis-tent with a noncentrosymmetric site. It is suggested that the MIGO:Eu3+phosphor could be excited by the visible light with the
blue LED chip. In comparison with the conventional Eu-doped phosphors,6-8 the particularly noteworthy one is that no obvious charge transfer共CT兲 band of Eu3+-O2−interaction or host absorption band could be detected in the excitation spectra. This phenomenon is unusual because the typical Eu-activated phosphors always show strongly CT band absorption around 250-300 nm. While the absorp-tion edge of pure MgIn2O4is around 360 nm, it is recognized that
only direct excitation of Eu3+ions could be observed and no
effi-cient energy transfer occurs between activator and host. Addition-ally, the absence of CT band may be due to the weak covalency
Figure 2. SEMs of the MgIn1.8Ga0.2O4:5 atom % Eu3+powders prepared at 1400°C at共a兲 1000x and 共b兲 5000x magnification.
Figure 3. 共a兲 Excitation and 共b兲 emission spectra of the
MgIn1.8Ga0.2O4:5 atom % Eu3+powders prepared at 1400°C. H56 Electrochemical and Solid-State Letters, 8共7兲 H55-H57 共2005兲
H56
between Eu3+and O2−in the MgIn
2−xGaxO4crystallites. As shown
in Fig. 3b, the emission spectrum of MgIn2−xGaxO4:5 atom % Eu
excited under 467 nm presents the most intense peak around 615 nm attributed to the electric-dipole transition5D0→7F2which is hy-persensitive in structure symmetry. It is well known that: if the Eu3+
ions occupy the inversion symmetry center, only the magnetic-dipole transition5D0→7F1is expected in the emission spectrum; if not, the electric-dipole transition5D0→7F2 will dominate. In all prepared samples, the shapes of emission lines are similar and the peaks only differ in their intensities and intensity ratio of 5D0
→7
F2to5D0→ 7F1. The emission intensity ratio of5D0→7F2to
5D
0→ 7F1, called as asymmetry ratio, gives a measurement of the
degree of distortion from the inversion symmetry of the local envi-ronment around the Eu3+in the host.13
The asymmetry ratio for all synthesized samples x = 0.0, 0.1, 0.2, and 0.3 are 4.92, 8.96, 9.235, and 9.037, respectively. The increase of asymmetry ratio is presum-able due to Ga3+enters the host that decreases the local structure symmetry around Eu3+. When the Ga3+ concentration exceeds x
= 0.2, the drop of asymmetry ratio is attributed to the formation of second phase that increases the local structure symmetry around Eu3+. For all the prepared samples, it is recognized that Eu3+must occupy the noncentro symmetric sites, suggesting that Eu3+ ions
should occupy the distorted octahedral site. Besides, higher level transitions from 5D1 to 7FJ 共J = 0 ⬃ 3兲 in the region 500 ⬃ 550 nm are also detected which always appear at lower doping concentration and diminish via cross relaxation at higher doping level.
Figure 4 exhibits the typical decay curve of Eu3+ 5D0→7F2 emission 共615 nm兲 upon excitation into Eu3+ f-f transition at
467 nm共7F0→5D2兲 of MgIn1.8Ga0.2O4:5 atom % Eu prepared at 1400°C, and the life time of 5D0→ 7F2 emission within Eu3+ is estimated to be 0.439 ms. Since the life time of all prepared samples are also determined, it indicates that the life time gradually increases with arising the Ga concentration.
Figure 5 presents the luminescent intensity of5D0→7F2 transi-tion in terms of Ga3+concentration in MgIn
2−xGaxO4:5 atom % Eu
powders. The results reveal that the intensity of5D0→ 7F2 transi-tion gradually increases with Ga content and reaches the maximum of x = 0.2 and then gradually diminishes. The trend is consistent with the XRD results and associated with the asymmetry ratio.
Conclusion
The novel inverse-spinel type oxide phosphor MgIn2−xGaxO4: 5 atom % Er3+共x ⬍ = 0.3兲 was successfully
syn-thesized via the solid-state reaction process. In the structure, the
Eu3+ions occupy the distorted octahedral sites. In the
photolumines-cence excitation spectra, only the intense f-f transitions could be found without CT band because of the weak covalency between Eu3+and O2−in the MgIn2−xGaxO4crystallites. This phenomenon is
unusual for conventional Eu-activated phosphors. Under the excita-tion at 467 nm, the MIGO:Eu3+phosphors emit bright red emission at 615 nm which provides the potential as a blue light LED con-verted phosphor. With the incorporation of Ga3+ into the host, it
changes the degree of inversion symmetry around Eu3+ in the MgIn2−xGaxO4. Furthermore, the asymmetry ratio increases with the
Ga concentration and reaches the maximum of x = 0.2. The sample MgIn1.8Ga0.2O4: 5 atom % Eu3+phosphor has good emission
inten-sity.
Acknowledgments
The authors acknowledge the financial support from National Science Council of Taiwan, Republic of China, under contract no. NSC 91-2216-E-006-038.
National Cheng Kung University assisted in meeting the publication costs of this article.
References
1. R. T. Wegh, H. Donker, A. Meijerink, R. J. Lamminmaki, and J. Holsa, Phys. Rev. B, 56, 13841共1997兲.
2. M. P. Hehlen, A. Kuditcher, S. C. Rand, and S. R. Luthi, Phys. Rev. Lett., 82, 3050 共1999兲.
3. G. E. Malashkevich, G. I. Semkova, A. P. Stupak, and A. V. Sukhodolov, Phys. Solid State, 46, 1425共2004兲.
4. B. F. Lei, Y. L. Liu, J. Liu, Z. R. Ye, and C. S. Shi, J. Rare Earths, 22, 443共2004兲. 5. S. Koji and S. Fujihara, J. Electrochem. Soc., 151, H429共2004兲.
6. R. P. Rao, Solid State Commun., 99, 439共1996兲.
7. R. Schmechel, M. Kennedy, H. von Seggern, H. Winkler, M. Kolbe, R. A. Fischer, X. M. Li, A. Benker, M. Winterer, and H. Hahn, J. Appl. Phys., 89, 1679共2001兲. 8. B. S. Tsai, Y. H. Chang, and Y. C. Cheng, J. Mater. Res., 19, 1504共2004兲. 9. T. Moriga, T. Sakamoto, Y. Sato, A. H. K. Haris, R. Suenari, and I. Nakabayashi,
J. Solid State Chem., 142, 206共1999兲.
10. H. Kawazoe and K. Ueda, J. Am. Ceram. Soc., 82, 3330共1999兲.
11. T. Minami, S. Takata, T. Kakumu, and H. Sonohara, Thin Solid Films, 270, 22 共1995兲.
12. R. D. Shannon, Acta Crystallogr., Sect. A: Cryst. Phys., Diffr., Theor. Gen. Crys-tallogr., 32, 751共1976兲.
13. M. Nogami, T. Enomoto, and T. Hayakawa, J. Lumin., 97, 147共2002兲.
Figure 4. Decay curve of the MgIn2−xGaxO4:5 atom % Eu3+powders.
Figure 5. Luminescence intensity in terms of Ga3+ concentration in MgIn2−xGaxO4:5 atom % Eu3+powders prepared at 1400°C.
H57
Electrochemical and Solid-State Letters, 8共7兲 H55-H57 共2005兲 H57