國立臺灣大學工學院化學工程研究所 碩士論文
Graduate Institute of Chemical Engineering College of Engineering
National Taiwan University Master Thesis
利用液態氫源與雙功能鈀鈷的碳球在常溫常壓下製備 2,5-二甲基呋喃
Novel Synthesis of 2,5-Dimethylfuran under Ambient Conditions Utilizing ZIF-67 Derived Bifunctional Carbon Supported
Palladium and Cobalt with Aqueous Hydrogen Source
吳霈恩 Pei-En Wu
指導教授:吳嘉文 博士
Advisor: Kevin Chia-Wen Wu, Ph.D.
中華民國 103 年 7 月 July, 2014
I
誌謝
此研究論文能順利完成,首先要感謝我的指導老師吳嘉文在這兩年 的時間時常與我討論實驗及提供給我這個題目,此外也感謝老師給予 我完整的訓練,在實驗室的維護還有與廠商的溝通也都讓我有許多的 學習。再來要感謝學姊徐韶徽為這項研究貢獻了許多的想法還有方向 讓這項研究能順利完成,在這過程讓我對於實驗的構想有新的學習與 成長。
我也要感謝實驗室的各位陪伴我度過在實驗室的這兩年:感謝毓璞 和瑜婷常常提醒我關於一些行政的事項。感謝靖天跟我討論實驗,好 讓我可以得到改進實驗的想法。感謝有衡為我測量了許多材料的鑑定。
感謝亨達在材料製備上的測試。最後我要感謝大家一起維護實驗室的
環境,好讓我們可以有一個共同可以完成研究的空間。
II
ABSTRACT
The ever increasing demand for energy combined with the diminishing supply of
fossil fuel signals the need to search for an alternative energy source. 2,5-Dimethylfuran
(DMF) is a green and renewable fuel due to its lignocellulosic origin. The production of
DMF results from the hydrogenation and hydrogenolysis of 5-Hydroxymethylfurfural
(HMF). Hydrogenation processes often require purging the system with high pressure
hydrogen to increase the solubility of hydrogen in the solvent, all the while using high
temperatures for the hydrogenation reactions to occur. Herein, we proposed a novel
method in which DMF could be synthesized in high yields under atmospheric pressure
and room temperature.
A bifunctional Pd/CoNC material of ZIF-67 descent was synthesized in which
Palladium provides a hydrogenation surface and Cobalt catalyzes the production of
hydrogen from an aqueous source, Sodium Borohydride (NaBH4). The synergetic
effects of Cobalt and Palladium on the same support helped achieve 83.07% DMF
yields.
Keywords: Biomass, 2,5-Dimethylfuran, ZIF-67, hydrogenation, bifunctional.
III
摘要
由於能源的需求越來越大,加上石油的供應終將面臨短缺,有再 生能力並且環保的生質能源因此受到矚目。其中,由木質纖維素所製 備的 2,5-二甲基呋喃因性質接近汽油,因此可取代汽油或成為汽油添 加物。藉由氫化可以將 5-甲基糠醛轉換成 2,5-二甲基呋喃。氫化反應 大多需要高溫達成活化能與通入高壓氫氣提高氫氣於溶劑中的溶解值。
在此,我們提供一反應系統在室溫與室壓下即能製備 2,5-二甲基呋 喃。
此實驗由 ZIF-67(Zeolitic Imidazolate Framework)合成的雙功 能鈀鈷奈米孔洞碳材,鈀能提供氫化反應所需的金屬表面並利用鈷催 化氫硼化鈉可於液態產氫。鈀與鈷在同一材料上的協同作用使得我們 可以在室溫與室壓下得到 83.07% 產率的 2,5-二甲基呋喃。
關鍵字:生質能源、2,5-二甲基呋喃、ZIF-67、氫化反應、雙官能化
IV
TABLE OF CONENTS
1. INTRODUCTION ... 1
1.1. ENERGY CRISIS ... 1
1.2. BIOMASS DEVELOPMENT ... 4
1.3. BIOMASS CONVERSION ... 6
2. PAPER SURVEY ... 9
2.1. METAL ORGANIC FRAMEWORK (MOF) BASED CATALYSTS ... 9
2.2. INCIPIENT WETNESS IMPREGNATION37 ... 11
2.3. PRODUCTION OF 2,5-DIMETHYLFURAN ... 15
3. OBJECTIVE ... 20
4. EXPERIMENTAL ... 22
4.1. CHEMICALS AND MATERIALS ... 22
4.2. EQUIPMENT ... 23
4.3. PROCEDURE FOR PRODUCTION OF 2,5-DIMETHYLFURAN ... 24
4.3.1. Batch Reactions ... 24
4.3.2. Semi-Batch Reactions ... 26
4.4. CATALYST SYNTHESIS ... 28
4.4.1. ZIF-67 Synthesis ... 28
4.4.2. ZIF-67 to Pd/CoNC Conversion ... 30
4.5. CHARACTERIZATION... 31
4.5.1. Scanning Electron Microscope (SEM) ... 31
4.5.2. Transmission electron microscopy (TEM) ... 37
4.5.3. Specific Surface Area Analyzer ... 42
4.5.4. X-Ray Diffraction (XRD) ... 44
4.5.5. Thermogravimetric Analysis ... 46
4.5.6. Calibration Curve for DMF ... 48
4.5.7. Calibration Curve for MFAD ... 48
5. RESULTS AND DISCUSSION ... 49
V
5.1. HMF AS THE STARTING REACTANT ... 49
5.1.1. Effect of Catalyst Amount ... 49
5.1.2. Effect of Reaction Temperature ... 51
5.1.3. Effect of Reaction Time ... 51
5.1.4. Effect of NaOH addition ... 53
5.2. COMPARISON OF DIFFERENT STARTING REACTANTS ... 55
5.3. PALLADIUM AND COBALT ON SAME OR DIFFERENT SUPPORTS ... 57
5.4. REACTIONS STARTING WITH MFAD ... 58
5.4.1. With or Without Acid Addition ... 58
5.5. DIFFERENT STARTING REACTANTS UNDER OPTIMUM CONDITIONS ... 62
5.6. EFFECT OF ATM OR NON-ATM PRESSURE TESTS ... 63
5.7. SYNERGETIC EFFECTS OF COBALT AND PALLADIUM ... 64
6. CONCLUSION ... 66
7. FUTURE PROSPECTS ... 67
8. REFERENCE ... 69
VI
LIST of FIGURES
FIGURE 1.1ANNUAL ENERGY CONSUMPTION DATA.3 ... 2 FIGURE 1.2ANNUAL OIL PRODUCTION DATA.4 ... 2 FIGURE 1.3ANNUAL CRUDE OIL PRICES REPRESENTED BY CURRENT CURRENCY
AND MONEY OF THE DAY CURRENCY.4 ... 3 FIGURE 1.4PRODUCTION OF HMF, FROM CELLULOSE AND CARBOHYDRATES,
SERVES AS FEEDSTOCK FOR A RANGE OF CHEMICALS AND LIQUID FUELS.8 ... 6 FIGURE 2.1ZIF BOND ANGLES CORRESPONDING TO ZEOLITE BOND ANGLES.30 .. 10 FIGURE 2.2PHENOMENA OF TRANSPORT INVOLVED IN (A) WET IMPREGNATION
AND (B) DRY IMPREGNATION.THE SOLUTE MIGRATES INTO THE PORE FROM THE LEFT TO THE RIGHT OF THE FIGURES.37 ... 12 FIGURE 2.3PHENOMENA OF TRANSPORT INVOLVED IN (A) THE CONSTANT-RATE
PERIOD OF DRYING AND (B) THE FALLING-RATE PERIOD OF DRYING.THE
SOLVENT MIGRATES FROM THE LEFT TO THE RIGHT OF THE FIGURES.37 ... 13 FIGURE 2.4SYNTHETIC ROUTES TO OBTAIN DMF FROM HMF.48 ... 15 FIGURE 4.1REACTION SYSTEMS USED IN THE EXPERIMENT.(METHOD 1)BATCH
REACTIONS,(METHOD 2)SEMI-BATCH REACTIONS. ... 24 FIGURE 4.2PROCEDURE FOR THE SYNTHESIS OF ZIF-67. ... 29 FIGURE 4.3PROCEDURE FOR THE CONVERSION OF ZIF-67 TO PD/CONC. ... 29 FIGURE 4.4INCIPIENT WETNESS IMPREGNATION METHOD FOR THE DEPOSITION OF
PALLADIUM ON CONC. ... 30 FIGURE 4.5SEM IMAGES OF ZIF-67 SIZE CONTROL OF ZIF-67 WITH DIFFERENT
ORGANIC LINKER TO METAL SOURCE RATIO. ... 32 FIGURE 4.6SEM IMAGES OF ZIF-67 UNDER 500 NM MAGNIFICATION. ... 32 FIGURE 4.7SEM IMAGES OF CONC UNDER DIFFERENT CARBONIZATION
TEMPERATURES. ... 34 FIGURE 4.8SEM-EDS MAPPING IMAGES SHOWING HOMOGENEOUS DISTRIBUTION OF CO AND PD ON THE MATERIAL. ... 36 FIGURE 4.9ZIF-67TEM IMAGES THROUGH DIFFERENT MAGNIFICATIONS. ... 38 FIGURE 4.10TEM IMAGE OF CONC. ... 39 FIGURE 4.11TEMSELECTED-AREA ELECTRON DIFFRACTION PATTERNS OF CONC.
VII
... 39
FIGURE 4.12TEM IMAGE OF PD/CONC. ... 40
FIGURE 4.13PD/CONC WITH COBALT AND PALLADIUM PARTICLES SHOWN. ... 40
FIGURE 4.14FOCUSED TEM IMAGE ON COBALT PARTICLE. ... 41
FIGURE 4.15FOCUSED TEM IMAGE ON PALLADIUM PARTICLE. ... 41
FIGURE 4.16N2 ADSORPTION/DESORPTION ISOTHERM OF ZIF-67. ... 42
FIGURE 4.17N2 ADSORPTION/DESORPTION ISOTHERM OF CONC. ... 43
FIGURE 4.18XRD PATTERN OF ZIF-67 UNDER DIFFERENT PRECURSOR RATIOS. . 44
FIGURE 4.19XRD PATTERN OF ZIF-67 AND CONC. ... 45
FIGURE 4.20STANDARD XRD PATTERN OF COBALT. ... 45
FIGURE 4.21MAGNETISM DEMONSTRATED IN CONC. ... 46
FIGURE 4.22WEIGHT LOSS PROFILE OF ZIF-67 TO CONC CONVERSION. ... 47
FIGURE 4.23CALIBRATION CURVE FOR DMF. ... 48
FIGURE 4.24CALIBRATION CURVE FOR MFAD. ... 48
FIGURE 5.1YIELD OF DMF VARYING CATALYST AMOUNTS.4.5 MLTHF IN 7 ML VIAL,0.05 G HMF,0.06 G NABH4,1 MLDIWATER,303K. ... 50
FIGURE 5.2YIELD OF DMF VARYING REACTION TEMPERATURES.4.5 MLTHF IN 10 MLVIAL,0.05 G HMF,0.06 G NABH4,1 MLDIWATER,0.1 G CATALYST. ... 50
FIGURE 5.3DMF YIELD VARYING REACTION TIME.4.5 MLTHF IN 10 MLVIAL, 0.05 G HMF,0.06 G NABH4,1 MLDIWATER,0.1 G CATALYST. ... 52
FIGURE 5.4DMF YIELD VARYING REACTION TIME.4.5 MLTHF IN 7 MLVIAL, 0.05 G HMF,0.06 G NABH4,1 MLDIWATER,0.1 G CATALYST. ... 52
FIGURE 5.5DMF YIELD WITH OR WITHOUT NAOH ADDITION.4.5 MLTHF IN 7 MLVIAL,0.05 G HMF,0.06 G NABH4,0.14 MLDIWATER +NAOH,0.1 G CATALYST,3 HR. ... 54
FIGURE 5.6DMF YIELD WITH NAOH ADDITION VARYING TEMPERATURE.4.5 ML THF IN 7 MLVIAL,0.05 G HMF,0.06 G NABH4,0.14 MLDIWATER +NAOH, 0.1 G CATALYST,3 HR. ... 54
FIGURE 5.7DMF YIELD WITH PD AND CO LOCATION VARIATION.4.5 MLTHF IN 7 MLVIAL,0.05 G HMF,0.06 G NABH4,1 MLDIWATER,303K. ... 58
FIGURE 5.8SCHEME FOR BATCH AND SEMI-BATCH REACTIONS DETERMINING THE TIMING FOR THE ADDITION OF SODIUM BOROHYDRIDE. ... 60
FIGURE 5.9COMPARISON OF BATCH OR SEMI-BATCH YIELDS. ... 60
VIII
FIGURE 5.10DMF YIELD WITH OR WITHOUT H2SO4 ADDITION.4.5 MLTHF IN 20
MLVIAL,39 ΜLMFAD,0.06 G NABH4,30 WT%NAOH SOLUTION IN PUMP, 0.1 G CATALYST,303K,0.34 ML/HR FOR 3 HR, THEN 1 HR REACTION TIME.(8
ΜLH2SO4 ADDED IF REQUIRED.) ... 61 FIGURE 5.11DMF YIELD WITH ADDITION OF VARYING AMOUNTS OF H2SO4.4.5
MLTHF IN 10 MLVIAL,39 ΜLMFAD,0.06 G NABH4,30 WT%NAOH
SOLUTION IN PUMP,0.1 G CATALYST,303K,0.34 ML/HR FOR 3 HR, THEN 1 HR REACTION TIME. ... 62 FIGURE 5.12DMF YIELD STARTING WITH DIFFERENT REACTANTS.4.5 MLTHF IN
10 MLVIAL,0.06 G NABH4,30 WT%NAOH SOLUTION IN PUMP,0.1 G
CATALYST,303K,1ATM,0.34 ML/HR FOR 3 HR, THEN 1 HR REACTION TIME. (EQUAL MOL OF REACTANT) ... 63 FIGURE 5.13ATMOSPHERIC AND NON-ATMOSPHERIC PRESSURE TESTS. ... 64 FIGURE 5.14COMPARISON OF CATALYST WITH PALLADIUM OR COBALT ONLY. ... 65
IX
LIST of TABLES
TABLE 2.1PAST WORKS ON DMFSYNTHESIS. ... 19
TABLE 4.1PARTICLE SIZE OF ZIF-67 UNDER DIFFERENT PRECURSOR RATIOS. ... 33
TABLE 4.2SEM-EDS ANALYSIS OF ZIF-67. ... 35
TABLE 4.3SEM-EDS ANALYSIS OF CONC. ... 35
TABLE 4.4SEM-EDS ANALYSIS OF PD/CONC. ... 36
TABLE 4.5CONC UNDER DIFFERENT CALCINATIONS TEMPERATURES. ... 43
TABLE 5.1YIELD OF DMF STARTING FROM DIFFERENT REACTANTS. ... 56
1
1. INTRODUCTION
1.1. Energy Crisis
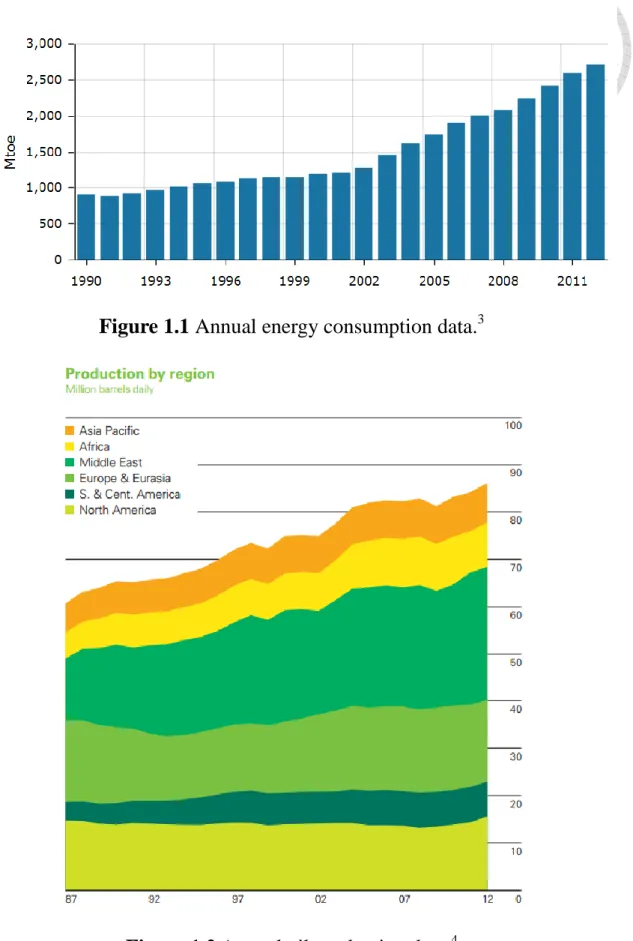
The diminishing supply of fossil fuel calls for the rise of alternative energy sources. As Jevons Paradox proposed in 1865, the demand for energy would only increase even if energy-saving or efficient devices were invented. Reasons could be attributed to the ever increasing population or the advancement of technology and the high demand for luxurious lifestyles.
On Figure 1.1, China was taken as an example, since it is currently one of the most intensely developing countries. The energy consumption has increased by 106 Million Tonnes of Oil Equivalent from 2012 to 2013. The International Energy Agency and the Organization for Economic Co-operation and Development has defined one Toe to be equal to 41.868 GJ.1,2 As the demand for energy continues to increase, there has to be other sources of energy, because it is now common knowledge that petroleum reserves would one day run out.
2
Figure 1.1 Annual energy consumption data.
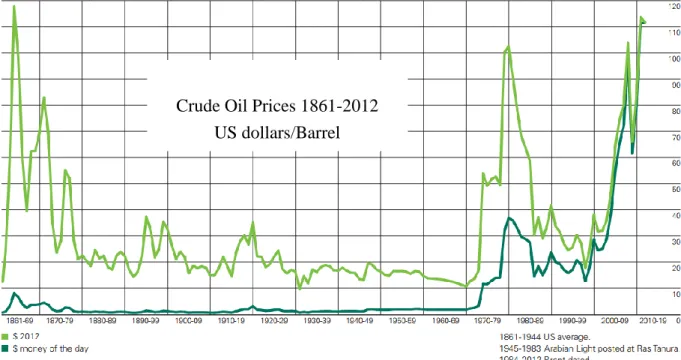
3Figure 1.2 Annual oil production data.
4Even though Figure 1.2 shows that the production of oil is still rising as of now,
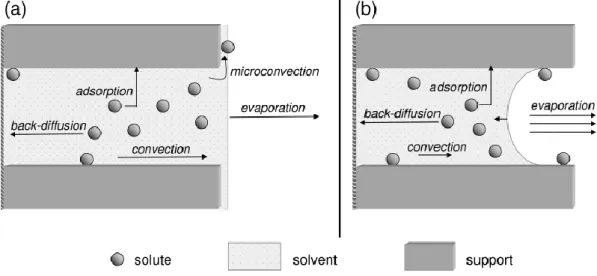
3
it can be seen in Figure 1.3 that the price of oil is also increasing significantly. It is therefore ideal to find other sources of energy that could replace or relieve the intense use of fossil fuels.
Figure 1.3 Annual crude oil prices represented by current currency and money of the day currency.
4Extensive research has been done on alternatives to fossil fuels. Solar, wind, hydro and geothermal energy comes to mind, however, these alternatives are dependent on the geology, time of day, or maybe even seasonal changes. A more transferable or stable source of energy has to be realized. Biomass holds many of these fine qualities to make it a suitable candidate. Biomass absorbs and stores solar
Crude Oil Prices 1861-2012 US dollars/Barrel
4
energy chemically, making it stable.2,5-Dimethylfuran (DMF), which is a biomass derived fuel, holds properties that are similar to gasoline, therefore making it incentive to study the production of DMF.5,6
1.2. Biomass development
The development of biomass can be categorized into three generations. The first generation of biomass utilizes agricultural crops because their composition contains high lipid/oil or sugar contents. Biodiesel and bioethanol can be produced from these crops. Over the last few decades, innumerable works have been published regarding the conversion of this feedstock to energy. However, the competition of using this feedstock for energy and using them as our food supply makes it difficult to rely on this source.
Second generation biomass utilizes agricultural wastes that are also high in lipid/oil and sugar content. These agricultural wastes are often lignocellulosic matter.
Lignocellulose is composed of Cellulose, Hemicellulose and Lignin. Lignocellulosic biomass is a viable option in that (a) it is abundantly available on earth, (b) it does not coincide with our food supply, (c) a positive net energy gain (NEG) can be obtained from the conversion process. Similar products such as biodiesel and bioethanol could also be produced from lignocellulose. The key difference lies in that lignocellulose is
5
composed of strongly polymerized structures that are recalcitrantly sturdy. After going through hydrolysis, the collected sugar units could be used as feedstock to produce fuel.
Third generation biomass utilizes micro-algae as the main source of feedstock.
This feedstock is also largely dependent on the geology and environment, since large masses of micro-algae has to be able to be grown for this alternative to be realized.
Since this research does not focus on third generation biomass, it will be concluded here that second and third generation biomass does not conflict with each other and there is no clear winner of these two, it all depends on the geology and environment of the production site.
6 1.3. Biomass Conversion
As Figure 1.4 has shown, Cellulose (A component of Lignocellulose) can be hydrolyzed into glucose, and then Glucose can be isomerized into Fructose. Lastly, fructose can be dehydrated into 5-Hydroxymethylfurfural (HMF), a reactant in which a lot of the building block chemical synthesis works have been based on. Numerous works have been done on the hydrolysis of Cellulose into glucose. Even direct hydrolysis of raw crops has been researched quite extensively over the past few years.7
Figure 1.4 Production of HMF, from cellulose and carbohydrates, serves
as feedstock for a range of chemicals and liquid fuels.
87
Three generations of biomass pretreatment and hydrolysis methods have be categorized in a review by Sathitsuksanoh et al.9 The first generation devises a one-step biomass dissolution and hydrolysis. The second generation goes through biomass dissolution first, followed by enzymatic hydrolysis. The third generation utilizes lignocellulose fractionation. The first generation is mainly based on the use of concentrated acids, which is raw-material independent, however it poses some disadvantages, such as product separation difficulties, acid recovery and acid re-concentration.10-12 The second generation mainly focuses on the use of enzymes;
the use of enzymes could overcome some of the difficulties faced by the first generation, however, other problems such as high costs, corrosive and toxic properties of pretreatment solvents.13,14 Third generation methods involve the use of fractionation, overcoming separation difficulties faced by the first generation methods, fractionation could achieve continuous processes through the use of acids and ionic liquids under modest reaction conditions.15,16
Works on the isomerization of glucose to cellulose or even cellulose oligomers to fructose have been done.17 Particularly, work on cellulose-to-HMF conversion have been studied extensively over the past few years and high yields could also be achieved.18-22 Selection of the most suitable method could be made over large quantities of works for the production of HMF, one-step or one-pot synthesis methods
8
are also now available. However, despite large quantities of works and researches on the synthesis of HMF, the research on the synthesis of DMF seems rather neglected. It is therefore what this research aims to search for options and alternatives to add to works on DMF synthesis.
9
2. PAPER SURVEY
2.1. Metal Organic Framework (MOF) based catalysts
Metal Organic Frameworks are inorganic (Metal component) and organic units linked together to form a structure with high degrees of crystallinity. It has recently gained widespread popularity due to its versatility to be shaped differently through the use of different metal nodes and linkers, which often give them different properties or functionalities. Often compared with Zeolites, MOFs show similar characteristics to Zeolites. Generally, MOFs are thermal and chemically stable, and contain micropores which grant them large surface areas of 1000 to 10,000 m2/g. Recently, Postsynthetic Modification (PSM) through covalent bond exchanges of MOFs have also been studied to make MOFs even more versatile in terms of applications.23 With these attractive characteristics, MOFs can be applied to a wide variety of applications such as gas storage, gas separation, catalysis and sensors.24 Over the last decade, MOFs have been widely explored as potential catalysts.25-29 Specifically, the class of Zeolitic Imidazolate Frameworks (ZIF) will be discussed here, since the catalyst used here is derived of such origins.
As suggested by the name, ZIF uses imidazolate units as linkers to form a structure with M-Im-M angles of 145°, similar to Si-O-Si angles in Zeolites. ZIF
10
possesses tetrahedral topologies
Figure 2.1 ZIF bond angles corresponding to Zeolite bond angles.
30The specific material used in this research is ZIF-67, it was chosen because it contains Cobalt as the metal node, which would be used to catalyze the catalysis of hydrogen production from sodium borohydride.31 The synthesis of ZIF-67 and its calcination into cobalt supported on carbon has also gained attention quite recently.32-36 It is convenient to have the cobalt metal homogeneously distributed on the product, rather than using different methods to load the metals onto the material.
11 2.2. Incipient Wetness Impregnation
37One of the most widely used industrial methods of preparing supported precious metal catalysts combines impregnation and drying. This is a relatively easy method that deposits metals onto supports through physical means. Impregnation is when the liquid phase comes into contact with a solid phase, and the liquid phase is absorbed by the solid phase. A typical impregnation involves allowing a precursor solution containing the metal source to be absorbed into a solid support. The precursor is chosen according to the price and its physicochemical properties. The affinity of the precursor towards the solid support will determine the effect of the impregnation. The particle size of the precursor is also a determining factor, since its interaction with the pore of the solid will determine the effect of the impregnation.
Fick’s Law
Darcy’s Law
When the liquid phase volume exceeds the volume of the pores on the support, wet/diffusional impregnation is given as the name of the method.38-42 Fick’s law of diffusion, the adsorption capacity of the surface and the adsorption equilibrium constant governs this type of impregnation. When the liquid phase volume is equal to the volume of the pores on the support, the method is named dry impregnation. For
12
this type of impregnation, other effects come into play, such as the pressure driven
capillary flow of the solute inside the pores. Figure 2.1 shows these phenomena in illustration. This phenomenon can be described by Darcy’s Law.
Figure 2.2 Phenomena of transport involved in (a) wet impregnation and (b) dry impregnation. The solute migrates into the pore from the left to
the right of the figures.
37When the precursor solution is impregnated inside the pores of the support, the mixture is dried to remove the solvent, while the metal stays inside the pores of the support. Typical procedures involve heating in an oven to the boiling point of the solvent with or without selected gas flows. Heating rate and final heating temperatures can all affect the adsorption of the precursor on the pore surfaces. The balance between adsorption, back-diffusion and convection determines the
13
distribution of the precursor inside the pores.43-46 When the convective flow of the solvent counters the vapor removal flow, a constant-rate period is achieved as shown in Figure 2.2(a). This is usually the case when the heating rate and the drying temperature are high, the solvent front recedes into the pores and the evaporation occurs inside the pores. When the convective flow is slower than the vapor removal flow, a falling-rate period is achieved as shown in Figure 2.2(b). This is usually the case when the heating rate and the drying temperature are low, the solvent front stays at the surface of the support and loss of the precursor particles can occur through microconvection. The drying regime is defined as slow if the constant-rate period predominates, and as fast if it is the falling-rate period.
Figure 2.3 Phenomena of transport involved in (a) the constant-rate period of drying and (b) the falling-rate period of drying. The solvent
migrates from the left to the right of the figures.
3714
Other methods of metal deposition onto the supports could be explored, such as the stirring of the support in metal precursor solutions all the while adding in reducing agents to deposit the metal onto the supports. A convenient method that could deposit metal with an even distribution onto the supports would be attractive. Deposition to form chemical bonds between support and metals would also help make the metals more firmly attached on the material, which could lead to good recyclability.
15 2.3. Production of 2,5-Dimethylfuran
It has been proposed that the production of DMF from HMF will go through two pathways as shown in Figure 2.4. Both of these pathways involve the hydrogenation and hydrogenolysis of HMF and its intermediates.47
Figure 2.4 Synthetic routes to obtain DMF from HMF.
48Since HMF is a widely known chemical platform, most of the works on DMF synthesis has been conducted starting with HMF. HMF is a chemical platform that is often synthesized from hexoses such as fructose through dehydration reactions.
Earlier works of DMF synthesis often start with fructose. Herein, focus will be put on HMF to DMF conversions.
Sudipta and Basudeb et al. synthesized DMF from HMF in a sequential reaction that starts with fructose.49 A yield of 32% DMF could be achieved from fructose under conditions stated in Table 2.1. Binder and Raines et al. also synthesized DMF from HMF in a sequential reaction that starts from fructose.50 The reaction conditions
HMF
MFAD
BHMF MFM
DMF
16
were a follow up of the work of Román-Leshkov and Dumesic et al.47 A yield of 32.5% DMF could be achieved from fructose in this work. Chidambaram and Bell et al. demonstrated tests in ionic liquid systems and obtained a yield of 32% DMF under EMIMCl with addition of acetonitrile.51 It is mentioned in their work that the solubility of hydrogen inside the solvent is a determining factor for the efficiency of the hydrogenation reaction. Under the same conditions they compared four different metals for DMF synthesis which are Palladium, Platinum, Ruthenium and Rhodium.
They found that Carbon supported Palladium shows the best results.
Thananatthanachon and Rauchfuss et al. used Pd/C as catalyst with formic acid as a liquid hydrogen source and deoxygenation agent at the same time.52 A different term was given for aqueous hydrogenations, which is transfer hydrogenation, distinction of this mechanism with traditional hydrogenation can be made by determining whether hydrogen gas is produced or not. Transfer hydrogenation does not need production of hydrogen gas; traditional hydrogenations require production of hydrogen gas. The novelty of this work resides in that no pressured hydrogen gas is needed, which saves a lot of energy. Jungho and Dionisios et al. used Ru/C catalyst with 2-propanol as hydrogen source for transfer hydrogenation.53 It is claimed in their work that no homogeneous acid is used in the reaction as compared to the work of Thananatthanachon’s group. They mentioned that using 2-propanol as a hydrogen
17
donor is attractive due to its green derivation. Alcohols can be readily produced from biomass and the dehydrogenated products can be recycled by hydrogenation, although this requires yet another step with hydrogenation.
Regarding works on using Ru/C as a catalyst, Junhua and Shijie et al.
demonstrated that 60.3% DMF yield could be obtained under the conditions in Table 2.1.54 Yanhong and Yanqin et al. used Ru/Co3O4 as catalyst to obtain high yields of 93.4% DMF under the conditions in Table 2.1.48 It is reported in their work that Ruthenium plays the role of carbonyl group to hydroxyl group conversion. In fact, most of the works have reported that carbonyl to hydroxyl group conversions can be done easily, where they proposed that C-O bond cleavage (hydrogenolysis) is the determining step. Therefore they used Co3O4 as the catalyst for C-O bond cleavage.
One of the earliest works on DMF synthesis dates back to 2007, where Román-Leshkov and Dumesic et al. synthesized DMF starting from either fructose or HMF.47 A bimetallic copper and ruthenium catalyst (Cu-Ru/C) was used for the conversion of HMF to DMF. They proposed that due to the copper having lower surface energy than ruthenium, a two-phase system develops on the catalyst in which the copper coats the ruthenium. This was needed because during their sequential reaction from fructose to HMF, chloride ions were present, and poisoning of the copper on the catalyst could occur.55 Yields of 71% DMF could be achieved in
18
purified solvents with chloride ions absent. Another work with heterogeneous bimetallic catalyst by Nishimura and Ebitani et al. introduces Palladium and Gold supported on Carbon.56 They claim to achieve 96% yields under atmospheric pressure with moderate temperature as shown in Table 2.1. The presence of gold on the catalysts does indeed improve the yield as the reactants were increased and the catalyst amount was decreased. Huang and Fu et al used a bimetallic Nickel and Tungsten Carbide catalyst to catalyze the reaction under the reaction conditions given in Table 2.1.57 It was reported in their work that Nickel shows excellent hydrogenation abilities, however its selectivity was bad therefore tests were conducted with tungsten carbide. Tungsten carbide shows excellent selectivity towards the hydrogenolysis of alcohol groups into methyl groups, basically a deoxygenation reaction. This leads them to come up with a catalyst that contains lower amounts of Nickel for the conversion of HMF to an intermediate with both hands switched into alcohol groups then the high amount of Tungsten Carbide would convert the alcohol groups into methyl groups producing DMF. In the last work on bimetallic catalysts to date, Wang and Schuth et al made a catalyst of Platinum and Cobalt nanoparticles encased in hollow carbon nanospheres and conducted the reaction under the conditions listed in Table 2.1.58 They have attributed the high yield of 98% to the interaction between the Cobalt and Platinum alloy, because tests with Platinum or Cobalt supported alone
19
resulted in low yields.
Table 2.1 Past Works on DMF Synthesis.
Catalyst Reactants Reaction
Condition
DMF Yield [%]
Ref
Cu-Ru/C (79 mg) HMF H2 (6.8 bar),
220°C, 10h 49 50
Pd/C (2.13 mg Pd) HMF (126 mg), EMIMCl, acetonitrile
120°C, H2 (62
bar), 1h 15 51
Pd/C (0.4 g)
HMF (0.25 g), FA (0.78 mL), H2SO4 (14
mL), THF (10 mL)
70°C, 15 h 95 52
Ru/C (0.8 g) THF (10 mL), H2SO4
(35 μL) 75°C, 15h 24 49
Cu-PMO (100 mg)
HMF (100 mg),
ScMeOH (3 mL) 260°C, 3h 48 59
Ru/Co3O4 (0.1 g) HMF (0.25 g), THF (10 mL)
H2 (0.7 MPa),
130°C, 24h 93.4 48
Cu-Ru/C (0.75 g) HMF (2.5 g), Cu:Ru = 3:1, 1-butanol (47.5 g)
260°C, H2 (6.8
bar), 10h 71 47
Pd/C
HMF:Pd/C = 5:1, H2O:CO2 = 0.32:1,
H2O (1 mL)
H2 (1 MPa), ScCO2 (10 MPa), 80°C, 2h
100 60
Ru/C (20 wt%) HMF (0.75 g),
n-butanol (25 mL)
H2 (0.01475 mol/g HMF),
260°C, 1.5h
60.3 54
Ru/C (100 mg, 5 wt%)
HMF (240 mg),
2-propanol (24 mL) N2 (2.04 MPa) 81 53 7Ni-30W2C/AC
(120 mg)
HMF (1 mmol), THF (12 mL)
H2 (4MPa),
180°C, 3h 96 57
Pd50Au50/C (31.3 mg)
HMF (1 mmol), THF (10 mL)
H2 (1atm, 4L),
60°C, 12h 96 56
Pt-Co@HCS (50 mg)
HMF (2mmol), Butanol
H2 (10bar),
180°C, 2h 98 58
20
3. OBJECTIVE
The core idea of this research stems from the functions of our catalyst. Our catalyst contains Palladium and Cobalt, as the name Pd/CoNC implies. It is textbook and common knowledge that precious metals such as Pt, Pd and Ru provide a surface for which hydrogenation reactionsoccur.61-64 It is therefore suitable that we apply our catalyst to hydrogenation reactions. Hydrogenation reactions require a source of hydrogen whether it comes from directly supplying the system with hydrogen gas or indirect methods such as transfer hydrogenation.65-67
Sodium Borohydride (NaBH4) is known to be able to produce hydrogen gas when reacted with water as shown in Eq. 1.20,21 This means that the production of hydrogen occurs inside the solution, which possibly provides a higher chance of contact between hydrogen atoms and the reaction sites, therefore NaBH4 has been chosen as our source of hydrogen.
NaBH
4+ (2+x)H
2O→ NaBO
2·xH
2O + 4H
2(-210 kJ mol
-1)
68(Eq. 1)
It is known that Cobalt can catalyze the hydrolysis of NaBH4 solution to have a higher hydrogen generation rate and produce a larger total amount of hydrogen.69-73
21
Therefore our catalyst shows bifunctionality towards hydrogenation reactions, producing hydrogen at a faster rate and providing a surface for which the reactions can occur.
The chosen reaction for our research is the conversion of 5-methylfurfural to 2,5-Dimethylfuran. As discussed in the paper survey section. This reaction requires two hydrogenation reactions in total, of which one is the conversion of an aldehyde group to an alcohol group and the other is a hydrogenolysis reaction.
The objective of this research is to achieve a facile method of 2,5-Dimethylfuran synthesis under atmospheric pressure and room temperature while using an aqueous hydrogen source to obtain high yields. The advantages of atmospheric pressure and room temperature are that it provides a safe environment for synthesis, since highly pressured hydrogen gas at high temperatures can be quite dangerous. The reaction is also energy efficient because it does not require additional heating and purging with pressurized hydrogen gas. The use of aqueous hydrogen sources other than transfer hydrogenation on biomass conversion will also be explored here for the first time.
22
4. EXPERIMENTAL
4.1. Chemicals and Materials
Chemical Company
2,5-Bis(hydroxymethyl)furan (BHMF) Polysciences
2,5-Diformylfuran(DFF) Aldrich
2,5-Dimethylfuran (DMF) Aldrich
2-Methylimidazole Aldrich
5-Hydroxymethylfurfural (HMF) Aldrich
5-Methylfurfural (MFAD) Aldrich
Carbon Supported Palladium (5 wt%) Aldrich Cobalt (II) Chloride Hexahydrate Sigma-Aldrich Hydrochloric Acid (HCl) Sigma-Aldrich Magnesium Sulfate (MgSO
4) Yakuri Chemicals
Palladium (II) Chloride Aldrich
Sodium Borohydride (NaBH
4) Aldrich Sodium Hydroxide (NaOH) Sigma-Aldrich Sulfuric Acid (H
2SO
4) Sigma-Aldrich
Tetrahydrofuran (THF) Sigma-Aldrich
23 4.2. Equipment
Equipment Type
Centrifugator Sigma 3-30KS
Ultrasonicator Qsonica, Ultrasonic processor Part No.Q700
Lyophilizer Eyela FDU-1200
Gas Chromatography-Mass Spectrometer- Flame Ionization detector (GC-MS)
HP-5ms
X-Ray Diffractometer (XRD) Rigaku, Ultima IV
Specific Area and Pore Size
Distribution Instrument Micromeritics ASAP 2010 Scanning Electron Microscope
(SEM) Nova
TMNanoSEM 230
TGA PERKIN ELMER PYRIS 1
Syringe Pump KDS-100
Calcination Oven Thermoscientific Lindberg Blue M
24
4.3. Procedure for production of 2,5-Dimethylfuran
Owing to the fact that aqueous hydrogen source that produces hydrogen gas has been used here for the first time in the production of 2,5-Dimethylfuran, the experimental procedure was modified several times over the course of discovering the best system for the production of 2,5-Dimethylfuran. Two of the main reaction systems were discussed here:
Figure 4.1 Reaction systems used in the experiment. (Method 1) Batch Reactions, (Method 2) Semi-Batch Reactions.
4.3.1. Batch Reactions
For a standard experiment procedure, 0.4 mmol of 5-methylfurfural (MFAD),
25
varying amounts of Pd/CoNC catalyst, 4.5 mL of tetrahydrofuran (THF) and a magnetic stir bar were added in a 7 or 10 mL vial to be stirred for 30 min to ensure quality distribution of the reactant throughout the catalyst surface. 0.06 g of Sodium Borohydride (NaBH4) was then added right before addition of 1 mL of de-ionized water into the vial. After the addition of water, there would be intense bubbling, so the cap should be sealed as soon as possible. Parafilm was wrapped around the cap to ensure no loss of hydrogen gas produced. The reaction was placed in a water bath of varying temperatures for varying durations of reaction.
For reactions with addition of Sodium Hydroxide (NaOH), the reactant was 5-Hydroxymethylfurfural (HMF) instead of MFAD. 4.5 mL of THF with 0.1 g of Pd/CoNC catalyst were added as with the procedure of standard tests. After 30 minutes of stirring, de-ionized water was added with NaOH (0.14 mL). It can be observed that there is mild bubbling. The vial was then put in a water bath of varying temperatures for 3 hours.
For reactions with addition of acids, the reactant was also HMF instead of MFAD. 4.5 mL of THF with 0.1 g of Pd/CoNC catalyst were added as with the procedure of standard tests. For the addition of H2SO4, 1.6 μL of H2SO4 was added with 1 mL of de-ionized water after 30 minutes of stirring. For addition of HCl, 2 μL of HCl was added instead. The reaction was then put in a water bath of 30°C for 3
26
hours.
After the reaction, the catalysts were collected with a magnet and the product solution was poured into a 20 mL vial. Magnesium Sulfate (MgSO4) was added to remove the water from the product solution for the safety of the Mass Spectroscopy.
The MgSO4 solid was filtered with a syringe and a filter disk. Finally, the solution was analyzed by GC-MS with the Agilent HP-5ms Column.
4.3.2. Semi-Batch Reactions
For semi-batch tests, 0.1 g of Pd/CoNC catalyst was prepared in a 10 mL vial with a magnetic stir bar. 0.4 mmol of MFAD was added with 4.5 mL of THF. The aqueous hydrogen source of NaBH4 (0.06 g) in 30 wt% NaOH solution (1 mL) was prepared by addition of 0.14 mL of NaOH solution with 0.86 mL of de-ionized water in a 4 mL vial to create a basic environment. Then NaBH4 was added to the solution, slow and minor bubbling can be observed. The solution was quickly transferred into a syringe on a syringe pump, while varying amounts of H2SO4 acid was added into the reaction vial. The reaction vial was then placed in a 30°C water bath and the NaBH4 solution was introduced into the reaction vial (10 mL) with a syringe pump at an injection rate of 0.34 mL per hour. For atmospheric pressure tests, a syringe needle was placed on top of the reaction vial to achieve constant atmospheric pressure. After
27
the NaBH4 solution (1 mL) was fully injected into the reaction vial, the hydrogenolysis reaction was performed for an additional hour. The catalyst was collected with a magnet and the product solution was treated with the same method as in batch reaction experiments. Finally, the solution was analyzed by GC-MS with the Agilent HP-5ms Column.
28 4.4. Catalyst Synthesis
The detailed synthesis methods are presented in the following paragraphs and several processes are shown in the figures below:
4.4.1. ZIF-67 Synthesis
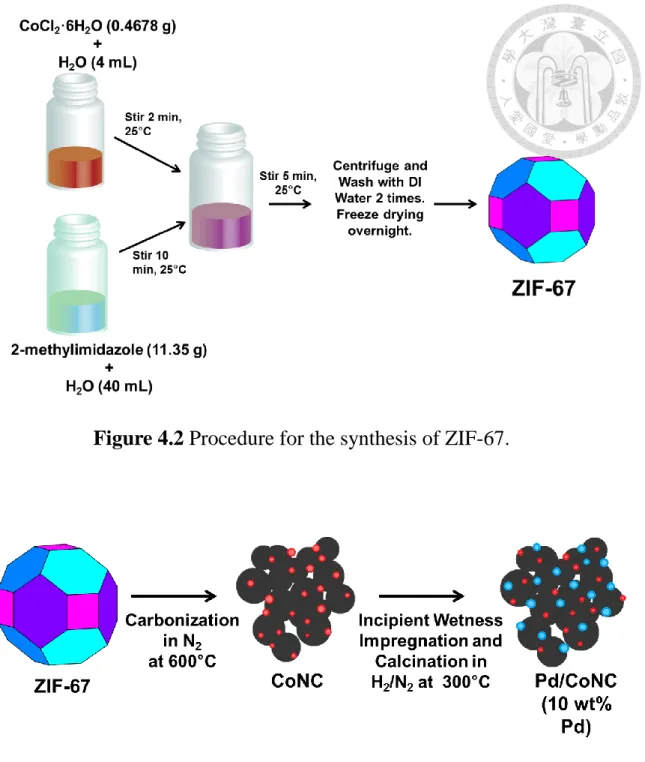
To synthesize ZIF-67, 2-methyl imidazole (11.35 g) was dissolved in 40 mL deionized water and Cobalt(II) Chloride (0.4678 g) was dissolved in 4 mL deionized water. When 2-methyl imidazole was fully dissolved in water, aqueous Cobalt(II) Chloride was added into the 2-methyl imidazole solution. After stirring for five minutes at room temperature, the appearance of the mixture turns from carmine to purple. The solution was then centrifuged and washed with deionized water several times. The collected solid was then vacuum-dried in the lyophilizer overnight.
29
Figure 4.2 Procedure for the synthesis of ZIF-67.
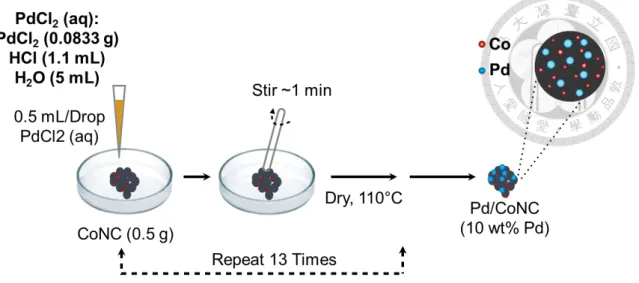
Figure 4.3 Procedure for the conversion of ZIF-67 to Pd/CoNC.
30
Figure 4.4 Incipient wetness impregnation method for the deposition of Palladium on CoNC.
4.4.2. ZIF-67 to Pd/CoNC Conversion
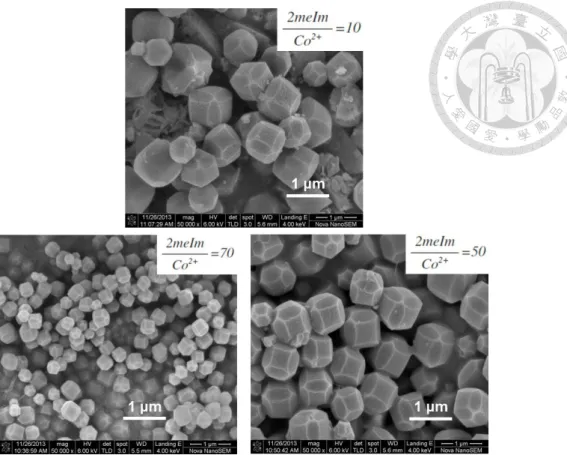
To remove 2-methyl imidazole from the solid and obtain cobalt on carbon, dried ZIF-67 was put in an oven and sintered under nitrogen flow. The sintering program starts from room temperature to 200oC with a heating rate of 5oC per minute. It was held at 200oC for 1 hour, and then heated to 600oC with a heating rate of 5oC per minute. After holding it at 600oC for 3 hours, it was cooled to room temperature and the collected solid was grinded to obtain Co/NC. The 10 wt% Pd/CoNC catalysts were prepared by incipient wetness impregnation, using an aqueous solution containing Palladium(II) Chloride. Palladium(II) Chloride (0.0833 g) was dissolved in 1.1 mL of concentrated HCl first, and then 5 mL of deionized water was added. The precursor solution with Pd2+ was dropped gradually (0.5 mL) onto the CoNC, keeping
31
an incipient wetness liquid/solid ratio of 1mL per gram and then placed in the oven at 110oC. To reach the desired content of Pd, the same method was repeated several times. After the impregnation process, the dried powder was calcined at 300oCfor one hour with a heating rate of 5oC in H2 (5 wt%) /N2(95 wt%) flow to obtain Pd/CoNC as the final product.
4.5. Characterization
4.5.1. Scanning Electron Microscope (SEM)
The morphology of the samples was observed with SEM (NovaTM NanoSEM 230). All samples were dissolved in ethanol to form a clear solution followed by 5 min sonication. 10 uL of the sample-containing solution was dropped onto either a copper grid or carbon tape (200 mesh, Formvar-covered and carbon–coated). Before SEM observations, the grids were kept under vacuum and subjected to Pt coating for 120 seconds by sputtering at a current of 20 mA. SEM-EDS data was obtained using the same instrument.
32
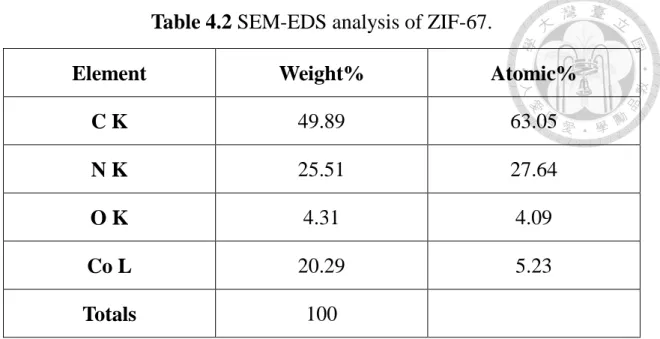
Figure 4.5 SEM images of ZIF-67 size control of ZIF-67 with different organic linker to metal source ratio.
Figure 4.6 SEM images of ZIF-67 under 500 nm magnification.
500 nm
33
As shown from Figure 4.4, we can see that size control of ZIF-67 particles is possible through the use of different organic linker to metal source ratios. We can also see from Table 4.1 organized below that a ratio of 70 equates to the smallest particle size, and a smaller particle size often equates to a larger surface area. Therefore we have selected a ratio of 70 as the optimum ratio.
Table 4.1 Particle size of ZIF-67 under different precursor ratios.
2-MeIm/Co
2+Diameter
(nm)
Cubic Length (nm)
70 385 162
50 951 487
10 1080 488
34
Figure 4.7 SEM images of CoNC under different carbonization temperatures.
As shown in the SEM images, it can be seen that calcination temperatures higher than 600°C destroys the uniform morphology of the CoNC particles. Therefore 600°C was chosen as the optimum temperature for the calcination of ZIF-67 into CoNC particles.
35
Table 4.2 SEM-EDS analysis of ZIF-67.
Element Weight% Atomic%
C K 49.89 63.05
N K 25.51 27.64
O K 4.31 4.09
Co L 20.29 5.23
Totals 100
Table 4.3 SEM-EDS analysis of CoNC.
Element Weight% Atomic%
C K 43.95 67.21
N K 11.25 14.75
O K 4.88 5.6
Co L 39.91 12.44
Totals 100
36
Table 4.4 SEM-EDS analysis of Pd/CoNC.
Element Weight% Atomic%
C K 44.29 70.76
O K 10.74 12.88
Cl K 11.60 6.28
Co L 27.93 9.09
Pd L 5.44 0.98
Totals 100
Figure 4.8 SEM-EDS mapping images showing homogeneous
distribution of Co and Pd on the material.
37
As seen from the SEM-EDS analysis and mapping, we can see that Cobalt is homogeneously distributed and the wt% of Cobalt is also high on the material. On the other hand, the distribution of palladium on the material is homogeneous, however from the SEM-EDS analysis, the content of palladium is significantly lower than what we have expected. This could be due to the difficult operation of the incipient wetness impregnation. Increasing the number of impregnations or lowering the acidity of the precursor solution could remedy this problem.
4.5.2. Transmission electron microscopy (TEM)
The ZIF-67, CoNC and Pd/CoNC samples were sent to NIMS, Japan for analysis of the structure and electron diffraction of the materials. The samples were analyzed with a JEM-2010 TEM system operated at 200 kV.
38
Figure 4.9 ZIF-67 TEM images through different magnifications.
As can be observed from the Figure 4.9, the particle sizes of ZIF-67 were about 300 nm in average. Rhombic dodechedral shapes were also observed. From Figure 4.10, there is a homogeneous distribution of Cobalt on CoNC, Cobalt can be observed as darker dots inside the large particle. As seen in Figure 4.11, CoNC contains polycrystallinity, shown as circles surrounding a center.
39
Figure 4.10 TEM image of CoNC.
Figure 4.11 TEM Selected-area electron diffraction patterns of CoNC.
40
Figure 4.12 TEM image of Pd/CoNC.
Figure 4.13 Pd/CoNC with Cobalt and Palladium Particles shown.
41
Figure 4.14 Focused TEM image on Cobalt particle.
Figure 4.15 Focused TEM image on Palladium particle.
From the TEM images of Pd/CoNC, it is observed that a single Pd/CoNC particle is about 300 to 400 nm in size, and it contains a homogeneous distribution of Palladium and Cobalt inside the particle. The Palladium and Cobalt particles are very
42
small in size, at 6 nm maximum.
4.5.3. Specific Surface Area Analyzer
The nitrogen adsorption/desorption isotherm was measured with Micromeritics ASAP 2010. The specific surface area was evaluated correspondingly. Samples were dehydrated at 100oC to avoid misevaluating the dried weight. After cooling to room temperature, the samples were analyzed under 77K.
Figure 4.16 N
2adsorption/desorption isotherm of ZIF-67.
43
Figure 4.17 N
2adsorption/desorption isotherm of CoNC.
Table 4.5 CoNC under different calcinations temperatures.
Carbonization Temperature (°C)
Specific Surface Area
(m
2/g)
Micropore Area (m
2/g)
Micropore Area %
600 448.56 238.4 53.1
800 347.08 78 22.5
1000 180.09 25.6 14.2
44
From the surface area analysis we can see that ZIF-67 does show a high surface area of 1800 m2/g, however after the carbonization, the surface area has lowered significantly and from SEM images, we can relate the low surface area to the collapse of the network. Choosing the highest surface area, a carbonization temperature of 600°C was chosen.
4.5.4. X-Ray Diffraction (XRD)
Wide-angle patterns of powder X-ray diffraction (XRD) were measured on Rigaku Ultima IV with Cu Kα radiation (λ=1.5418 Å) to check the crystallinity.
Figure 4.18 XRD pattern of ZIF-67 under different precursor ratios.
45
Figure 4.19 XRD pattern of ZIF-67 and CoNC.
Figure 4.20 Standard XRD pattern of Cobalt.
From the XRD analysis, we can see from Figure 4.10 that a precursor ratio of 10 produces amorphous ZIF-67. Figure 4.11 shows the XRD analysis of CoNC, where a standard of Cobalt shows that there is in fact slight appearance Cobalt. The broad peak could be attributed to the small particle size according to Scherrer’s equation.
46
However from Figure 4.13, the material shows magnetic properties, meaning there is metal content in the material, which could only be Cobalt.
Figure 4.21 Magnetism demonstrated in CoNC.
4.5.5. Thermogravimetric Analysis
The program for the thermogravimetric analysis was done under an increasing temperature range of 30°C ~800°C with a temperature increase rate of 5°C/min.
Magnetism
47
Figure 4.22 Weight loss profile of ZIF-67 to CoNC conversion.
From the weight loss, we can see that a calcination temperature of 600°C converts most of the ZIF-67 particles into CoNC particles. Even though temperatures higher than 600°C continue to convert the particles into CoNC, it was shown previously that higher calcination temperatures decrease the surface area of the material.
48 4.5.6. Calibration Curve for DMF
Figure 4.23 Calibration Curve for DMF.
4.5.7. Calibration Curve for MFAD
Figure 4.24 Calibration Curve for MFAD.
y = 5E-07x + 0.4462 R² = 0.9996
0 20 40 60 80 100
0.0E+00 1.0E+08 2.0E+08 3.0E+08
Y iel d (% )
Peak Area
DMF Calibration Curve
y = 6E-07x - 6.8203 R² = 1
0 20 40 60 80 100
0.0E+00 1.0E+08 2.0E+08 3.0E+08
Y iel d (% )
Peak Area
MFAD Calibration Curve
49
5. RESULTS and DISCUSSION
5.1. HMF as the starting reactant
The experiment uses HMF as a starting reactant because it is a well-known chemical platform in which most of the DMF synthesis works have been using as a starting reactant.
5.1.1. Effect of Catalyst Amount
It can be seen below in Figure 5.1 that 0.1 g of catalyst proves to be the most efficient amount as increasing the amount to 0.15 g decreases the yield. Although some may argue that increasing the catalyst amount further would enhance the catalytic activity, having a balanced reactant to catalyst ratio would be more important in understanding the capabilities of a catalyst. Although some may argue that there may be errors involved in these tests, running more trials on these tests may seem trivial since none of the yields exceed 10%.
50
Figure 5.1 Yield of DMF varying catalyst amounts. 4.5 mL THF in 7 mL Vial, 0.05 g HMF, 0.06 g NaBH
4, 1 mL DI Water, 303K.
Figure 5.2 Yield of DMF varying reaction temperatures. 4.5 mL THF in 10 mL Vial, 0.05 g HMF, 0.06 g NaBH
4, 1 mL DI Water, 0.1 g Catalyst.
0 2 4 6 8 10
0.03 0.06 0.1 0.15
Y iel d (% )
Catalyst Amount (g)
Effect of Catalyst Amount
0 2 4 6 8 10 12 14
30 50 80
Y iel d (% )
Temperature (°C)
Effect of Temperature
51 5.1.2. Effect of Reaction Temperature
As shown in Figure 5.2, 353K proves to be the most suitable for the synthesis of DMF. Going against the goals of this research, temperature variables were still tested because yields would not exceed 15% at this point. Since most of the other works have conducted this reaction under higher temperatures, it was guessed that maybe temperature was the key to this reaction. After these tests, it was proven that temperature does effect the yield of this reaction, but the key to a massive increase of the yield for this reaction lies somewhere else.
5.1.3. Effect of Reaction Time
The results shown in Figure 5.3 suggest that a notable increase of DMF yield occurs at 3 hours. Figure 5.3 and 5.4 are conducted under different reaction containers.
Figure 5.4 shows higher yield due to the suspected higher pressure related with the smaller amount of reactor volume. Nonetheless, it can be concluded that even after 9 hours, the yield of DMF remains at about 10%, meaning 3 hours is the optimum reaction time. It is also favored to have a shorter reaction time.
52
Figure 5.3 DMF yield varying reaction time. 4.5 mL THF in 10 mL Vial, 0.05 g HMF, 0.06 g NaBH
4, 1 mL DI Water, 0.1 g Catalyst.
Figure 5.4 DMF yield varying reaction time. 4.5 mL THF in 7 mL Vial, 0.05 g HMF, 0.06 g NaBH
4, 1 mL DI Water, 0.1 g Catalyst.
0 1 2 3 4 5 6
1 2 3
Y iel d (% )
Reaction Time (hr)
Effect of Reaction Time
0 2 4 6 8 10
3 9
Y iel d (% )
Reaction Time (hr)
Effect of Reaction Time
53 5.1.4. Effect of NaOH addition
After trying out several obvious and easily tunable variables, the problem could be confirmed to be elsewhere, therefore the addition of NaOH was considered. Our source of hydrogen comes from NaBH4, and the rate of hydrogen production is determined by the acidity of solution it is dissolved in. Solutions of higher acidity will increase the rate of hydrogen production while lower acidity will decrease the production rate. The high hydrogen production rate could lead to unused hydrogen gas that would rise to the top of the reactor due to the low solubility of hydrogen gas in most solvents. When the hydrogenation rate is significantly lower than the hydrogen production rate, there would be less contact between hydrogen gas and the active site. Therefore it is thought that a slower hydrogen production rate will help achieve a steady state of hydrogen usage and production. It could be argued that increasing the amount of NaBH4 would lead to the same result, but it would be most efficient if the least NaBH4 could be used. It can be seen on Figure 5.5 that addition of NaOH does indeed slow down the production of hydrogen, which leads to lower yields under 3 hours of reaction. Temperature varying tests were also given to show that even under reaction at 353K, DMF yield could not exceed that of reactions without NaOH additions.