國立臺灣大學工學院環境工程學研究所 碩士論文
Graduate Institute of Environmental Engineering College of Engineering
National Taiwan University Master Thesis
台北地區小規模住戶及學校自來水含鉛濃度調查 及新水龍頭鉛溶出研究
Study of Tap Water Lead Concentration in Selected Residences and Schools at Greater Taipei Area and Investigation of Lead
Leaching from New Faucet
郭顯定 Xian-Ting Koid
指導教授:林逸彬 博士 Advisor: Yi-Pin Lin, Ph.D.
中華民國 109 年 6 月 June 2020
誌謝
首先非常感謝指導教授林逸彬博士在這兩年求學期間對我的細心指導,讓我不論在 實驗規劃、報告撰寫或獨立思考的能力都有很大的成長。
還記得我在碩一的時候,由於剛進入環境工程領域,本身對實驗規劃還不太了解。
很慶幸在那時候儀秦、冠博、建佑、澤軒學長姐對我的指點和協助,使得我在研究這條路 上逐漸步入軌道。這兩年中,儀秦學姐對我論文或計劃報告的撰寫都提供了許多寶貴的意 見,讓我獲益匪淺。另外,我也很感謝東瑩和魏駿在我一開始去住戶及學校採水樣時給予 協助,才得以讓一切順利進行。東營在我對台灣交通狀況和規則還不熟悉時適時的給予我 指導,才讓我得以安全地執行採樣工作。
感謝儀秦、冠博、建佑、澤軒、建豪、東瑩、魏駿、張悅、宜芳、佳君、靖雯、正 欣的互相砥礪。也正因為有大家在一起努力,學術研究這條路才不孤單,反而因大家的互 相扶持而充滿溫馨和歡樂。
最後非常感謝家人在求學期間給予我經濟上的支持,使得我可以在無後顧之憂的情 況下完成學業,並順利地完成論文。我會永遠愛你們。
非常感謝大家的幫忙與鼓勵,讓這篇論文可以順利完成。僅以本論文獻給各位,再 一次真心感謝在這兩年研究生涯中陪伴我的每一位。
摘要
鉛管自 1980 年代開始被世界各國禁止使用於配水系統中。然而,鉛仍時常被用來
製造管材元件,從而導致自來水鉛污染及危害人體健康。本研究針對台北地區的 20 個住
戶(包含 10 戶鉛管換管戶和 10 戶無鉛管戶)及 10 所學校進行五次實地自來水採樣以了解自 來水含鉛概況,並且購買新黃銅水龍頭及無鉛水龍頭安裝於國立台灣大學一館舍內,以調
查3 個月左右之鉛溶出狀況。本研究分析住戶及學校自來水總鉛和溶解鉛濃度,並探討鉛
濃度與各水質參數的相關性。在新水龍頭實驗中,則檢測分析總鉛、銅、鋅、鐵和溶解鉛、
銅、鋅、鐵濃度以探討鉛濃度與銅、鋅、鐵濃度的相關性。此外,本研究使用單粒子感應 耦合電漿質譜儀(single particle inductively coupled plasma mass spectrometry, spICP-MS),檢 測及量化鉛、銅、鋅、鐵奈米顆粒的粒徑分佈、粒子數濃度和粒子濃度。實驗結果顯示,
在現地住戶及學校採樣分析的研究中,大部分自來水樣品的鉛濃度不高,僅有一個樣品超 過台灣飲用水含鉛量標準 (10 μg/L)。鉛濃度與各水質參數則無相關性。在新水龍頭實驗中,
其中一個黃銅水龍頭於前兩個禮拜左右釋出高濃度鉛(最高達 24.3 μg/L) ,而無鉛水龍頭於 實驗期間皆釋出低濃度鉛(<6 μg/L)。 其中一個黃銅水龍頭的鉛奈米顆粒濃度隨時間逐漸 下降,而另外兩個黃銅水龍頭的鉛奈米顆粒濃度則大幅波動。總/溶解鉛與總/溶解鋅和銅 於黃銅水龍頭中具有相關性,而鉛奈米顆粒濃度於無鉛水龍頭和管道系統中的銅、鋅、鐵 奈米顆粒濃度則具有相關性。
關鍵字: 鉛、自來水 、採樣方法 、水質參數、奈米顆粒
Abstract
Lead pipes were banned from use in distribution system in the 1980s. Nevertheless, lead is frequently utilized as an additive in plumbing components, which can endanger the public health by causing lead contamination in tap water. In this study, lead survey campaign consisting of five sampling events were conducted for 20 residential premises and 10 schools at the Greater Taipei Area. In addition, brand new brass faucets and lead-free faucets were purchased and installed in a building on the National Taiwan University campus to investigate the leaching of lead for around 3 months. Total lead and soluble lead were analyzed in both field research and new faucet study.
Various water quality parameters were measured in the field research to study the relationship between lead concentration and each water quality parameter. Total and soluble copper, zinc, iron were analyzed in the new faucet study to investigate their correlations with lead concentration.
Furthermore, size distribution, number concentration and mass concentration of lead, copper, zinc, iron nanoparticles were analyzed using single particle inductively coupled plasma mass spectrometry (spICP-MS) in the new faucet research. In the lead survey campaign, most samples had low lead concentrations, with only one sample exceeded the Taiwan drinking water standard (10 μg/L). There were no correlations between lead concentration and various water quality parameters. In the new faucet study, one brass faucet released high level of lead (maximum 24.3 μg/L) initially for about two weeks while lead-free faucet released low level of lead concentration (<6 μg/L) in tap water. The mass concentration of lead nanoparticles reduced gradually over time in one brass faucet but fluctuated greatly in the other two brass faucets. Total/soluble lead were correlated with total/soluble copper and zinc in brass faucet while lead nanoparticle mass concentration was correlated with copper, zinc and iron nanoparticle mass concentrations in new lead-free faucet and the plumbing system.
Keywords: Lead, tap water, sampling method, water quality parameter, nanoparticle
Contents
誌謝... I 摘要... II Abstract ... III Contents ... V Content of figures ... VII Content of tables ... IX Abbreviations ... XI
Chapter 1 Introduction ... 1
1.1Background ... 1
1.2 Research objectives ... 2
Chapter 2 Literature review ... 3
2.1 Toxicity of lead and drinking water standard for lead ... 3
2.2 Lead contamination incidents ... 4
2.3 Sampling methods for lead ... 6
2.4 Relationship between lead concentration and water quality parameter ... 7
2.5 Incidental nanoparticles in drinking water ... 8
Chapter 3 Materials and Methods ...11
3.1 Sampling campaign for residences and schools ...11
3.2 Investigation of lead release from new faucets ... 15
3.3 Analytical methods... 17
3.4 Statistical analysis ... 18
Chapter 4 Results and Discussions ... 20
4.1 Lead concentration in tap water in selected residences and schools ... 20
4.2 Correlation between water quality parameters and lead concentration ... 26
4.3 Release of lead from new faucet ... 29
4.4 Lead particle mass concentration in tap water in new faucet study ... 36
Chapter 5 Conclusions and Recommendations ... 44
5.1 Conclusions ... 44
5.2 Recommendation for future study ... 45
Reference List ... 47
Appendix A ... 51
Appendix B ... 58
Appendix C ... 61
Appendix D ... 67
Appendix E ... 71
Appendix F... 74
Content of figures
Figure 1. Locations of residences and schools sampled in this study. ... 13 Figure 2. Installation of new faucets. (a) Lead-free faucet 1; (b) Lead-free faucet 2; (c) Brass faucet 1; (d) Brass faucet 2; (e) Brass faucet 3 ... 16 Figure 3. Illustration of sampling protocols employed in the new faucet study. ... 16 Figure 4. Lead concentration in tap water of selected residences and schools (random daytime sampling). *represents filtered sample ... 22 Figure 5. Lead concentration in tap water of selected residences and schools (first draw sampling).
*represents filtered sample ... 24 Figure 6. Comparison of total lead concentration between two sampling methods. *represents filtered sample ... 25 Figure 7. Correlation between lead concentration and water quality parameters (a) Total lead vs.
Turbidity; (b) Total lead vs. Temperature; (c) Total lead vs. pH; (d) Total lead vs. Free chlorine residual; (e) Soluble lead vs. Turbidity; (f) Soluble lead vs. Temperature; (g) Soluble lead vs. pH;
(h) Soluble lead vs. Free chlorine residual. ... 28 Figure 8. The total and soluble lead concentration in tap water collected from five new faucets. 32 Figure 9. Correlation between lead concentration and copper, zinc and iron concentration (a) Total lead vs. total copper; (b) Total lead vs. total zinc; (c) Total lead vs. total iron; (d) Soluble lead vs.
soluble copper; (e) Soluble lead vs. soluble zinc; (f) Soluble lead vs. soluble iron. ... 34 Figure 10. The mass concentration, mean size and number concentration of lead particles in tap water collected from brass faucets. ... 39 Figure 11. The mass concentration, mean size and number concentration of lead particles in tap water collected from lead-free faucets. ... 40
Figure 12. Correlation between mass concentration of lead particle and copper, zinc, iron particles in brass faucet, lead-free faucet and plumbing system before faucet: (a) Lead vs. copper; (b) Lead vs. zinc; (c) Lead vs. Iron... 42 Figure 13. The total and soluble copper concentration in tap water collected from five new faucets.
... 68 Figure 14. The total and soluble zinc concentration in tap water collected from five new faucets.
... 69 Figure 15. The total and soluble iron concentration in tap water collected from five new faucets.
... 70 Figure 16. The raw data of lead particles on 26/2/2020 in the new faucet study. ... 72 Figure 17. The size distribution of lead particles on 26/2/2020 in the new faucet study. ... 73 Figure 18. The mass concentration, mean size and number concentration of copper particles in tap water collected from brass faucets. ... 75 Figure 19. The mass concentration, mean size and number concentration of copper particles in tap water collected from lead-free faucets. ... 76 Figure 20. The mass concentration, mean size and number concentration of zinc particles in tap water collected from brass faucets. ... 77 Figure 21. The mass concentration, mean size and number concentration of zinc particles in tap water collected from lead-free faucets. ... 78 Figure 22. The mass concentration, mean size and number concentration of iron particles in tap water collected from brass faucets. ... 79 Figure 23. The mass concentration, mean size and number concentration of iron particles in tap water collected from lead-free faucets. ... 80
Content of tables
Table 1. Basic information of residences and schools. ... 14 Table 2. The maximum flow rate of each new faucets. ... 17 Table 3. Comparison of weighted average total lead concentration between different sampling methods. Values in the table are p-values. Significant differences (p<0.05) are shown in red colors.
... 33 Table 4. Correlation between lead concentration and copper, zinc, iron concentration in brass faucet, lead-free faucet and plumbing system before faucet. Significant correlations (p<0.05) are shown in red colors. ... 35 Table 5. Comparison of lead particle mass concentration between different sampling methods.
Significant differences (p<0.05) are shown in red colors. ... 41 Table 6. Correlation between mass concentration of lead particle and copper, zinc, iron particles in brass faucet, lead-free faucet and plumbing system before faucet. Significant correlations (p<0.05) are shown in red colors. ... 43 Table 7. Water quality parameter data of school in first sampling campaign. ... 61 Table 8. Water quality parameter data of residences with lead pipe replacement in first sampling campaign. ... 62 Table 9. Water quality parameter data of residences without lead pipe in first sampling campaign.
... 62 Table 10. Water quality parameter data of school in second sampling campaign. ... 63 Table 11. Water quality parameter data of residences with lead pipe replacement in second sampling campaign. ... 64 Table 12. Water quality parameter data of residences without lead pipe in second sampling
campaign. ... 64 Table 13. Water quality parameter data of school in third sampling campaign. ... 65 Table 14. Water quality parameter data of residences with lead pipe replacement in third sampling campaign. ... 66 Table 15. Water quality parameter data of residences without lead pipe in third sampling campaign.
... 66
Abbreviations
Sample label
FD1: First draw sampling 100 mL FD2: First draw sampling 900 mL F1: Flush sampling 100 mL F2: Flush sampling 900 mL
R1: Random daytime sampling 100 mL R2: Random daytime sampling 900 mL
ENPs: Engineered nanoparticles HDPE: High density polyethylene
ICP-MS: Inductively coupled plasma mass spectrometry LCR: Lead and Copper Rule
spICP-MS: Single particle inductively coupled plasma mass spectrometry USEPA: United States Environmental Protection Agency
Chapter 1 Introduction
1.1 Background
Lead is highly toxic. Lead poisoning can cause severe deterioration of physical and mental health in human. In the 1980s, most countries have banned the use of lead pipe in distribution system. However, old lead pipes remain in the distribution system and lead is often used as an additive in brass plumbing materials. Previous study has shown that new lead-bearing plumbing component can leach dangerous levels of lead (Lei et al., 2018).
In recent decades, many lead contamination events have been reported unceasingly. In 2003, high level of lead in tap water was detected in thousands of residences in Washington DC due to a switch of disinfectant from chlorine to chloramine (Edwards and Dudi, 2004; Renner, 2004). Due to the change of source water from Lake Huron to Flint River and discontinued employment of corrosion inhibitor, dangerous levels of lead were found in tap water in Flint, Michigan (Torrice, 2016; Olson et al., 2017; Pieper et al., 2018). 2797 residences in Chicago, Illinois have tested for lead in tap water between 2016 and 2018 and one third of the residences have detected elevated levels of lead with the highest concentration reaching 250 μg/L (Byrne and Hawthorne, 2018;
Hawthorne and Reyes, 2018). US Government Accountability Office has reported that only 43%
of school districts have conducted lead testing for school drinking water in 2016- 2017, in which 37% of them have found high levels of lead in drinking water, damaging the health of around 10 million students (US Government Accountability Office, 2018). Between 2014 and 2018, 11 cities in Canada have participated in a large-scale tap water lead testing. One third of the 12000 sample have lead levels exceeding 5 μg/L (BBC News, 2019). Therefore, survey of lead in tap water is
crucial to understand the extent and scale of the problem.
It has been shown that corrosion of pipeline can cause leaching of lead nanoparticles in tap water (Venkatesan et al., 2018). However, comparison of lead nanoparticle concentration between different sampling protocols and correlation between lead nanoparticle and other metallic nanoparticles have never been reported. Therefore, first draw sampling, flush sampling and random daytime sampling were employed in this study to collect tap water from new brass faucets and lead-free faucets to study the release of lead nanoparticles observed in the three sampling methods. Correlations between lead nanoparticle and copper, zinc, iron nanoparticle were investigated.
1.2 Research objectives
The objectives of this thesis are:
1. To investigate lead levels in tap water in selected residential premises and schools at the Greater Taipei Area.
2. To study the lead release from new brass faucets and new lead-free faucets.
3. To investigate the release of lead nanoparticle from the corrosion of new faucets and distribution system.
4. To examine the correlation between the mass concentrations of lead nanoparticles and copper, iron and zinc nanoparticles.
Chapter 2 Literature review
2.1 Toxicity of lead and drinking water standard for lead
Lead has been widely used in the manufacturing of plumbing materials used in the water distribution system due to its high malleability, ductility and resistance to corrosion. In addition to lead pipe, which has been banned in most countries in the 1980s, many plumbing components (especially brass) contain lead as an additive (Dudi et al., 2005; Lei et al., 2018).
Exposure to lead has detrimental effects on the reproductive, renal, hematopoietic and central nervous system (CorySlechta, 1996; Flora et al., 2012). Children are more vulnerable to the damaging effect on neurological system compared to adults and may suffer from lower intelligence and short-term memory impairment (Needleman, 2004). Permanent brain damage and death may occur if the children are exposed to higher levels of lead (Cleveland et al., 2008).
Furthermore, lead poisoning can lead to cardiovascular disease and hypertension in human (Flora et al., 2012).
The Maximum Contaminant Level Goal of lead in drinking water is 0 μg/L (USEPA, 1991), which means that exposure to any amount of lead can cause deterioration of human health.
However, it is extremely difficult to entirely remove lead in drinking water. In order to strike a balance between water treatment cost and public health, countries around the globe have set their own lead standard. United States Environmental Protection Agency (USEPA) established Lead and Copper Rule in 1991, with lead action level set as 15 μg/L (USEPA, 1991). This action level means that if the 90th percentile of the lead concentration of in all water samples measured exceeded 15 μg/L, the water system needs to take actions, such as notifying the customers, implementing corrosion control measures, replacing lead service lines and public education. The
World Health Organization (WHO) has proposed a provisional guideline value of 10 μg/L (WHO, 2011), which has been adopted by many countries as their standards; Taiwan has updated the lead standard from 50 μg/L to 10 μg/L since 2013/12/25 (Taiwan EPA, 2008, 2017); Canada has revised the maximum acceptable concentration (MAC) of lead from 10 μg/L to 5 μg/L since 2019 (Health Canada, 2019).
2.2 Lead contamination incidents
Lead contamination incidents have been discovered with ever-increasing frequency in recent decades, which greatly threaten the public health. In 2001, Washington DC switch its disinfectant from chlorine to chloramine, which causes the lead concentration in tap water to spike (Edwards and Dudi, 2004). A survey carried out between 2001-2003 shows that the blood lead concentration in children was 4 times compared to that in 2000 (Edwards et al., 2009). In 2006, Portland, Oregon offered free water quality test. Out of 3205 tap water samples, 2.5% of them exceed 15 μg/L, with the highest lead concentration reaching 910 μg/L (Renner, 2010). Massive lead contamination in drinking water occurred at Flint, Michigan on 2015. The drinking water source was changed from Lake Huron to Flint River in 2014. The new source water was more corrosive but corrosion control was not implemented. Water quality survey revealed that 40% of households with their lead concentration in tap water exceeded the lead action level and the highest lead concentration reached 13,200 μg/L (Torrice, 2016; Olson et al., 2017; Pieper et al., 2018).
After the Flint incident, Natural Resources Defense Council acquired the Lead and Copper Rule (LCR) violation record of each state from USEPA and found that there were 5363 cases of LCR violation in 2015, which negatively affected the health of 18 million people (Olson and Fedinick, 2016). USEPA had admitted the underreporting of LCR violations (USEPA, 2015). Most
surprisingly, the database showed that Flint was in compliance with LCR because an inadequate sampling procedure, i.e., flush sampling which avoided collection of potentially most contaminated water, was employed for lead testing. The result indicates that there could be many lead contamination cases left undiscovered in the US (Olson and Fedinick, 2016). In 2018, 57 out of 86 schools in Detroit violated the LCR, which caused the city to shut off drinking water supply in all schools (Nir, 2018). A report published by US Government Accountability Office in 2018 showed that only 43% of school districts in the US had tested for lead between 2016 and 2017. Of those, 37% of school districts found high levels of lead in tap water, which threatens the health of approximately 10 million students (US Government Accountability Office, 2018). Researchers in Harvard University compiled the data of lead testing for 10888 schools across 12 states in the US between January 2016 and February 2018. The report showed that 4777 (44%) of those schools had one or more outlets with high lead level that violated the state standard. Moreover, 57152 out of 485152 first draw samples had lead concentrations exceeding the state standard (Cradock et al., 2019). A report published by Environment America Research & Policy Center and US PIRG Education Fund compiled the lead contamination incidents happened at schools in each state (Rumpler and Dietz, 2019). To name a few, 83% of the school buildings in New York City have at least one tap exceed the LCR action level, with the highest lead concentration reaching 3200 μg/L; a total of 183 water sampling points at schools in Milwaukee exceeded 15 μg/L; 8630 tap water samples were measured in schools in Washington state, wherein 60.8 % samples were above 1 μg/L.
Many lead contamination incidents have also been reported in other countries. In 2002, lead testing at 95 new houses in Sydney area revealed that 60% of the first draw samples exceeded Australian Drinking Water Guidelines (10 μg/L), in which the highest lead concentration was 442
μg/L. The lead source was identified to be the household lead-bearing plumbing devices (Rajaratnam et al., 2002). In 2015, some public housing sections in Hong Kong found lead in their tap water exceeded 10 μg/L (Water Supplies Department, 2017). A survey of lead concentration in tap water of 212 households in New South Wales, Australia found that 8% of them exceeded 10 μg/L and lead-bearing faucet was the main lead source (Harvey et al., 2016). A survey on the National Taiwan University campus found that four out of seven sampling points in an old building had lead levels exceeding the Taiwan drinking water standard (10 μg/L) and two of those sampling points had lead concentrations reaching 165 μg/L and 150 μg/L respectively (NgLiu et al., 2018).
From year 2014 to 2018, 11 cities in Canada participated in a large-scale lead test. Out of 12,000 samples, one third of them exceeded the guideline value of lead in Canada (5 μg/L) and 18% of the samples exceeded 15 μg/L. Old lead pipes still remained in the water distribution system were found to be the main lead source (BBC News, 2019).
2.3 Sampling methods for lead
First draw sampling, which is conducted by collecting one liter of tap water after a minimum stagnation period of 6 hours, is employed for lead testing in the US to comply with Lead and Copper Rule (USEPA, 1991). Ideally, the result of this sampling method indicates the worst- case scenario as lead was accumulated during the prolonged stagnation period. The disadvantage of this sampling method is the lead source that is not located within the first liter tap water is not detected (Sandvig et al., 2009). In addition, the lead concentration may be distorted by dilution from the water stood in plumbing component with low lead content adjacent to the faucet (Flora et al., 2012).
In UK, compliance for lead is ensured by applying random daytime sampling (Drinking
Water Inspectorate, 2010). This sampling method requires collection of one liter tap water at random period during the day without prior flushing at randomly selected sampling points (IWA, 2012). The lead concentration varies randomly due to the different stagnation periods in the pipe system. This sampling protocol has the advantage of reflecting the true lead exposure of residents under typical daily water usage. Furthermore, randomly selected sampling locations produce result that is more representative and unbiased (IWA, 2010). Nevertheless, the number of samples need to be large (if possible, at least 200) to ensure the reproducibility of results (IWA, 2012).
Flush sampling is conducted by collecting sample after flushing for 2 to 5 minutes (IWA, 2012). This sampling method is indicative of the presence of lead source in fresh water in the distribution system (IWA, 2010). However, this sampling method is not able to detect the lead released from the premise plumbing, which leads to underestimation of true lead exposure of residents.
In Taiwan, flush sampling was chosen as the sampling method before 2018/10/15 (Taiwan EPA, 2015). New sampling method (NIEA W101.56A) was employed thereafter, which mandates tap water sampling with a maximum flow rate of the faucet and without prior flushing (Taiwan EPA, 2018).
Employment of different sampling methods are needed to study the lead-leaching pattern of plumbing component in premise plumbing and identify the presence of lead source in distribution system. This thesis is the first study to apply the new Taiwan sampling protocol for lead testing.
2.4 Relationship between lead concentration and water quality parameter
Previous laboratory studies have found that lead concentration in tap water was influenced
by water quality parameters like pH, disinfectant, temperature in well-controlled experimental conditions (Schock, 1990; Noel et al., 2014). The soluble lead concentration typically increases as pH value decreases due to the enhanced solubility of lead corrosion scale (Kim et al., 2011). High redox potential is maintained if free chlorine is used as a disinfectant, which leads to the formation of a protective layer of lead dioxide corrosion product on the inner lead pipe surfaces. The lead release rate is greatly reduced because lead dioxide has very low solubility (Xie and Giammar, 2011; Triantafyllidou et al., 2015). Higher temperature is associated with higher lead concentration due to greater solubility product constant and faster dissolution rate (Schock, 1990). Most field studies, however, found no clear correlations between lead concentration and water parameters (Cartier et al., 2011; Del Toral et al., 2013; Chang and Lin, 2019), except one research found that four out of eight homes in a field study in Providence, RI, have higher dissolved lead levels in summer than in winter, which was attributed to greater dissolution rate of lead under a higher temperature (Masters et al., 2016).
2.5 Incidental nanoparticles in drinking water
Occurrence of engineered nanoparticles (ENPs) in natural waters has been an emerging research topic (Wiesner et al., 2006; Boxall et al., 2007; Ema et al., 2010). Previous studies have shown that ENPs can be effectively removed by drinking water treatment plant (Good et al., 2016).
After leaving drinking water treatment plant, treated water move through kilometers of pipe before domestic outlets, during which corrosion of premise plumbing materials may cause release of incidental nanoparticles into tap water (Westerhoff et al., 2018). It has been shown that nano-sized lead dioxide particles can increase the toxicity and bioavailability of lead consumption in humans by releasing lead ions through reductive dissolution (Ng et al., 2019).
Single particle inductively coupled plasma mass spectrometry (spICP-MS) is a new analytical tool that can be used to quantify the number concentration and characterize the size distribution of metallic nanoparticles at environmentally relevant concentrations (down to ppt level) (Hassellov et al., 2008). Suspension of nanoparticles in sample is introduced into the plasma in the form of aerosol by nebulization. Each droplet then undergoes desolvation, vaporization, atomization and ionization, generating a burst of ions. After separation based on the mass-to- charge ratio (m/z) of each isotope, the ion cloud is detected by mass spectrometer as pulses of intensities above the steady background signal generated by dissolved analyte (Laborda et al., 2014;
Montano et al., 2016). Particulate signals are differentiated from the background dissolved signals by the intensity threshold, which is determined by iterative calculation. Each signal pulse larger than μ+3σ is considered a nanoparticle event (μ and σ are the mean and standard deviation of dataset respectively). After removing the nanoparticle pulse signals from dataset, the new mean is recalculated and intensity signal greater than 3σ are then further removed from the dataset. This process is reiterated until there are no additional particle events that can be differentiated. The particle size detection limit is determined by the final intensity threshold (Pace et al., 2011). The frequency of detected pulse intensity is proportional to the number concentration of nanoparticle in the sample (Pace et al., 2011). The peak area of a nanoparticle event is proportional to the analyte mass within the particle. By assuming the nanoparticle is spherical and comprised of a single element, the diameter of the nanoparticle can be determined from the analyte mass within the nanoparticle (Olesik and Gray, 2012).
In this study, spICP-MS was used to investigate the release of lead nanoparticles from brand new faucets based on different sampling methods. Moreover, correlations between mass concentrations of lead nanoparticles and copper, zinc, iron nanoparticles will be investigated for
the first time.
Chapter 3 Materials and Methods
3.1 Sampling campaign for residences and schools
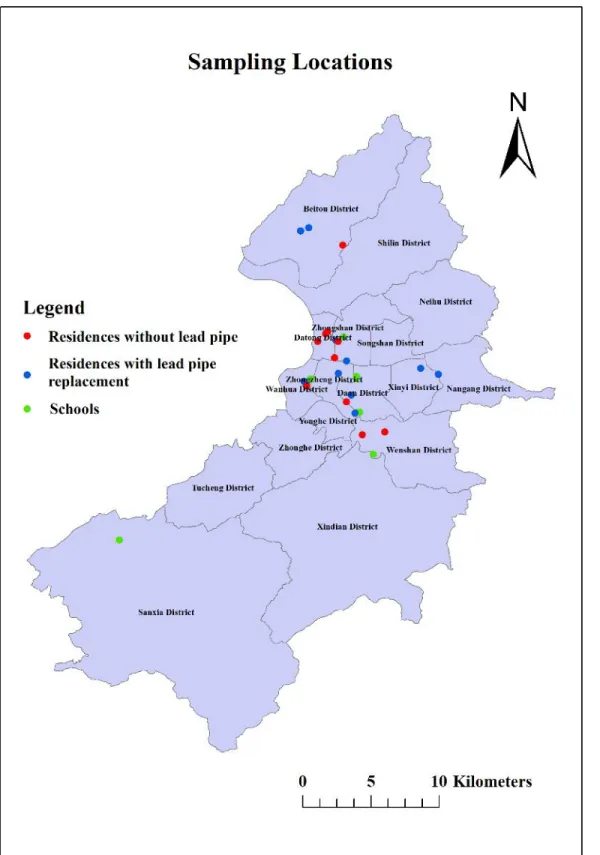
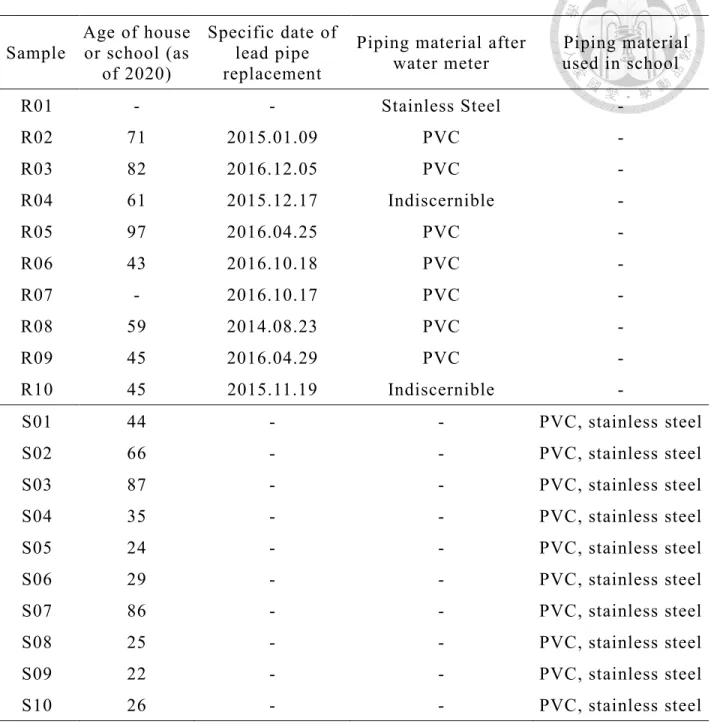
Ten residences with lead pipe replacement, ten residences without lead pipe, and ten schools situated at Taipei Metropolitan Area were selected in this sampling campaign. Their locations are shown in Figure 1. For the ten residences with lead pipe replacement, the year of replacement of the public portions of lead pipe by stainless steel pipe (before water meter) was provided by Taipei Water Department. The piping materials used in the private portions were inspected on site. Seven residences used PVC pipe, one residence used stainless steel pipe, and the piping materials used in the other two residences could not be identified as they were imbedded in the walls. The basic information of the twenty residences and the ten schools are compiled in Table 1. For each sampling location, the following sampling guideline was adopted: 1. kitchen faucets were mainly chosen in kindergartens, 2. water dispensers were chosen in elementary schools and junior high schools, 3. kitchen faucets were selected in the residences, if not applicable, faucets at the arcade outside the residences were sampled. The pictures of each sampling site are shown in Appendix A.
One-liter high density polyethylene (HDPE) wide-mouth bottles were used for three rounds of random daytime sampling (NIEA W101.56A) and two rounds of first draw sampling in 13 selected locations (8 residences and 5 schools) between 2019/06/24 and 2019/10/25. For the random daytime sampling, after collecting the first liter for lead measurement, another 1L HDPE bottle pre-rinsed with 200-300 mL tap water was used to collect the second liter of water for on- site water quality parameter measurements (temperature, pH, free chlorine residual and turbidity).
Due to malfunction of water dispenser, house renovation and school renovation, a total of 13
samples could not be collected in the three runs of random day time sampling.
For the first draw sampling, 1 L HDPE bottles were distributed to the residents and workers at schools to collect first draw sample using faucet maximum flow rate after a stagnation period of more than 6 hr.
The meaning of sample ID, using “S0902” as an example, is that “S” stands for school, “09”
represents the specific school ID, and “02” represents the second sampling point in that specific school. For residential samples with lead pipe replacement, using “R03” as an example, “R” stands for residence with lead pipe replacement and “03” means the third residence in this category. For residences without lead pipe, “W” is used to represent this category.
Figure 1. Locations of residences and schools sampled in this study.
Table 1. Basic information of residences and schools.
Sample Age of house or school (as
of 2020)
Specific date of lead pipe replacement
Piping material after water meter
Piping material used in school
R01 - - Stainless Steel -
R02 71 2015.01.09 PVC -
R03 82 2016.12.05 PVC -
R04 61 2015.12.17 Indiscernible -
R05 97 2016.04.25 PVC -
R06 43 2016.10.18 PVC -
R07 - 2016.10.17 PVC -
R08 59 2014.08.23 PVC -
R09 45 2016.04.29 PVC -
R10 45 2015.11.19 Indiscernible -
S01 44 - - PVC, stainless steel
S02 66 - - PVC, stainless steel
S03 87 - - PVC, stainless steel
S04 35 - - PVC, stainless steel
S05 24 - - PVC, stainless steel
S06 29 - - PVC, stainless steel
S07 86 - - PVC, stainless steel
S08 25 - - PVC, stainless steel
S09 22 - - PVC, stainless steel
S10 26 - - PVC, stainless steel
3.2 Investigation of lead release from new faucets
Three new brass and two new lead-free faucets were purchased and installed in the Environment Research Building in National Taiwan University on 18/2/2020 to investigate the release of lead from new faucets. The three brass faucets were manufactured by different factories while the two lead-free faucets were manufactured by the same company complied with CNS 8088.
Pictures of the faucets are shown in Figure 2. The inner volume of brass faucets and lead-free faucets are 48 mL and 78 mL, respectively. The maximum flow rates of each faucet are summarized in Table 2. The investigation started on the next day after installation (19/2/2020) and ended on 25/5/2020. Tap water sampling was conducted for three consecutive days in the first week, two days in the second and third weeks, one day for the following ten weeks, and once a fortnight for the last month. The measurements of total and soluble copper, zinc, iron concentrations were initiated in the second week. During the sampling period, all faucets were normally used by students and staff in the building.
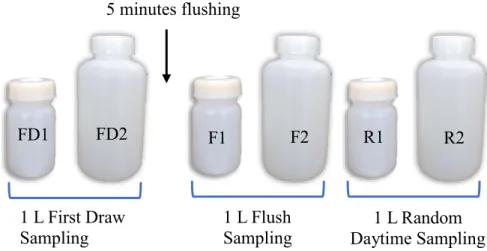
Three different types of sampling methods were employed. The sampling methods were conducted in the fixed sequence as illustrated in Figure 3. After a stagnation period of at least 6 hr, first draw sampling was conducted. Immediately, the faucet was flushed for 5 minutes and flush sampling was employed. Random daytime sampling was carried out during the day.
For each sampling method, 100 mL tap water was first collected using a 100 mL HDPE bottle, immediately followed by sampling of 900 mL tap water using 1 L HDPE bottle. The 100 mL tap water was collected to avoid excessive dilution of samples with the aim to specifically determine the amount of lead leached from the faucet, while the 900 mL tap water was collected because conventional sampling protocol required sampling of 1 L tap water. The volume of 100 mL tap water was sampled with an error of ±10 mL. The stagnation period of tap water in lead-free faucet
2 was longer in the following days due to weekend break (60 hr) and long weekend (84 hr and 108 hr): 60 hr on 2/24, 3/9, 3/16, 3/23, 3/30, 4/13, 4/20, 4/27, 5/11, 5/25; 84 hr on 3/2; 108 hr on 4/6.
Figure 2. Installation of new faucets. (a) Lead-free faucet 1; (b) Lead-free faucet 2; (c) Brass faucet 1; (d) Brass faucet 2; (e) Brass faucet 3
Figure 3. Illustration of sampling protocols employed in the new faucet study.
(a) (b) (c) (d) (e)
FD1 FD2 F1 F2 R1 R2
1 L First Draw Sampling
1 L Flush
Sampling 1 L Random
Daytime Sampling 5 minutes flushing
Table 2. The maximum flow rate of each new faucets.
Faucet Maximum flow rate (L/min) Lead-free faucet 1 9.26
Lead-free faucet 2 5.65
Brass faucet 1 7.94
Brass faucet 2 9.35
Brass faucet 3 8.26
3.3 Analytical methods
In both field study and new faucet study, an aliquot of 10 mL was withdrawn from the thoroughly-mixed sample, filtered by 0.22 μm pore size polyvinylidene fluoride (PVDF) syringe filter and acidified by nitric acid for soluble lead analysis. Whole bottle digestion was applied on the remaining unfiltered sample with 5% v/v nitric acid and 85 oC for 2 hr to analyze total lead concentration. Lead concentration was determined using inductively coupled plasma-mass spectrometry (ICP-MS; NexION 2000, PerkinElmer, USA) in compliance with Standard Method 3125-B. The method detection limit of ICP-MS for lead was 0.03 μg/L.
In the field study, the pH value of sample was measured using a portable pH meter (MP-103, Shang-De, Taiwan) pre-calibrated with standard pH 4, 7 and 10 buffer solutions. Temperature was measured using a T103GB temperature sensor of the MP-103 pH meter. Free chlorine residual and turbidity were measured using the Turbidity and Chlorine Portable Meter (HI93414, Hanna Instrument, USA).
In the new faucet study, total and soluble copper, zinc, iron concentrations were analyzed by using similar sample preparation method as mentioned above. In addition, another aliquot of 10 mL was initially withdrawn from the well-mixed sample without sample pretreatment for the
measurement of metallic nanoparticles. Size distribution and number concentration of lead, copper, zinc and iron nanoparticles were analyzed using the spICP-MS within 7 d. The sample flow rate feeding to the spICP-MS was measured daily in triplicate by weighing the DI water uptake after 3 minutes of aspiration. Gold nanoparticle standard was prepared daily by dilution of the well-mixed ultra-uniform 50 nm gold nanoparticle standard (NanoComposix, AUXU50-1M) to measure the transport efficiency based on particle frequency method (Pace et al., 2011). Dwell time of 100 μs was selected for optimal data acquisition rate. The scan time was set as 80 seconds to ensure repeatability of measurements and improve counting statistics. The sample was diluted 10 times by using deionized water for copper, zinc and iron nanoparticle analysis due to the high dissolved analyte concentration (Schwertfeger et al., 2016). The diluted sample was analyzed immediately to avoid transformation (agglomeration, dissolution) due to the changing water matrix. For the measurement of iron nanoparticles, the signal-to-noise ratio of 56Fe+ isotope was significantly reduced by mass interference of polyatomic species 40Ar16O+. Dynamic Reaction CellTM (DRCTM; Perkin Elmer) and methane reaction gas were used to attain low size detection limit of iron nanoparticles.
3.4 Statistical analysis
Statistical analyses of obtained data were run in Python version 3.7 with 0.05 defined as the significance level in this study. Due to the non-normal distribution of data (Shapiro-Wilk; p
<0.05), nonparametric statistics were employed. Spearman’s rank correlation was applied to investigate: 1. the correlation between lead concentration and water quality parameter (pH, turbidity, free chlorine residual, temperature) in the field study, 2. the relationship between total and soluble concentrations of lead, copper, zinc, iron, and 3. the correlation between nanoparticle mass concentrations of lead, copper, zinc, iron in the new faucet study. Mann-Whitney U test was
used to compare the total lead concentration and lead nanoparticle concentration between brass faucet and lead-free faucet. Wilcoxon signed-rank test was applied to compare the weighted average total lead concentration and weighted average lead nanoparticle concentration between different sampling methods.
Chapter 4 Results and Discussions
4.1 Lead concentration in tap water in selected residences and schools
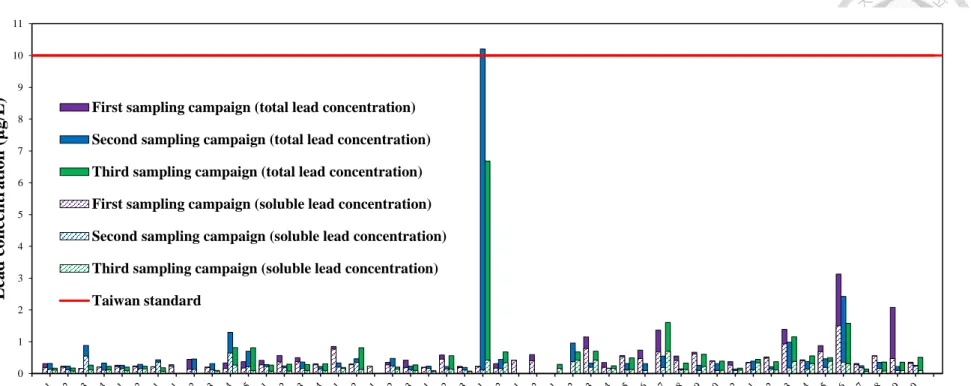
The total and soluble lead concentrations in tap water of selected residences and schools are shown in Figure 4. All samples met Taiwan drinking water standard for lead (10 μg/L) except S0901 in one sampling, which slightly exceeded the standard. The total lead concentrations of S0901 in the second sampling was 10.2 μg/L with a high turbidity of 58.8 NTU. The next sampling showed a total lead of 6.7 μg/L and a turbidity of 29.3 NTU. Notably, the total lead concentration in the first, fourth and fifth samplings were 0.2, 0.6 and 0.6 μg/L, respectively with a turbidity <0.3 NTU. The results showed that the high lead concentration was accidental. The reason behind the temporal high lead level, however, was not clear. Perhaps, detachment of scales resulting from disturbances of the piping system caused the elevated lead and turbidity.
It was originally thought that relative high lead levels would be detected for residences went through lead pipe replacement because there was a likelihood that lead pipe may still exist after the water meter in the private premise plumbing system. Detachment of lead-containing scales caused by replacement works and potential galvanic corrosion between the remaining lead pipe and the new stainless steel pipe have been reported to cause short-term (days to weeks) and long- term (weeks to months) lead release (NgChen et al., 2018). On-site inspection revealed that 8 out of the 10 residences have fully replaced the lead pipes (including those after water meter) eliminating potential galvanic corrosion although the conditions for the other 2 residences were indiscernible because the pipes were embedded in the wall. In addition, the lead pipes had been replaced for several years (between about 3 yr to 5 yr) so that the systems could have re-stabilized.
Moreover, all except four samples (R03 and R10 in first sampling; W03 and R09 in second
sampling) had free chlorine residual levels above 0.1 mg/L as Cl2, which could help reduce the lead concentration (Xie and Giammar, 2011).
For samples collected from water dispensers in schools, the lead concentrations were all below 1 μg/L, the residual chlorine levels were all ND and the pH values were all greater than 7.45.
These could be due to the facts that 1. filter cartridge installed in the water dispenser could remove lead if present and the filter cartridge was regularly replaced and 2. the water was boiled first then cooled so that free chlorine and dissolved inorganic carbon would dissipate to the air. Complete water quality parameter data and pictures of lead pipe replacement condition are shown in Appendix B and C respectively.
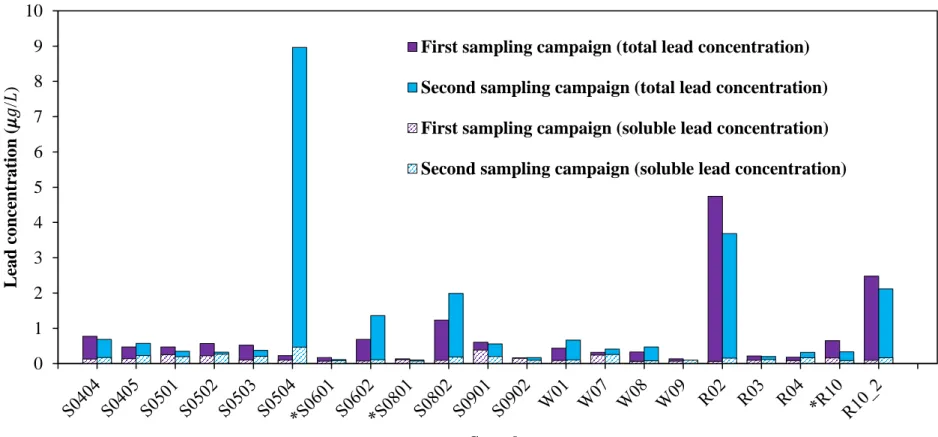
Figure 4. Lead concentration in tap water of selected residences and schools (random daytime sampling). *represents filtered sample
0 1 2 3 4 5 6 7 8 9 10 11
Lead concentration(μg/L)
Sample
First sampling campaign (total lead concentration) Second sampling campaign (total lead concentration) Third sampling campaign (total lead concentration) First sampling campaign (soluble lead concentration) Second sampling campaign (soluble lead concentration) Third sampling campaign (soluble lead concentration) Taiwan standard
23
Selected residences (W01, W07, W08, W09, R02, R03, R04, R10) and schools (S04, S05, S06, S08, S09) were chosen to conduct two first draw samplings. The results are shown in Figure 5. Overall, total lead concentrations of first draw sampling were all below 10 μg/L. The highest total lead concentration was 9.0 μg/L for S0504 in the second sampling, followed by 4.2 μg/L for R02 and 2.3 μg/L for R10_2, respectively.
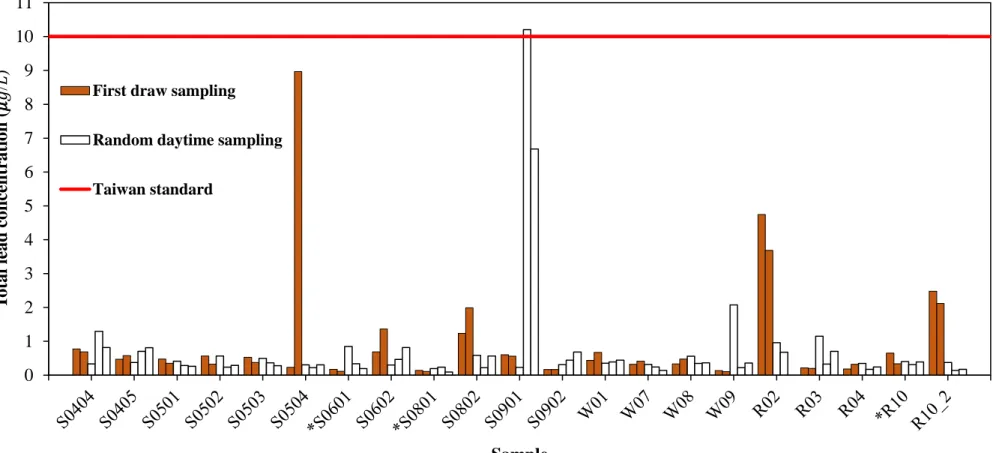
The comparison of total lead concentration between first draw sampling and random daytime sampling are shown in Figure 6. For most samples, the differences were very small, which may be due to the low lead content in plumbing device holding the first liter of water.
American Academy of Pediatrics recommended that the lead concentration in tap water in schools should be lower than 1 μg/L (American Academy of Pediatrics, 2016).
Total lead concentration of the following first draw samples (fourth sampling campaign:
S0802 (1.2 μg/L); fifth sampling campaign: S0504 (9.0 μg/L), S0602 (1.4 μg/L), S0802 (2.0 μg/L) have exceeded the recommended level. Although the lead concentrations detected in this study were low in general, lead was detected in all samples, indicating the universal presence of lead in the plumbing system. New brass faucets and lead- bearing plumbing devices have been found to leach high amounts of lead and the amount of lead released decreased as time progress because the lead present in the device surfaces gradually dissipated (Lei et al., 2018). This raised another question that the lead exposure risk of using new lead-bearing plumbing materials could be higher in the beginning. The regulatory agency may need to consider such risk and propose more stringent rules in regulating the lead content of all plumbing devices.
Figure 5. Lead concentration in tap water of selected residences and schools (first draw sampling). *represents filtered sample 0
1 2 3 4 5 6 7 8 9 10
Lead concentration (𝜇𝑔/𝐿)
Sample
First sampling campaign (total lead concentration) Second sampling campaign (total lead concentration) First sampling campaign (soluble lead concentration) Second sampling campaign (soluble lead concentration)
25
Figure 6. Comparison of total lead concentration between two sampling methods. *represents filtered sample 0
1 2 3 4 5 6 7 8 9 10 11
Total lead concentration(𝜇𝑔/𝐿)
Sample First draw sampling
Random daytime sampling
Taiwan standard
4.2 Correlation between water quality parameters and lead concentration
Water quality parameters such as pH, temperature, turbidity and free chlorine residual were measured on site during the three random daytime samplings. Complete data are compiled in Appendix C. For water dispenser, the free chlorine residual values were all ND, but the pH value and temperature were higher than other samples. The highest pH measured was 9.64. The high pH value was due to the dissipation of dissolved inorganic carbon from the drinking water upon boiling. The high temperature was due to the insufficient cooling after boiling.
During the three rounds of random daytime sampling, the free chlorine residual of 22 samples (first round: S0404, S0601, S0802, S0901, R03, R07, R09; second round: S0404, S0405, S0504, S0602, S0802, S0901, R09, W03; third round: S0404, S0405, S0602, S0802, S0901, R03, W03) did not conform to the free chlorine residual standard in Taiwan (0.2-1.5 mg/L as Cl2). All samples collected from faucet meet the pH standard in Taiwan (6.0-8.5), with the lowest measured pH value of 7.01. First liter of sample S0901 had very high turbidity value in the second and third rounds of sampling (58.8 NTU and 29.3 NTU respectively), while the turbidity value of the second liter reduced significantly (7.6 NTU and 4.8 NTU respectively).
The water quality parameter data of water dispenser and filtered water (S0101, S0102, S0103, S0104, S0201, S0202, S301, S0401, S0402, S0403, S0601, S0701, S0702, S0703, S0801, S0803, S1001, S1002, R10) were not included in the correlation analysis between lead concentration and water quality parameter because the temperature and pH value were much higher and the free chlorine residual was not detected.
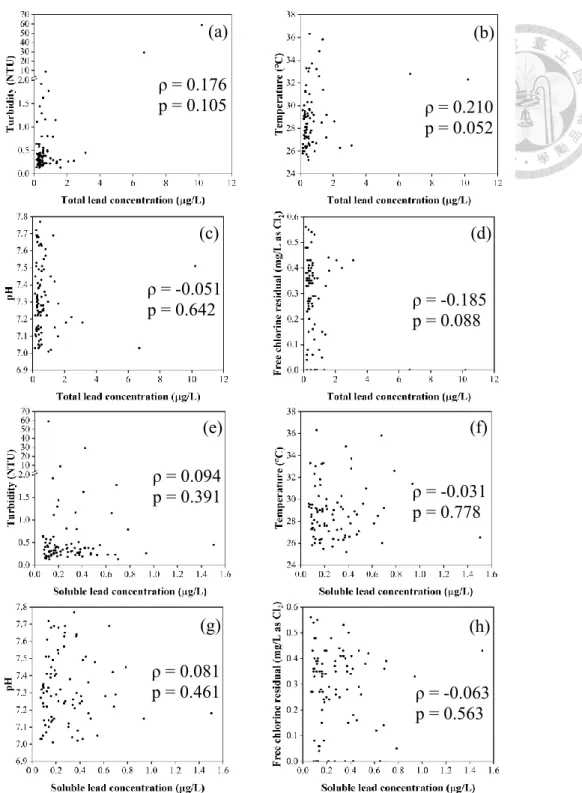
Figure 7 shows the strength of correlations between total lead/soluble lead concentration and different water quality parameters. Overall, there was no correlation (p>0.05) between total/soluble lead concentration and each water quality parameter.
The random release of lead particles depends on the flow pattern within a pipe rather than the water chemistry. Hence, insignificant correlation between total lead concentration and pH, temperature and free chlorine residual was expected. Two samples (sample S0901 in second and third samplings) with high turbidity values (58.8 NTU and 29.3 NTU respectively for first liter sample) are associated with high total lead concentration (10.2 μg/L and 6.7 μg/L respectively).
However, it should be noted that this condition was abnormal and accidental. The remaining samples had a narrow range of turbidity (0.1-9.0 NTU) and did not correlate with total lead concentration.
Theoretically, the soluble lead concentration would correlate with water chemistry. Lab experiments have verified that higher pH and free chlorine residual lead to lower soluble lead concentration while higher temperature is associated with a higher soluble lead concentration. In this field study, however, the soluble lead concentration was not correlated with water quality parameters probably because the ranges of each water quality parameter were small (temperature:
25.2-36.3℃; pH: 7.01-7.77). Moreover, there were many other factors (such as total organic carbon and stagnation time) that can influence the soluble lead concentration compared to well-controlled lab experiments.
Figure 7. Correlation between lead concentration and water quality parameters (a) Total lead vs.
Turbidity; (b) Total lead vs. Temperature; (c) Total lead vs. pH; (d) Total lead vs. Free chlorine residual; (e) Soluble lead vs. Turbidity; (f) Soluble lead vs. Temperature; (g) Soluble lead vs. pH;
(h) Soluble lead vs. Free chlorine residual.
ρ = 0.176
p = 0.105 ρ = 0.210
p = 0.052
ρ = -0.185 p = 0.088
ρ = -0.031 p = 0.778
ρ = -0.063 p = 0.563 ρ = -0.051
p = 0.642
ρ = 0.094 p = 0.391
ρ = 0.081 p = 0.461
(a) (b)
(c) (d)
(f)
(h) (e)
(g)
4.3 Release of lead from new faucet
The total and soluble lead concentrations in tap water sampled from five new faucets (brass:
3; lead-free: 2) are shown in Figure 8. The FD1 (First draw sampling 100 mL) and R1 samples (Random daytime sampling 100 mL) are representatives of the faucet’s lead leaching potential.
Brass faucets had significantly greater (p<0.001) median total (2.95 μg/L, n=102) and soluble (0.50 μg/L, n=102) lead concentration in FD1 and R1 samples compared to total (0.70 μg/L, n=68) and soluble (0.16 μg/L, n=68) lead concentration of corresponding samples in lead-free faucet. FD1 and R1 samples of three new brass faucets had the highest and second highest lead concentration respectively as the accumulation of lead corrosion products in faucet increased with stagnation period. In general, the total lead concentration of FD1 and R1 samples reduced gradually over time. For brass faucet 1, the FD1 sample exceeded the Taiwan standard (10 μg/L) from 19/2/2020 (24.3 μg/L) till 2/3/2020 (14.7 μg/L) while R1 sample exceeded the standard (11.0 μg/L) on 2/3/2020. The other two brass faucets released much lower level of lead. Only FD1 sample of brass faucet 2 slightly exceeded 10 μg/L on 20/2/2020 (extremely high lead concentration of R1 sample (926 μg/L) of brass faucet 3 was considered to result from the lead source in plumbing system before the faucet). The soluble lead concentration of all brass faucets was below 3 μg/L.
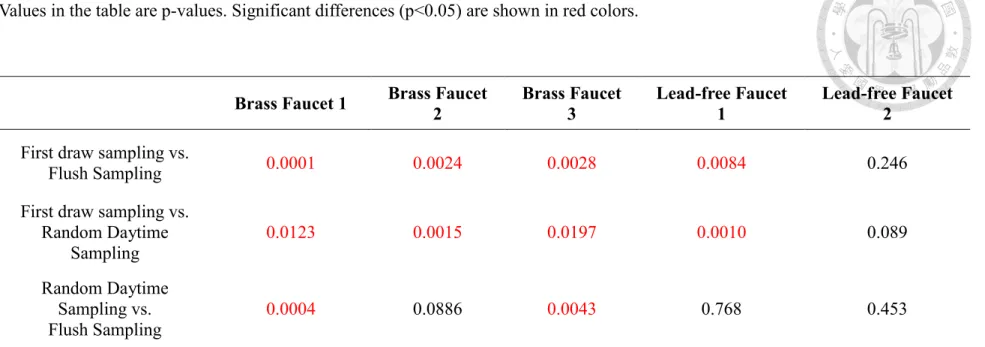
Table 3 shows the comparison of weighted average total lead concentration between different sampling methods. For all brass faucets, the median weighted average lead concentration of first draw sampling was higher (p<0.05) than flush sampling and random daytime sampling.
For brass faucet 1 and brass faucet 3, the median weighted average lead concentration of random daytime sampling was higher (p<0.05) than flush sampling. For brass faucet 2, The median weighted average lead concentration of random daytime sampling was not significantly higher than flush sampling due to the occurrence of lead spikes in flush sampling.
By installing brand new brass faucet, the worst-case scenario is drinking a small volume (<100 mL) of tap water after more than 6 hour of stagnation period, followed by at random period throughout the day subsequently (which are similar to FD1 sample and R1 sample respectively).
Traditional sampling method requires sampling of 1 liter tap water, which causes excessive dilution and may overlook the lead exposure risk.
Overall, the total and soluble lead concentration of lead-free faucet were very low. For lead-free faucet 1, the total and soluble concentration were below 6 μg/L and 1 μg/L respectively.
There were several samples with relatively high total lead concentration in lead-free faucet 1: FD1 (5.2 μg/L) and R1 (5.4 μg/L) on 19/2/2020; FD1 (5.4 μg/L) on 30/3/2020. This shows that it would be safer to flush the tap water after long period of stagnation even though lead-free faucet leach significantly lower level of lead. By comparing the total lead concentration between different sampling methods, only median weighted average lead concentration of first draw sampling in lead-free faucet 1 was significantly higher (p<0.05) than that of flush sampling and random daytime sampling.
Several samples with very high total lead concentrations were detected on the following days: brass faucet 2: FD2 (First draw sampling 900 mL) (32 μg/L) and F1(Flush sampling 100 mL) (65 μg/L) on 19/2/2020; brass faucet 1: R2 (Random daytime sampling 900 mL) (43 μg/L) on 20/2/2020; brass faucet 2: F2 (Flush sampling 900 mL) (284 μg/L), brass faucet 3: F1 (52 μg/L), R1 (926 μg/L), R2 (507 μg/L), lead-free faucet 2: FD1 (128 μg/L), FD2 (346 μg/L), F2 (5251 μg/L) on 26/2/2020; lead-free faucet 2: F1 (12 μg/L) on 2/3/2020; brass faucet 1: FD2 (16 μg/L) on 27/4/2020. These samples had low soluble lead concentrations, suggesting that the high total lead concentrations were attributed to the random release of lead particles. This would imply that installation of filter cartridges was essential to ensure drinking water safety as flushing does not
consistently reduce the lead concentration in tap water.
Previous studies have found that lead concentration is correlated with iron concentration due to the adsorption of soluble lead onto iron colloids (Deshommes et al., 2010; Knowles et al., 2015; Masters and Edwards, 2015). Correlation between lead concentration and copper, zinc concentration has also been reported in several studies (Kimbrough, 2007; Deshommes et al., 2010).
The copper, zinc, iron concentrations were compiled in Appendix D. Overall, copper, zinc concentration of FD1 and R1 samples were the highest and second respectively because the accumulation of copper and zinc corrosion products in faucet increased with stagnation period.
There was no observable difference of total and soluble iron concentration between different sampling methods because iron concentration was mainly influenced by the corrosion of iron pipe in the distribution system. The correlations between lead and copper, zinc, iron concentrations are shown in Figure 9 and Table 4. The FD1, R1 samples and FD2, F1, F2, R2 samples were divided into two groups as the lead, copper, zinc concentrations were originated from faucet and plumbing system respectively. For brass faucet, the total lead concentration was strongly correlated (p<0.001) with copper (ρ =0.594) and zinc (ρ =0.635), while the soluble lead concentration was strongly correlated (p<0.001) with copper (ρ=0.617) and weakly correlated (p<0.05) with zinc (ρ=0.240).
Both total and soluble lead concentrations were not correlated with iron in brass faucet. For lead- free faucet, the total and soluble lead concentrations were not correlated with copper, zinc, and iron. The total and soluble lead concentrations were weakly correlated (p<0.05) with total and soluble copper, zinc, iron concentrations (except soluble iron) in the plumbing system before the faucet.
0 20 40 60 80 100 0
1 2 3 4 5
Soluble Lead Concentration (mg/L)
Days after installation
Brass Faucet 1
0 20 40 60 80 100
0 10 20 30 40 50
Total Lead Concentration (mg/L)
Days after installation
Brass Faucet 1
0 20 40 60 80 100
0 1 2 3 4 5
Soluble Lead Concentration (mg/L)
Days after installation
Brass Faucet 2
0 20 40 60 80 100
0 10 20 30 60 70 280 300
Total Lead Concentration (mg/L)
Days after installation
Brass Faucet 2
0 20 40 60 80 100
0 1 2 3 4 5
Soluble Lead Concentration (mg/L)
Days after installation
Brass Faucet 3
0 20 40 60 80 100
0 5 10 15 40 60 400 600 800 1000
Total Lead Concentration (mg/L)
Days after installation
Brass Faucet 3
0 20 40 60 80 100
0 2 4 6 8 10
Total Lead Concentration (mg/L)
Days after installation
Lead-free Faucet 1
0 20 40 60 80 100
0 1 2 3 4 5
Soluble Lead Concentration (mg/L)
Days after installation
Lead-free Faucet 2
0 20 40 60 80 100
0 2 4 6 8 10 12 200 400 5000 5500
Total Lead Concentration (mg/L)
Days after installation
Lead-free Faucet 2
0 20 40 60 80 100
0 1 2 3 4 5
Soluble Lead Concentration (mg/L)
Days after installation
Lead-free Faucet 1
Legend
Table 3. Comparison of weighted average total lead concentration between different sampling methods using Wilcoxon signed-rank test.
Values in the table are p-values. Significant differences (p<0.05) are shown in red colors.
Brass Faucet 1 Brass Faucet
2 Brass Faucet
3 Lead-free Faucet
1 Lead-free Faucet 2
First draw sampling vs.
Flush Sampling 0.0001 0.0024 0.0028 0.0084 0.246
First draw sampling vs.
Random Daytime
Sampling 0.0123 0.0015 0.0197 0.0010 0.089
Random Daytime Sampling vs.
Flush Sampling
0.0004 0.0886 0.0043 0.768 0.453
Figure 9. Correlation between lead concentration and copper, zinc and iron concentration (a) Total lead vs. total copper; (b) Total lead vs. total zinc; (c) Total lead vs. total iron; (d) Soluble lead vs.
soluble copper; (e) Soluble lead vs. soluble zinc; (f) Soluble lead vs. soluble iron.
Legend
0.1 1 10 100 1000 10000
0.1 1 10 100 1000
Total Copper Concentration (mg/L)
Total Lead Concentration (mg/L)
0.1 1 10 100 1000 10000
0.1 1 10 100 1000
Total Zinc Concentration (mg/L)
Total Lead Concentration (mg/L)
0.1 1 10 100 1000 10000
1 10 100 1000
Total Iron Concentration (mg/L)
Total Lead Concentration (mg/L)
0 1 2 3
0 10 20 30 40 50 60
Soluble Copper Concentration (mg/L)
Soluble Lead Concentration (mg/L)
0 1 2 3
0 50 100 150 200 250
Soluble Zinc Concentration (mg/L)
Soluble Lead Concentration (mg/L)
0 1 2 3
0 50 100 150 200 250
Soluble Iron Concentration (mg/L)
Soluble Lead Concentration (mg/L)
(a)
(b)
(c)
(d)
(e)
(f)
Table 4. Correlation between lead concentration and copper, zinc, iron concentration in brass faucet, lead-free faucet and plumbing system before faucet using Spearman’s rank correlation.
Significant correlations (p<0.05) are shown in red colors.
Pb vs. Cu Pb vs. Zn Pb vs. Fe Total Soluble Total Soluble Total Soluble Brass Faucet
p-value 3E-09 4E-10 9E-11 0.028 0.297 0.476 𝜌 0.594 0.617 0.635 0.240 0.115 -0.079 Lead-free Faucet
p-value 0.344 0.893 0.262 0.264 0.163 0.580 𝜌 0.129 -0.018 0.152 0.152 0.189 0.075 Plumbing system
before faucet
p-value 1E-11 6E-09 1E-07 7E-07 6E-04 0.216 𝜌 0.390 0.338 0.308 0.292 0.205 0.074
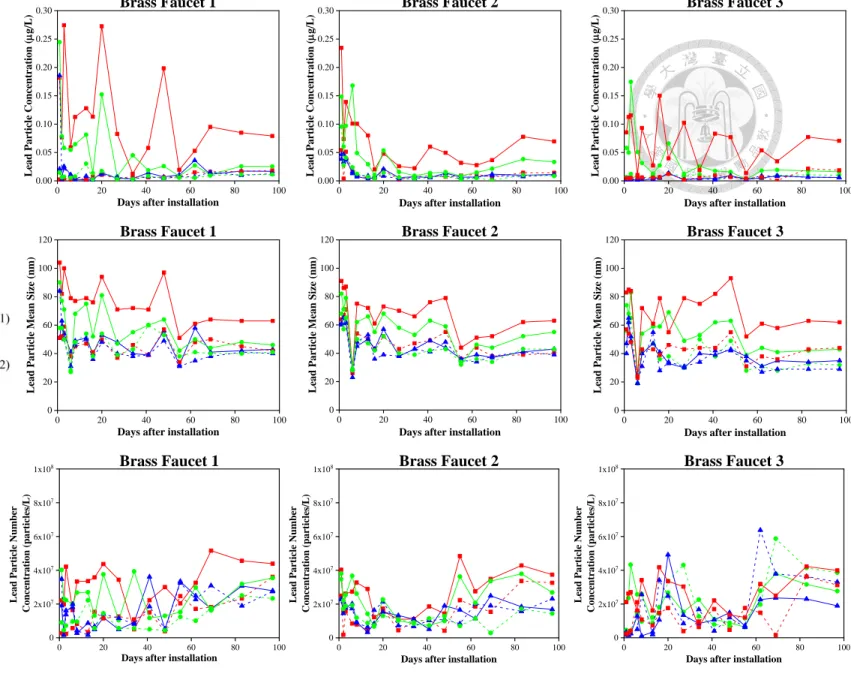
4.4 Lead particle mass concentration in tap water in new faucet study
Figure 10 and figure 11 show the lead particle mass concentration, mean size and number concentration in tap water collected from brass faucets and lead-free faucets respectively. The raw data and size distribution of lead particles are shown in Appendix E. It should be noted that the term “particle” is used instead of “nanoparticle” because each sample has a small portion of particles with sizes larger than 100 nm. Overall, the brass faucet has significantly higher (p<0.001) median lead particle mass concentration (0.05 μg/L, n=102) in FD1 and R1 samples compared to those of lead-free faucet (0.007 μg/L, n=68).
In general, for all brass faucets, the FD1 sample had a higher lead particle mass concentration compared to other sampling methods, followed by R1 sample. For brass faucet 2, the lead particle mass concentration of FD1 sample reduced over time from 0.23 μg/L on 19/2/2020 to 0.07 μg/L on 25/5/2020. However, for brass faucet 1 and brass faucet 3, the lead particle concentrations in FD1 sample and R1 sample fluctuated greatly and randomly. This indicated that the release of lead particles from each brass faucet differed widely. Sample F1 in lead-free faucet 2 had a lead concentration of 0.2 μg/L on 2/3/2020, which was accompanied with high total lead concentration (12 μg/L). Other samples of lead-free faucet have a low concentration of below 0.05 μg/L.
For all brass faucets, FD1 sample generally had a higher mean size of lead particle compared to other sampling methods, followed by R1. However, differences in lead particle mean size between each sampling method were not observed in lead-free faucet. There was no obvious difference of lead particle number concentration between different sampling methods in either brass faucets or lead-free faucets.
Comparisons of weighted average lead particle concentration between each sampling