Simultaneous Determination of Caffeic Acid, Ferulic Acid and Isoferulic Acid in Rabbit Plasma by High Performance
Liquid Chromatography
LI-HSUAN WANG1, KUANG-YANG HSU2, FENG-LIN HSU3 AND SHWU-JIUAN LIN1*
1. Department of Medicinal Chemistry, 2. Department of Pharmaceutics, 3. Graduate Institute of Pharmacognosy, College of Pharmacy, Taipei Medical University, Taipei City, Taiwan (R.O.C.)
(Received: March 5, 2007; Accepted: June 21, 2007)
ABSTRACT
A simple and sensitive high performance liquid chromatographic method with reverse-phase column for the simultaneous quan- tification of caffeic acid, ferulic acid, and isoferulic acid in rabbit plasma was developed. An ODS column (150 mm × 4.6 mm I.D., 5 µm) was used as the stationary phase and the mobile phase consisted of acetonitrile/glacial acetic acid/water (15:0.5:85, v/v, pH adjusted to 4.5). Flow-rate was 1.0 mL/min and UV absorbance was set at 321 nm. One hundred microliter of plasma was used to simultaneously measure the concentrations of caffeic acid, ferulic acid, and isoferulic acid. After a direct clean-up procedure with 10% of trifluoroacetic acid, the lower limits of quantification were 0.1 µg/mL and the standard curves were found to be linear over the concentration ranges of 0.1-100 µg/mL for caffeic acid, ferulic acid, and isoferulic acid. The average recoveries for caffeic acid, ferulic acid, and isoferulic acid were 96.2%, 98.0%, and 98.3%, respectively. The results for all compounds also showed good stability after three freeze/thaw cycles and storage at ambient temperature and 4°C for 24 hr. The assay method was successfully applied to the pharmacokinetic study of caffeic acid, ferulic acid, and isoferulic acid after an intravenous administration of caffeic acid to rabbits.
Key words: caffeic acid, ferulic acid, isoferulic acid, HPLC
INTRODUCTION
Caffeic acid (3,4-dihydroxycinnamic acid, CA) is found in a wide variety of foods including vegetables, fruits, tea, coffee, and wine(1-2). Caffeic acid elicits several interesting and various biological responses, such as antibacterial(3-4), anti-fungal(5), anti-inflammatory(6), antiviral(7-8), anticancer(9-10), antioxidant(11-14), antimu- tagenic(15), and anti-diabetic activities(16). Due to these biological activities, caffeic acid could be a good lead compound for new drug development. However, phar- macokinetic studies of caffeic acid and its related meth- ylated metabolites, ferulic acid (FA) and isoferulic acid (IFA), have not been completely identified and studied.
Various analytical methods have been used for the determination of CA, FA, and IFA in natural products including high performance liquid chromatography (HPLC) and gas chromatography (GC) after derivatiza- tion. For analysis of the biological samples, most meth- ods were used to analyze both caffeic acid and ferulic
acid(17-19) or ferulic acid and isoferulic acid in plasma or urine(20-21). However, reports on the simultaneous analy- sis of CA, FA, and IFA in biological samples are scarce.
A recent study to determine CA, FA, and IFA in human plasma as metabolites was derived from artichoke leaf extract(21). This method involved sample preparation followed analysis using high performance liquid chroma- tography on reversed-phase material with a polar endcap- ping (Aqua-C18). The target compounds were monitored by electrochemical array detection (CoulArray). Cali- bration curves of caffeic acid, ferulic acid, and isoferulic acid were conducted in the ranges of 2.1-51.7 ng/mL, 2.2- 53.7 ng/mL, and 1.1-52.6 ng/mL, respectively. Although this assay method shows high sensitivity; it needs about 500 µL of plasma and a complicated preparation proce- dure. It is also time consuming with one sample for total analytical time about 97.5 min including HPLC analysis taken over 87.5 min and column flushing about 10 min.
In an animal model of our studies, the volume of biologi- cal sample is sparse. Thus, in order to develop a suitable method for the determination of metabolites in a meta- bolic study of caffeic acid after intravenous administra- tion to rabbits and in accordance with the international
* Author for correspondence. Tel: +886-2-27361661 ext. 6133;
Fax: +886-2-27370903; E-mail: [email protected]
guidelines for validation of bioanalytical methods(22), a simple and sensitive analytical method for simultane- ously determining CA, FA, and IFA in biological samples was conducted.
MATERIALS AND METHODS I. Chemicals and Reagents
Caffeic acid (CA) and ferulic acid (FA) were obtained from Sigma (St. Louis, MO, USA). Isoferulic acid (IFA) was purchased from Lancaster Synthesis (Lancashire, UK). Acebutolol used as the internal standard was supplied by the Coprima Sociedad Anónima (Barcelona, Spain). HPLC grade of acetonitrile, trifluoroacetic acid (TFA), phosphoric acid (85%), glacial acetic acid, and 2- aminoethanol were obtained from E. Merck (Darmstadt, Germany). All other chemicals were of analytical grade and used without further purification.
II. Apparatus and Chromatographic Conditions
The HPLC system consisted of a Shimadzu LC- 10ADVP pump, SIL-HTA/HTC autosampler, SPD- 10AVP/10AVVP UV detector, and CLASS-VP Ver.6.1 system manager as data processor (Shimadzu Co., Kyoto, Japan). Separation was achieved by a Biosil Pro-ODS- U column (150 mm × 4.6 mm I.D., 5 µm, Biotic Chemi- cal Co., Ltd., Taipei, Taiwan). A mobile phase composed of acetonitrile/glacial acetic acid/water (15:0.5:85, v/v, pH 4.5) was used throughout the analysis. Flow rate was 1.0 mL/min and UV absorbance was set at 321 nm. The mobile phase was filtered and degassed before use.
III. Preparation of Solution
Stock solutions of CA (1 mg/mL) and FA (1 mg/
mL) were separately prepared by weighing 10 mg of CA or FA into a calibrated 10-mL volumetric flask and making volume to 10 mL with acetonitrile/85% phos- phoric acid/water (10:0.01:90, v/v). Stock solution of IFA (1 mg/mL) was prepared by weighing 10 mg of IFA into a calibrated 10-mL volumetric flask and making volume to 10 mL with acetonitrile/85% phosphoric acid/water (25:0.01:90, v/v). Working solutions of CA, FA, and IFA were prepared by further dilution of each standard stock solution with acetonitrile/water (10:90, v/v) to 0.01, 0.1, and 1 µg/mL. Solutions were stored at 4°C until analysis.
IV. Sample Preparation
One hundred microliter of plasma were spiked into a clean culture tube and subsequently 15 µL of internal standard solution [10 ng/µL of acebutolol in 10% (v/v) of TFA] were added and mixed well. One hundred micro- liter of 10% (v/v) of trifluoroacetic acid were then added
and vortex mixed for 1 min. Samples were centrifuged at 1,945 ×g for 10 min. An aliquot (25 µL) of supernatant was injected into the HPLC system.
V. Standard Curve
A standard curve was prepared by the addition of known quantities of CA-FA-IFA mixture to aliquots of plasma and prepared as described above for sample prep- aration. The concentration used for each sample was 0.1, 0.2, 0.5, 2, 5, 20, 50, and 100 µg/mL. The peak-height ratios of each compound to internal standard were plot- ted against the concentration of each compound prepared.
Linearity was determined for all concentrations (0.1-100 µg/mL). The standard curve of each compound was deter- mined by weighted least-square linear regression analysis corresponding to 1 over concentration square (1/concen- tration2). The concentrations of CA, FA or IFA in the test samples were calculated using the regression parameters of CA, FA or IFA itself obtained from the standard curve.
VI. Accuracy and Precision
Four different concentrations (0.1, 0.3, 4 and 80 µg/
mL) of CA, FA, and IFA were prepared with drug-free plasma and the concentrations were determined using the corresponding standard curves. Accuracy of the method was shown in relative errors (RE) which was calculated based on the difference between the mean calculated and added concentrations, while precision was evaluated by within- and between-run coefficient of variation (CV).
VII. Recovery
Recovery was calculated by comparing the peak- height of each compound in the plasma to that of the equivalent amounts in the aqueous solution.
VIII. Freeze/thaw Stabilities and Post-Preparation Stability Freeze and thaw stability was tested by spiking samples at the concentrations of 0.15 and 80 µg/mL through three freeze/thaw cycles. Post-preparation stability was tested by plasma samples at the concentrations of 0.3 and 80 µg/mL, which were kept on bench at room temperature (25°C) and in a freezer at 4°C for 24 hr after preparation, respectively.
IX. Rabbits Experiment
Male New Zealand white rabbits which weighed 1.8- 2.0 kg were used in pharmacokinetic studies. Before single intravenous administration of 10 mg/kg of caffeic acid, the rabbits were fasted overnight. Blood samples (1.0 mL) were collected at the following times: 0 (pre-drug), 5, 10, 20, 30, 60, 90, 120, 180, 240, 360, and 600 min from the marginal vein of the ear after intravenous administration, and placed into an ice bath immediately. Plasma was sepa-
rated after centrifugation at 1,945 ×g for 5 min and acidi- fied by addition of 20 µL of 20% (v/v) of phosphoric acid and stored in a freezer at -80°C until analysis.
RESULTS AND DISCUSSION I. Sample Preparation
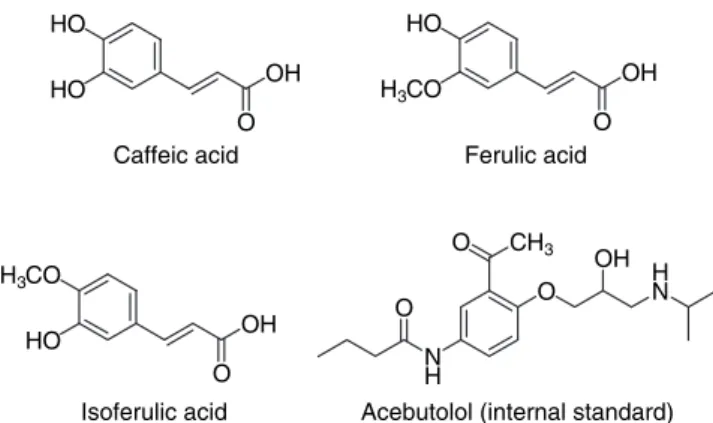
The chemical structures of caffeic acid, ferulic acid and isoferulic acid are shown in Figure 1. As previously reported(23), CA has a fast degradation rate in higher pH solution and it is stable in the buffer solution with pH range of 2-5. Therefore, FA and IFA could also have the same properties. When the sample solutions were not of sufficient acidity, these hydroxycinnamates were present as protonated and nonprotonated species and subsequently degraded easily(21). During the development of analytic method for simultaneous determination of CA, FA and IFA in rabbit plasma, we found that most commonly used solid- phase extraction was time-consuming and resulted in lower recovery and higher LOD. On the other hand, using aceto- nitrile as a protein-precipitating reagent would produce endogenous interference and/or low recovery. However, using TFA as a sample clean-up reagent could maintain post preparative sample in acidic condition and subse- quently keep the stabilities of CA, FA, and IFA. Therefore, it could save concentration time of post sample preparation and simplify sample preparation procedure. After optimi- zation, a pH value of the mobile phase at 4.5 was used. The baseline separation of CA, FA, IFA, a clear and sharp peak, good analytical sensitivity and no interference peak were obtained within a run-time of 20 min. Typical chromato- grams are shown in Figure 2. No significant endogenous peak co-eluted with the target compounds as shown in the corresponding chromatogram of drug-free plasma. The retention times for CA, FA, IFA, and internal standard were 5.05, 10.94, 12.63 and 14.55 min, respectively.
II. Calibration Curve and Linearity
The method was validated for the concentration range of 0.1-100 µg/mL. A linear regression was performed using the equation y = a + bx by weighted (1/x2) over the standard curve range. The coefficients of determina- tion obtained from the standard curve used in within-run and between-run validations, respectively, were greater than the value of 0.99. A statistical linear regression was performed for each compound using concentration against peak height ratio of target compound to internal standard.
Three linear regression equations (y = a + bx; y = peak height ratio, x = concentration) were b = 0.2792 ± 0.0041, a = -0.0010, r2 = 0.9962 for CA, b = 0.1392 ± 0.0004, a = 0.0039, r2 = 0.9983 for FA, and b = 0.1174 ± 0.0010, a = 0.0000, r2 = 0.9983 for IFA. The results indicated linear relationship between peak height ratio and concentration over the concentration range of 0.1-100 µg/mL.
III. Precision and Accuracy
The detailed precision and accuracy data of CA, FA
HO HO
O
OH H3CO
HO
O OH
HO H3CO
O OH
NH
O O CH3
OH HN O
Caffeic acid Ferulic acid
Isoferulic acid Acebutolol (internal standard) Figure 1. Chemical structures of caffeic acid, ferulic acid, isoferulic acid and acebutolol (internal standard).
(A)
Minutes
0 5 10 15 20
Volts
0.000 0.002 0.004 0.006 0.008 0.010
1 2 3 4
(B)
Minutes
0 5 10 15 20
Volts
0.000 0.002 0.004 0.006 0.008 0.010
(C)
Minutes
0 5 10 15 20
Volts
0.000 0.002 0.004 0.006 0.008 0.010
1 2 3 4
Figure 2. Typical chromatograms of (A) authentic compound, (B) drug-free plasma, (C) caffeic acid, ferulic acid, and isoferulic acid plasma, concentration at 4 µg/mL with internal standard. 1. caffeic acid; 2. ferulic acid; 3. isoferulic acid; 4. internal standard.
and IFA for within- and between-run are shown in Tables 1 and 2. In higher concentrations, both within- and between-run CV values were 1.4-3.4% for CA, 1.2-3.9%
for FA, and 1.2-4.4% for IFA. The within- and between- run RE values were -3.9 to 7.3% for CA, -6.1 to 3.6% for FA, and -5.5 to 3.6% for IFA at three different concen- tration levels. These results indicated that the present method yields the acceptable precision and accuracy.
IV. Lower Limitation of Quantification (LLOQ)
The lower limitation of quantification (LLOQ) was defined as the lowest concentration on the standard curve that could be determined with acceptable precision and accuracy. Thus, the LLOQs all were 0.1 µg/mL for CA, FA, and IFA. At LLOQ level, CVs were 2.50–12.6%
and RE values–11.7 to 19.4%. Precision and accuracy of within- and between-run at the LLOQ for CA, FA, and IFA met the requirements (both CV and RE ≤ 20%) for bioanalytical analysis(22).
V. Recovery
As shown in Table 3, after the direct de-protein procedure with 10% (v/v) of TFA solution, recoveries of CA, FA, and IFA at three different concentrations were 93.9-98.2%, 95.6-101.2%, 96.5-100.9%, respectively.
The average recoveries of CA, FA, and IFA were 96.2%, 98.0%, and 98.3%, respectively. These results indicated that the direct de-protein procedure using 10% (v/v) of TFA solution is a good preparation method.
Table 1. Data for within-run precision and accuracy
Nominal concentration (µg/mL)
Caffeic acid Ferulic acid Isoferulic acid
Run 0.1 0.3 4 80 0.1 0.3 4 80 0.1 0.3 4 80
I Mean 0.100 0.288 3.88 85.9 0.108 0.294 3.89 82.9 0.095 0.284 3.95 82.9
S.D. 0.004 0.004 0.05 1.8 0.003 0.008 0.07 1.0 0.007 0.009 0.06 1.1
CV (%) 4.4 1.5 1.4 2.1 3.0 2.6 1.8 1.2 7.5 3.2 1.5 1.4
RE (%) 0.3 -3.9 -3.0 7.3 8.1 -2.1 -2.8 3.6 -5.3 -5.5 -1.2 3.6
II Mean 0.102 0.298 3.95 82.2 0.088 0.282 4.00 81.2 0.116 0.310 4.01 79.8
S.D. 0.004 0.006 0.08 2.0 0.007 0.010 0.05 1.4 0.010 0.006 0.05 1.1
CV (%) 3.7 2.1 2.1 2.4 8.2 3.5 1.3 1.7 8.2 1.8 1.2 1.4
RE (%) 2.5 -0.6 -1.1 2.7 -11.7 -6.1 0.0 1.5 16.2 3.4 0.2 -0.2
III Mean 0.119 0.307 3.88 80.9 0.104 0.292 3.94 81.6 0.104 0.293 3.94 80.8
S.D. 0.003 0.007 0.06 1.5 0.013 0.011 0.07 1.5 0.006 0.006 0.05 1.5
CV (%) 2.5 2.3 1.4 1.8 12.6 3.9 1.8 1.8 5.4 2.0 1.2 1.9
RE (%) 19.4 2.3 -3.1 1.1 3.7 -2.6 -1.5 2.0 4.4 -2.5 -1.5 1.0
n = 6 for each concentration and run.
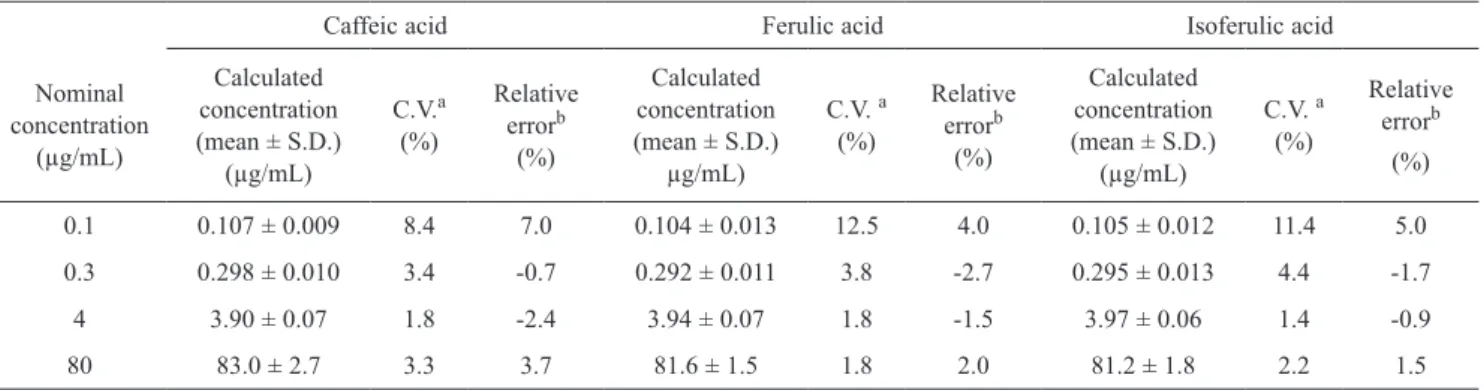
Table 2. Data for between-run precision and accuracy
Caffeic acid Ferulic acid Isoferulic acid
Nominal concentration
(µg/mL)
Calculated concentration (mean ± S.D.)
(µg/mL)
C.V.a (%)
Relative errorb
(%)
Calculated concentration (mean ± S.D.)
µg/mL)
C.V. a (%)
Relative errorb
(%)
Calculated concentration (mean ± S.D.)
(µg/mL)
C.V. a (%)
Relative errorb
(%)
0.1 0.107 ± 0.009 8.4 7.0 0.104 ± 0.013 12.5 4.0 0.105 ± 0.012 11.4 5.0
0.3 0.298 ± 0.010 3.4 -0.7 0.292 ± 0.011 3.8 -2.7 0.295 ± 0.013 4.4 -1.7
4 3.90 ± 0.07 1.8 -2.4 3.94 ± 0.07 1.8 -1.5 3.97 ± 0.06 1.4 -0.9
80 83.0 ± 2.7 3.3 3.7 81.6 ± 1.5 1.8 2.0 81.2 ± 1.8 2.2 1.5
aCV = 100% × (S.D./mean).
bRelative error = 100% × (concentration calculated – spiking plasma concentration)/spiking plasma concentration.
cn = 18 for each concentration.
VI. Freeze and Thaw Stability
The freeze and thaw stability study indicated a short- term stability of the target compounds in plasma samples in the thaw procedure. Furthermore, some plasma protein can coagulate and precipitate after freezing and thawing, respectively. Because the target compounds can bind to the plasma protein, the phenomena of plasma protein coagulating in the frozen condition and precipi- tating after thawing to room temperature can result in concentration loss. As shown in Table 4, the differences
of the measured concentrations for the target compounds between the initial and each cycle were less than 10% for two concentrations. This indicated that these compounds have good stability in plasma samples after three freeze and thaw cycles.
VII. Post-Preparation Stability
Post-preparation stability was used to evaluate the plasma sample stability after preparation. Plasma samples were prepared at concentrations of 0.3 µg/mL and 80 µg/
Table 3. Recoveries for caffeic acid, ferulic acid, and isoferulic acid
Caffeic acid Ferulic acid Isoferulic acid
Nominal concentration
(µg/mL)
Water sample Peak height
Plasma sample Peak height
Recovery (%)
Water sample Peak height
Plasma sample Peak height
Recovery (%)
Water sample Peak height
Plasma sample Peak height
Recovery (%)
0.3 495 ± 3 486 ± 5 98.2 261 ± 5 264 ± 13 101.2 214 ± 3 216 ± 9 100.9
4 6761 ± 235 6349 ± 90 93.9 3356 ± 98 3262 ± 33 97.2 2866 ± 103 2791 ± 43 97.4
80 139947 ± 2025 135001 ± 4116 96.5 69824 ± 925 66783 ± 2139 95.6 59172 ± 628 57092 ± 1781 96.5 n = 3 for each concentration.
Table 4. Freeze and thaw stabilities of target compounds
Nominal concentration (µg/mL)
Caffeic acid Ferulic acid Isoferulic acid
Cycle 0.15 80 0.15 80 0.15 80
Initial 0.145 ± 0.010 80.5 ± 2.9 0.131 ± 0.007 78.0 ± 1.6 0.161 ± 0.013 75.4 ± 1.5 REa1 (%) 0.137 ± 0.005
-5.39% 83.1 ± 2.3
3.27% 0.125 ± 0.020
-4.54% 79.6 ± 3.1
2.09% 0.160 ± 0.007
-0.14% 76.4 ± 2.5
1.29%
RE (%)2 0.148 ± 0.005
1.77% 81.9 ± 0.9
1.80% 0.126 ± 0.015
-3.96% 79.8 ± 2.2
2.36% 0.161 ± 0.011
0.11% 77.1 ± 1.7
2.23%
RE (%)3 0.139 ± 0.009
-4.43% 84.2 ± 1.5
4.68% 0.136 ± 0.020
3.56% 81.2 ± 2.6
4.18% 0.158 ± 0.007
-1.83% 78.0 ± 3.0
3.41%
aRE (%) = 100% × (concentration calculated – initial plasma concentration)/initial plasma concentration.
bn = 3 for each concentration and cycle.
Table 5. Post-preparation stability after storage at room temperature and 4°C for 24 hr
Nominal concentration (µg/mL)
Caffeic acid Ferulic acid Isoferulic acid
Cycle 0.3 80 0.3 80 0.3 80
Initial 0.287 ± 0.006 81.2 ± 1.4 0.280 ± 0.008 83.4 ± 0.5 0.285 ± 0.002 81.3 ± 0.3 Room temperature
REa (%) 0.302 ± 0.006
5.22% 86.4 ± 1.1
6.39% 0.300 ± 0.008
7.14% 86.4 ± 0.6
3.64% 0.304 ± 0.003
6.67% 86.5 ± 0.5 6.45%
RE (%)4°C 0.299 ± 0.005
4.18% 85.5 ± 0.5
5.21% 0.301 ± 0.020
7.50% 85.8 ± 0.5
2.90% 0.292 ± 0.006
2.46% 85.5 ± 0.5
5.16%
aRE (%) = 100% × (concentration calculated – initial plasma concentration)/initial plasma concentration.
bn = 3 for each concentration and cycle.
mL for each target compound and stored at 4°C and 25°C.
Stability was monitored after 24 hr. Plasma samples stored at 4°C and room temperature for 24 hr showed good stabilities. The RE (%) ranged from 2.46 to 7.50%, showing that processed QC samples kept at 4°C and room temperature (25°C) were stable for at least 24 hr.
VIII. Test Results
The procedure was applied in pharmacokinetic stud- ies by IV administration of CA to rabbits. Typical plasma concentration-time profiles of CA, FA, and IFA are shown in Figure 3. The plasma concentrations of CA, FA, and IFA were in the standard curve range. The plasma concentrations remained above the 0.1 µg/mL lower limit of quantification (LLOQ) for the entire sampling period.
The method developed by Wittemer et al.(21) required 500 µL of plasma and a complicated preparation procedure. In an animal model, the volume of biologi- cal sample was sparse. Therefore, this method could not apply to the animal studies. On the contrary, our devel- oped method provides many advantages such as simple and fast sample preparation procedure. It also avoids the sample lost and decreases the analytic variance.
The results demonstrated that this method is simple, sensitive, precise and accurate and reproducible. From the data obtained after IV administration of CA to rabbits, it is concluded that the method described herein offers the opportunity to derive pharmacokinetic param- eters with an acceptable accuracy and precision.
CONCLUSIONS
In the present study, the developed method was vali- dated in accordance with international guidelines for the validation of bioanalytical methods(22), and was used for the determination of metabolites in a metabolic study of caffeic acid after intravenous administration to rabbits.
The standard curves for each target compound showed a linear relationship over the concentration range of 0.1- 100 µg/mL. Thus, this method could provide a good precision, accuracy, and reproducible assay for the simul- taneous quantification of caffeic acid, ferulic acid, and isoferulic acid in rabbit plasma after intravenous admin- istration of caffeic acid.
ACKNOWLEDGEMENTS
The authors thank Su-Wen Zheng for help with the analysis of samples by HPLC. Financial support through research grants (TMC88-Y05-A130 and NSC95-2320- B038-033) from Taipei Medical University and the National Science Council of the Republic of China is gratefully acknowledged.
REFERENCES
1. Cui, C. B., Tezuka, Y., Kikuchi, T., Nakano, H., Tamaoki, T. and Park, J. H. 1990. Constituents of a fern, Davallia mariesii MOORE. I. Isolation and struc- tures of davallialactone and a new flavanone glucuro- nide. Chem. Pharm. Bull. 38: 3218-3225.
2. Ahn, M. R., Kumazawa, S., Hamasaka, T., Bang, K.
S. and Nakayama, T. 2004. Antioxidant activity and constituents of propolis collected in various areas of Korea. J. Agric. Food Chem. 52: 7286-7292.
3. Tsou, M. F., Hung, C. F., Lu, H. F., Wu, L. T., Chang, S.
H., Chang, H. L., Chen, G. W. and Chung, J. G. 2000.
Effects of caffeic acid, chlorogenic acid and ferulic acid on growth and arylamine N-acetyltransferase activity in Shigella sonnei (group D). Microbios 101: 37-46.
4. Lo, H. H. and Chung, J. G. 1999. The effects of plant phenolic, caffeic acid, chlorogenic acid and ferulic acid on arylamine N-acetyltransferase activities in human gastrointestinal microflora. Anticancer Res. 19: 133- 5. Harrison, H. F., Peterson, J. K., Snook, M. E., Bohac, 139.
J. R. and Jackson, D. M. 2003. Quantity and potential biological activity of caffeic acid in sweet potato [Ipomoea batatas (L.)] storage root periderm. J. Agric.
Food Chem. 51: 2943-2948.
6. Giovannini, L., Migliori, M., Filippi, C., Origlia, N., Panichi, V., Falchi, M., Bertelli, A. A. and Bertelli, A.
2002. Inhibitory activity of the white wine compounds, tyrosol and caffeic acid, on lipopolysaccharide-induced tumor necrosis factor-alpha release in human peripheral blood mononuclear cells. Int. J. Tissue React. 24: 53-56.
7. Thiel, K. D., Helbig, B., Sprossig, M., Klocking, R. and Wutzler, P. 1983. Antiviral activity of enzymatically oxidized caffeic acid against herpesvirus hominis type 1 and type 2. Acta Virologica 27: 200-208.
8. Bailly, F. and Cotelle, P. 2005. Anti-HIV activities of Figure 3. Plasma concentration-time profiles of caffeic acid, ferulic acid, and isoferulic acid, respectively, after a single intravenous administration of 10 mg/kg of caffeic acid to one rabbit.
0.01 0.10 1.00 10.00 100.00
0 30 60 90 120 150 180 210 240
Time (min)
Concentration(ug/ml)
Caffeic acid Ferulic acid Isoferulic acid
natural antioxidant caffeic acid derivatives: toward an antiviral supplementation diet. Curr. Med. Chem. 12:
1811-1818.
9. Perez-Alvarez, V., Bobadilla, R. A. and Muriel, P. 2001.
Structure-hepatoprotective activity relationship of 3,4- dihydroxycinnamic acid (caffeic acid) derivatives. J.
Appl. Toxicol. 21: 527-531.
10. Chung, T. W., Moon, S. K., Chang, Y. C., Ko, J. H., Lee, Y. C., Cho, G., Kim, S. H., Kim, J. G. and Kim, C. H. 2004. Novel and therapeutic effect of caffeic acid and caffeic acid phenyl ester on hepatocarcinoma cells:
complete regression of hepatoma growth and metasta- sis by dual mechanism. FASEB J. 18: 1670-1681.
11. Kono, Y., Kobayashi, K., Tagawa, S., Adachi, K., Ueda, A., Sawa, Y. and Shibata, H. 1997. Antioxidant activity of polyphenolic in diets. Rate constants of reactions of chlorogenic acid and caffeic acid with reactive species of oxygen and nitrogen. Biochim. Biophys. Acta 1335:
335-342.
12. Xu, J. W., Ikeda, K., Kobayakawa, A., Ikami, T., Kayano, Y., Mitani, T. and Yamori, Y. 2005. Down- regulation of Rac1 activation by caffeic acid in aortic smooth muscle cells. Life Sci. 76: 2861-2872.
13. Raneva, V., Shimasaki, H., Ishida, Y., Ueta, U. and Niki, E. 2001. Antioxidative activity of 3,4-dihydroxy- phenylacetic acid and caffeic acid in rat plasma. Lipids 36: 1111-1116.
14. Nardini, M., D’Aquino, M., Tomassi, G., Gentili, V., Di Felice, M. and Scaccini, C. 1995. Inhibition of human low-density lipoprotein oxidation by caffeic acid and other hydroxycinnamic acid derivatives. Free Radic.
Biol. Med. 19: 541-552.
15. Yamada, J. and Tomita, Y. 1996. Antimutagenic activity of caffeic acid and related compounds. Biosci.
Biotech. Biochem. 60: 328-329.
16. Cheng, J. T., Liu, I. M., Tzeng, T. F., Chen, W. C., Hayakawa, S. and Yamamoto, T. 2003. Release of beta- endorphin by caffeic acid to lower plasma glucose in streptozotocin-induced diabetic rats. Horm. Metab.
Res. 35: 251-258.
17. Baba, S., Osakabe, N., Natsume, M. and Terao, J. 2004.
Oral administered rosmarinic acid is present as the conjugated and/or methylated forms in plasma, and is degraded and metabolized to conjugated forms of caffeic acid, ferulic acid and m-coumaric acid. Life Sci. 75: 165-178.
18. Azuma, K., Ippoushi, K., Nakayama, M., Ito, H., Higashio, H. and Terao, J. 2000. Absorption of chloro- genic acid and caffeic acid in rat after oral administra- tion. J. Agric. Food Chem. 48: 5496-5500.
19. Cremin, P., Kasim-Karakas, S. and Waterhouse, A.
L. 2001. LC/ES-MS detection of hydroxycinnamates in human plasma and urine. J. Agric. Food Chem. 49:
1747-1750.
20. Rechner, A. R., Spencer, J. P. E., Kuhnle, G., Hahn, U.
and Rice-Evans, C. A. 2001. Novel biomarkers of the metabolism of caffeic acid derivatives in vivo. Free Radic. Biol. Med. 30: 1213-1222.
21. Wittemer, S. M. and Veit, M. 2003. Validated method for the determination of six metabolites derived from artichoke leaf extract in human plasma by high per- formance liquid chromatography-coulometric-array detection. J. Chromatogr. B 793: 367-375.
22. FDA guidance for industry-bioanalytical methods vali- dation. 2001. http://www.fda.gov/cder/guidance/4252fnl.
23. Uang, Y. S., Kang, F. L. and Hsu, K. Y. 1995. Determi-htm nation of caffeic acid in rabbit plasma by high perfor- mance liquid chromatography. J. Chromatogr. B 673:
43-49.