Abstract—Big Data has been used in many studies in recent years, and ITS (Intelligent Transportation Systems) is currently one of the development priorities of the world. Taiwan's Electronic Toll Collection (ETC) has collected a large amount of freeway traffic data from the detectors between interchanges since 2014. This paper will use ETC data and spatial analysis technology to investigate the impact range of Southern Taiwan Science Park.
The impact range had two parts: (1) how far the impact distance of the interchanges nearby science parks are, (2) how much traffic volume each affected interchange has. Then the impact result was visualized. According to the specific time of different categories, we compared to the spatial distribution of differences. The study interval is the weekday commuting time in the morning, and the study object is about passenger cars.
It is hoped that this study will provide a reference for Taiwanese construction sites in the future. And this study is not only more persuasive through the real data, but also establish a set of ETC data analysis process. At the same time we can help to build the database of impact range of other important constructions and visualize them as the basis for long-term observation, and trying to combine ETC data and urban planning by this study to make effective suggestions.
Keywords—Big Data, Electronic Toll System (ETC), Impact range, Science Park, Visualization.
I. INTRODUCTION
N recent years, Big Data has been used in many studies, and Intelligent Transportation Systems (ITS) is also the focus of development in the world today. Electronic Toll Collection (ETC) in Taiwan, which uses inter-channel detectors, collects a large amount of traffic data from 2014 with different forms of data releasing, such as origin-destination data. According to the study by Institute of Transportation, Ministry of Transportation (MOTC), passenger cars are still the highest proportion of travel mode in inter-city transport market in any length of trips, and related studies have proved that the use of ETC data is valuable.
According to the ETC operation status on officially website in Taiwan, the usage rate of ETC has reached 93% in May, 2016, and the success rate is about 99.9%. Many researches using ETC data are flourishing; however, they mainly focused on the improvement of traffic volume analysis and system operation management, and rarely linked between urban
Huei-Yun Hsu, is with Department of Urban Planning, National Cheng Kung University, Tainan City 70101, Taiwan (R.O.C.). (phone: +886-987-879-245; e-mail: anna82309@gmail.com).
Feng-Tyan Lin, is with Department of Urban Planning, National Cheng Kung University, Tainan City 70101, Taiwan (R.O.C.). (e-mail: ftlin@mail. ncku.edu.tw).
planning and ETC. Through this study, we used ETC data to be more persuasive. Besides, we proposed a process of analyzing ETC data and a database of the impact range of Science Parks. Then it can be established and visualized as a basis for long-term observation to increase the credibility of urban planning. The purpose of this study is to explore the impact range of passenger cars in inter-city of the Southern Science Park.
II. LITERATURE REVIEW
A. Big Data
Big Data has 6V characteristics: (1) Volume: a huge amount of data, (2) Variety: data including text digital, audio and video, structural and non-structural with various type, (3)Veracity: data from the direct perception of the actual phenomenon are real, (4) Velocity: data acquisition and analysis must be very fast, (5) Visualization: presentation of the results of the Visualization, and (6) Value: While Big Data can also break the traditional statistical sampling error situation, and directly analyze data with maternal statistics to increase the credibility and obtained the potential value in them [18].
B. Impact Range
The study of traffic impact range mainly focuses on the traffic impact caused by one single construction project. These topics include Freeway capacity, Freeway grade and saturation flow, etc. [4]. According to the Traffic Impact Assessment Guidelines for Buildings of R.O.C. and the Traffic Impact Assessment Manual of Institute of Transportation, MOTC, the Freeway impact assessment within the scope of the project radius of 500 meters is mostly taken as the research area. This study will focus on a wider range of areas such as cross-county area of traffic, and the scope of impact range will be defined detailed follow-up.
C. Freeway and urban planning
In the study of Freeway and urban planning, there have been studies on defining the population impact area of the Freeway by using Geographic Information Systems (GIS) method [1]. The space units was borough, and come up with population changing in the 15 kilometers around the interchanges is the most significant effect [19]. There was also a 15-minute interchange within the range of the study, the highway construction for the regional population and industrial development in space and time are affected, and in the space also had the different size of the impact domain [7].
Investigating the Impact Range of Southern
Taiwan Science Park Using ETC Data
Huei-Yun Hsu, Feng-Tyan Lin
A research studied by Institute of Transportation, MOTC concluded about the characteristics of origin-destination after opening the Freeway No. 5 through the transport corridor from Taipei metropolitan to Yilan area. The main analysis were not only about the traffic volume and traffic speed of the Freeway, but also with a questionnaire survey to estimate the characteristics and purpose of travel trips, and sorting the top five pairs trips of Taipei-Yilan from different days by transport, purpose and counties. The study analyzed the number and percentage of trips at the same time and compared the growth rate past several years. In terms of inter-city transport, MOTC suggested that passenger cars were still the highest proportion of all travel length in inter-city transport market, accounting for about 79% of the overall travel trips [15].
D. Electronic toll collection system (ETC)
Many of the studies on ETC are mostly based on the study of dynamic traffic flow estimated and the establishment of a dynamic traffic flow matrix [9][16][20]. But the data were too old or incomplete to be modeled. The rest of the studies was more about the relationship of traffic, such as traffic flow, speed, and traffic behavior [21][23]. This study will use the ETC data which are more complete and correct in origin-destination pairs.
III. OVERVIEW OF THE STUDY AREA
Ministry of Science and Technology, which is the highest research authorities of the R.O.C., established Northern, Central and Southern Taiwan Science Parks that have promoted economic development in Taiwan. Many studies have confirmed that the Science Parks for regional development have considerable impact [10][11] such as residential demand and commuting behavior, etc.[12].
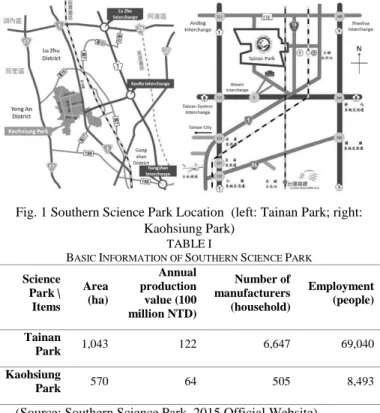
The research object is Southern Taiwan Science Park, which is divided into Tainan Science Park and Kaohsiung Science Park. According to the official website of the Southern Science Park, Tainan Park, located between Tainan Xinshi, Shanhua and Anding three districts of Tainan city with 1,043 hectares, and the main industry are optoelectronics, integrated circuits, precision machinery, biotechnology and green energy industries. Kaohsiung Park, located between Luzhu, Gangshan and Yongkang three districts of Kaohsiung city with 570 hectares, the main industry are photoelectric, precision machinery and biotechnology (medical equipment). The statistics related to the basic information as shown in the table below. Next to Tainan Park there are five interchanges which are Anding Interchange and Tainan System Interchange of Freeway No.1, Shanhua Interchange and Shinhua System Interchange of Freeway No.3 and Shinshi Interchange of the Freeway No.8 which can be transferred by System Interchange. Since the ETC data does not include the freeway of east-west direction, it is assumed that commuters of passenger car that use the freeway to enter and exit the Tainan Park via the interchanges mentioned above. And the interchange used by commuters of Kaohsiung park is usually Kaoke Interchange, it is assumed that in commuting time passenger cars will use the Kaoke Interchange across the districts arrive Kaohsiung Park.
Fig. 1 Southern Science Park Location (left: Tainan Park; right: Kaohsiung Park)
TABLEI
BASIC INFORMATION OF SOUTHERN SCIENCE PARK Science Park \ Items Area (ha) Annual production value (100 million NTD) Number of manufacturers (household) Employment (people) Tainan Park 1,043 122 6,647 69,040 Kaohsiung Park 570 64 505 8,493
(Source: Southern Science Park, 2015 Official Website) IV. RESEARCH METHODS
In this study, we will use Excel software for statistical analysis, mainly using narrative statistical operations, and using GIS as a visualizing tool.
A. Definition of impact range
This study is divided into two parts to define impact range. The first part is the extent of the interchanges affected by a certain construction, and the farthest from the south to the north is extended to two interchanges respectively. The second part is the traffic flow of each affected interchange. Then visualize both of the impact with GIS.
B. Research framework
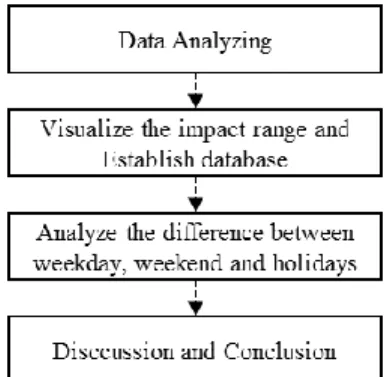
As shown in Fig.2 below, commuting time in weekdays morning is mainly used as the research period in the data analysis stage. The report research by MOTC in 2015 defined Tuesday to Thursday morning and afternoon as weekdays, and compared with weekends and holidays respectively. We concerned about the passenger cars in commuting hours that set from 7 am to 9 am. Then visualize the data described above and establish daily database. At last discuss and conclude the results.
Fig. 2 Diagram of Research framework
V. DATA
The data of this study is from "Transport Database" of Taiwan Area Freeway Bureau, MOTC, with the original data (M06) of the travel trips from 2013 in the ETC database. This data includes daily and hourly vehicles, time and numbers of interchanges, driving distance, and so on. This study will be extracted due to data continuity in January, 2015 and 2016, including three different types of day which are weekdays, weekends and New Year's holidays.
Fig. 3 ETC (M06) Raw data schematic diagram (Source: Taiwan Area Freeway Bureau)
Fig. 4 Distribution area of ETC data VI. RESULTS
A. Impact range of Tainan Park
Assuming that commuters with passenger cars using the above-mentioned six interchanges on weekdays are all entering the Tainan Park for work, on January 6, 2016, as shown in the following figure, most of them used Tainan Interchange to Tainan Park. The maximum number of passenger cars is about 1,000, followed by Yongkang Interchange, Guanmiao
Interchange, Dawan Interchange and Madou Interchange. The traffic flow is about 400 to 800 vehicles, and the farthest distance was from Hsinchu to Taichung. And the other interchanges, about 10 or so, should not be normal travel trips.
Tainan City accounted for 70% of all commuting travel trips, which affected all area of Tainan. Kaohsiung City accounted for 1.5%. The greatest impact volume is Tainan urban areas, while Kaohsiung is more evenly distributed. The impact range of Tainan Science Park is from Hsinchu to Pingtung about 9 counties, but it is not in decreasing form, it is even across districts and counties. There were no impact range in some cities such as Miaoli and Taichung County.
Fig. 5 Impact range of weekdays commuting to Tainan Park (passenger car)
B. Impact range of Kaohsiung Park
Assuming that commuters using passenger cars arriving at Kaoke Interchange on weekdays are all vehicles entering the Kaohsiung Park for work. On January 6, 2015, for example, as Fig.6 shows below most of commuting cars arrives at the Southern Science Park through Rende System Interchange and Luzhu Interchange, with a volume about 500 to 550 vehicles, followed by the southern urban area and the Nanzi area, with 250 to 300 vehicles each. There are few passenger cars from Taichung which is middle of Taiwan to Chiayi City. Most of commuting trips are from Tainan City and Kaohsiung City, each of them is nearly 50%, but Tainan City is more concentrated in Rende area, old Tainan City and Yongkang area. Kaohsiung is more evenly distributed in Luzhu area, Gangshan area and Kaohsiung City. The reason is that the population of Tainan and Kaohsiung City should be concentrated in the old urban area, while the urban area of Kaohsiung City is a narrow development between north and south, and the volume distribution is more average than Tainan City.
Fig. 5 Impact range of weekday commuting to Kaohsiung Park (passenger car)
C. Total volume of Tainan Park
From Fig.6 below we can see that the daily commute time is about 8,000 passenger cars. From Jan. 1th to Jan. 4th, 2015, there were only 3,000 buses on New Year Holiday, and around 4,000 on weekends. Tainan Park has been established around 20 years so that the transportation is well developed, not only freeway but the train and bus can arrive Tainan Park easily. Besides, living facilities are very convenient nearby, commuters using passenger cars only 1% of the number of employees. There are many tourist spots such as Shanhua Painting Village, Brewery and Totoro Bus Station, etc. that attract people go there on weekends or holidays.
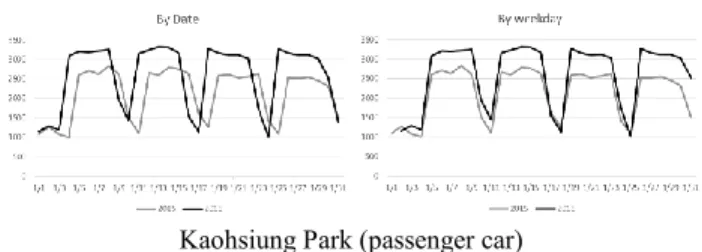
Between 2015 and 2016, the amount of volume and
commuting patterns are similar, as shown below, we speculated that the development of Tainan Park has become more mature so it changed little. According to the official website, the number of employees in January 2015 had 72,634 people, in January 2017 had 71,313 people. There was a decrease of about 1,300 people, as discussed above, only 1% of the number of employees used passenger cars to commute.
Fig. 6 Total traffic volume of Weekday Commuting to and from Tainan Park, 2015(passenger car)
Fig. 7 Total traffic volume of Weekday Commuting to Tainan Park between 2015 and 2016(passenger car)
D. Total volume of Kaohsiung Park
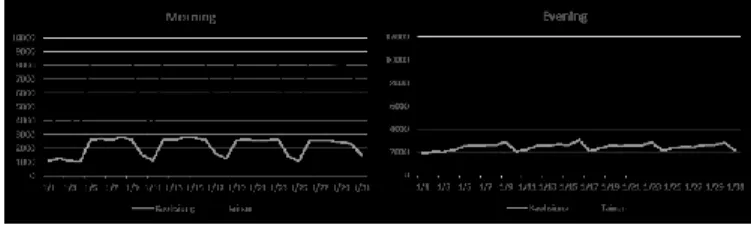
From Fig.7 below we can see that the daily commute time is about 2,500 passenger cars. From Jan. 1th to Jan. 4th, 2015, for New Year holiday with an average of about 1,000 passenger cars, and Saturday weekend can reach about 1,500, Sunday to a slight decrease to 1,000 to 1,300, it is assumed that the reason weekend and holiday traffic is still more is Yong-an Fish Harbor which is far about 10 km from the west of Kaoke Interchange. Assuming that the car capacity is only one person which means about in 8,000 employees, there were 30%-40% of people using passenger cars. In addition, compared with the commuting time in the evening, from 17:00 to 19:00 assuming that all passenger cars start driving from Kaoke Interchange is commuting home from work, compared volume with less than time to work, speculated that the reason for the longer working hours, so the volume between 17:00 to 20:00 is more consistent. But on Friday the volume from 17:00 to 19:00 commuter vehicles will be matched with the morning, presumably it is close to the weekend.
And the two years of commuter traffic patterns are almost the same, but the number of minor changed, as shown below, in 2016, traffic volume increased more 500 passenger cars than in 2015, the number of employees in January 2015 was 6,601, and in January 2016 it was 8,092 It was an increase of about 1,500 employees. This corresponds to the volume of passenger cars of commuting between 30% and 40% on weekdays as mentioned above.
Fig. 8 Total traffic volume of Weekday Commuting to and from
Kaohsiung Park (passenger car)
Fig. 9 Total traffic volume of Weekday Commuting to Kaohsiung Park between 2015 and 2016 (passenger car)
In the analysis we also set up two types of database, as shown below for the table contains the daily commute time, number of interchange, vehicle type and the total volume over the years. The other one is visualization with the aforementioned data as the basis and operating GIS for comparison and analysis.
Fig. 10 Schematic diagram of impact range
E. Comparative analysis
Tainan Park and Kaohsiung Park, a difference of nearly six times the number of employees, the number of passenger car is only about four times, because of better residential properties and transportation like free shuttle bus and train stations around Tainan Park. From the commuting time in evening there can be found the same type, that is, every Friday will be early to get off work, other than weekdays, Monday to Thursday are between about 17:00 to 20:00. On Friday passenger cars from Tainan Park were even more than morning, seems that some employees stay around Tainan Park on weekdays and return home on weekends, but in Kaohsiung Park there was no big difference.
Fig. 11 Total traffic volume of Weekday Commuting to and from Tainan Park and Kaohsiung Park (passenger car)
VII. DISCUSSION
There are still some research limitations in this study. One of limitations is that we cannot know the origin and destination of the vehicles without the ETC identification stickers so that they can not be included in this study. In addition, the use rate of ETC over the years and the number of users are different, to compare different years it may cause research errors if necessary in the future. And this study mainly discusses the passenger cars inter-city, it cannot be analyzed if the cars took the province road, county road or general road.
According to the analysis mentioned in [15], it can be concluded that the length of the commuter trip inter-city is about 20 to 50 km, and from Tuesday to Thursday across the living circle of travel trips, the usage rate of passenger cars used for commuting and business is over 60%, it is persuasive for this study. Besides, the highest volume of the purpose of trips across Tainan and Kaohsiung City is about visiting relatives and friends (37.6%), followed by commuting to work (11.7%) and business (21.4%), the proportion of commuting and business is lower than visiting, which conflict to this study. One of the reasons is this study include the inner of Kaohsiung city. Reference [15] also can explain the volume of weekends
between Tainan and Kaohsiung City. Visiting relatives and friends is the highest proportion of purpose of the trips (49.3%), while leisure and entertainment (35.3%) for the second highest. In Southern Science Park, between the two parks from Monday to Thursday is almost the same volume of passenger cars.
VIII. CONCLUSION AND SUGGESTIONS
It is hoped that this study can provide a reference for site selection on Taiwanese construction in the future. And this study is not only more persuasive through applying the real data, but also establish a set of ETC data analysis process. We build the database of impact range of important constructions and visualize them as the basis for long-term observation, and trying to combine ETC data and urban planning by this study to make effective suggestions.
Tainan Park, a total of six interchanges analysis, research results may be more biased. Because we cannot know whether the cars went by system interchange always drive to Freeway No.8 interchanges exit freeway and arrive Tainan Park. In the future it may use VD data for comparison. The VD data provided by MOTC include the traffic flow from east to west freeway and provincial road, but it does not include the direction, and the result of cross-comparison with ETC may be more accurate.
Follow-up this study can be coupled with buses and trucks of the situation, and complete the impact range of other science parks and comparative analysis. Other kinds of construction such as tourist spot and transport, recreation areas, airports and ports can be added to improve the impact range of the database.
ACKNOWLEDGMENT
We would like to thank Taiwan Area Freeway Bureau, MOTC R.O.C. and Institute of Transportation, MOTC R.O.C. for providing relevant information.
REFERENCES
[1] Pai, J. T., Yueh, Y. J., and Lin, C. Y. (2000). Spatial Impacts of Chung-Sun Freeway on The Industrial Development In Taiwan's West Corridor. City and Planning, 27, No.22, 11-232.
[2] Lee, W. X., Wang K. H. and Lee Z. H. (2011), Freeway Electronic Toll Collection System. Scientific development, 468, 26-31。
[3] Hu, S. J. and Yang H. H. (2009). Application of Time Series and Toll Station Simulation Mode in Demand Forecast and Lane Configuration of Electronic Toll Ride: A Case Study of Taishan Toll Station. Journal of Transportation, 21, No. 2, 145-178.
[4] Peng, S. C. (2007). My Opinion on Freeway Electronic Toll Collection System. Economic outlook, 109, 30-34.
[5] Lai, Y. H. (2012). The impact freeway users to explore the use of ETC behavior factors. Journal of Yuda University, 32, 51-64.
[6] Luo, X. X., Wang, Y. Z., Song, Y. W., Hong, H. and Haung, J. L. (2015). Research on the Application of e-Tag Technology. Urban Transport, 30, No.1, 87-102.
[7] Chen, X. X. (2012). The Influence of Freeway System Construction on Population and Industrial Spatial Distribution in Taiwan. Master of Land Economics, National Chengchi University.
[8] Ye, Y. J. (2011). Study on Traveling Behavior of Car Driver in Freeway Electronic Toll Collection System. Master of Civil Engineering, Jinan Inter University.
[9] Ye, Y. H. (2010). Study on Estimating Freeway Time - Dependent Travel Schedule from Electronic Toll Collection Information. Master of Transportation Management, Tamkang University.
[10] Cheng, S. C. (2009). A Study of the Relationship Between the Operations of Southern Science-based Industrial Park and the Area Development of Tainan County.Master of Science and Technology Management, Lide University
[11] Tsai, S. Y. (2003). The Influence of Hsinchu Science Park on the Development of Hsinchu Region. Master of History, National Chungking University.
[12] Sheng, T. K. (2002). Housing Demands and Commuting Patterns of Science-based Industrial Park Employees – a case study of Hsin-Chu Science Park. Master of Institute of Environmental Policy, National Donghua University.
[13] Institute of Transportation, MOTC R.O.C. (1994). Study on the Influence of High- speed Transportation System in Western Corridor of Taiwan Region on Regional Development. Taipei, Taiwan. Institute of Transportation, MOTC R.O.C..
[14] Institute of Transportation, MOTC R.O.C. (2011). Freewayside Facilities Instant Traffic Information Release Standard Format v1.1. Taipei, Taiwan. Institute of Transportation, MOTC R.O.C..
[15] Institute of Transportation, MOTC R.O.C. (2015). The 5th Overall Transport Planning Study Series - Inter - city Trip Characteristics Investigation and Preliminary Analysis. Taipei, Taiwan. Institute of Transportation, MOTC R.O.C..
[16] Tamkang University (2010). Study on the E-Toll Rate of Freeway by Mileage. Taipei, Taiwan. Commissioned by Taiwan Area Freeway Bureau, MOTC R.O.C.
[17] THI Consultants Inc. (2010).Study on the Characteristics of Trips from the North Transportation Corridor to the Yilan Area. Taipei, Taiwan. Commissioned by Institute of Transportation, MOTC R.O.C.
[18] Mayer-Schonberger V. and Kenneth C. (2013). Big Data:A Revolution That Will Transform How We Live, Work, and Think. Eamon Dolan/Mariner Books; Reprint edition.
[19] Pai, J. T. and Haung, J. C. (2004). Study on the Change of Population Growth and Spatial Distribution Pattern in the Areas along Freeway No.1. Taiwan Population Association Annual Meeting 2004 and Seminar on Population, Family and Health Policy Review and Outlook, Taipei, Taiwan.
[20] Kim, J., Kurauchi, F., Uno, N., Hagihara T., and Daito, T. (2014).Using Electronic Toll Collection Data to Understand Traffic Demand. Journal of Intelligent Transportation Systems, 18,190–203.
[21] Weng, J., Yuan, R., Wang, R., and Wang, C. (2014).Freeway Travel Speed Calculation Model Based on ETC Transaction Data. Computational Intelligence and Neuroscience, 2014.
[22] Yang, S., Liu, X., Wua, Y. J., Woolschlager, J. and Coffin, S. L. (2015).Can freeway traffic volume information facilitate urban accessibility assessment? Case study of the city of St. Louis. Journal of Transport Geography, 44, 65 - 75.
[23] Zhao, N., Qi, T., Yu, L., Zhang, J. and Jiang, P. (2014).A Practical Method for Estimating Traffic Flow Characteristic Parameters of Tolled Freeway Using Toll Data. Social and Behavioral Sciences, 138, 632 - 640.
[24] Zhao, N., Qi, T., Yu, L. and Jiang, P.(2013a).Analysis on Traffic Characteristics of Passenger Cars with More Than 7 Seats on Megacity’s Freeway Network Using ETC Data. Advanced Materials Research, 779,831 - 835.
[25] Zhao, N., Qi, T., Jiang, P., Wang, D. and Yao, B.(2013b).Traffic Characteristics Analysis on Freeway during Holiday in Tianjin using ETC Data.20th ITS World Congress, Tokyo