Related factors and incidence risk of acute myocardial infarction among the people with disability: A national population-based study
Ying-Ying Huang
a,b, Pei-Tseng Kung
c, Li-TingChiu
b, Wen-Chen Tsai
a,*
a
Department of Health Services Administration, ChinaMedicalUniversity, Taichung, Taiwan, R.O.C.
b
China Medical University Hospital, Taichung, Taiwan, R.O.C.
c
Department of Healthcare Administration, Asia University, Taichung, Taiwan, R.O.C.
*Corresponding author: Professor Wen-Chen Tsai, Dr.PH
Address:No.91 Hsueh-Shih Road, Taichung 40402, Taiwan, R.O.C.
Tel: +886-422073070 Fax: +886-422028895
Email:[email protected]
Abstract
Cardiovascular disease has always been a leading cause of death worldwide. Because the mobility of people with disability is relatively decreased, their risk of cardiovascular disease is increased. This study investigated the risks and relevant factors of acute myocardial infarction (AMI) among people with disability.This is a retrospective cohort study based on secondary data analysis. This study focused on 798,328 people with disability who were aged 35 and above during 2002–2008 and were registered in the National Disability Registration Database; the relevant medical data from 2000–2011 were acquired from the National Health Insurance Research Database. A Cox proportional hazards model was adopted for analyzing the relative AMI risks among different disability types and finding latent risk factors.The results indicated that the AMI incidence rate (per 1000 patient-years) among people with disability was 2.48. Men had an AMI incidence rate of 2.68 per 1000 patient-years, which was significantly higher than that of women (2.21; p< .05). The AMI risk for people with mental disabilities was 0.76 times the risk for people with physical disabilities (95%
confidence interval [CI] = 0.71–0.82). The AMI risk for people with profounddisabilities was 2.04 times(95% CI = 1.93–2.16) the risk for people with mild disabilities. AMI risk increased with age. People with disability aged 65 and above had an AMI risk that was 5.01–6.03 times the risk for people with disability aged below 45. Disabled indigenous people had a relatively higher AMI risk (HR = 1.35, 95% CI = 1.19–1.52).The AMI risk for people with disability with a Charlson comorbidity index (CCI) of 4 and above was 5.89 times(95% CI = 5.56–
6.25) the risk for those with a CCI of 0. Compared with people with physical disabilities, people with visual impairment and people with dysfunctional primary organs had
significantly higher AMI risks (HR = 1.15; HR = 1.66). This study found that people with
disability who were male, aged 65 and above, married, indigenous, with physical disabilities,
with high comorbidity, or with high disability levels had relatively higher AMI risks than
other people with disability. The research outcomes canbe used as references by public health
authorities to improve the engagement of people with disability in AMI-prevention health services.
Keywords:Disabilities;Acute myocardial infarction;Risk factor;Physical
disability;Mentaldisability
Related factors and incidence risk of acute myocardial infarction among the people with
disability: A national population-based study
1. Introduction
According to the statistics publicized by the Ministry of the Interior in 2013, 1,117,521 people in Taiwan were registered as disabled by the end of 2012, which was 4.8% of the total population(Ministry of the Interior, R.O.C; 2013). A report by the World Health Organization (WHO; 2013) also indicated that people with disability comprised approximately 15% of the world population. The prevalence of disability increases with age (Klijs, Nusselder, Looman,
& Mackenbach, 2011). A study conducted in Holland also found that an increasing life expectancy existed among people with disability aged 65 and above(Perenboom, Van Herten, Boshuizen, & Van Den Bos, 2004). Cardiovascular disease (CVD) is a major cause of death among people aged 65 and above, and the related medical expenses constantly increase (North & Sinclair, 2012).
Acute myocardial infarction (AMI) is a type of ischemic heart disease that requires immediate medical treatment. The WHO hasranked CVD as the number one cause of death that is responsible for 30% of human deaths worldwide as well as disability-adjusted life years. The WHO predicted that CVD would cause 23 million deaths by 2030 (WHO, 2011;Yusuf et al.,2004). According to the National Heart, Lung, and Blood Institute (NHLBI,2006) in the United States, approximately 1,100,000 cases of heart attack occur in the United States annually, within which 515,000 die of AMI and 51% of which are men.
AMI often occurs without warning signs, or if symptoms existed, they tend to be neglected.
Consequently, more than half of the patients with AMI died before arriving at hospitals (NHLBI, 2006). Statistics from 2008 indicated that the incidence rate of AMI in the United States was approximately 208 per100,000person-years(Yeh et al., 2010). The statistics announced by Denmark in 2012 showed that the AMI incidence rate was 213 per 1000 men and 131 per 1000 women 100,000peoples in 2008 (Schmidt, Jacobsen, Lash, Bøtker, &
Sørensen, 2012). In Japan, a 30-year follow-up study revealed that the AMI incidence
rate(per100,000 person-year) increased from 7.4 per 100,000 person-years in 1979 to 27 per
100,000 person-yearsin 2008 (Takii et al., 2010). According to the statistics publicized by the Health Promotion Administration in Taiwan in 2010, the AMI incidence rate in Taiwan increased from 39.2 per 100,000person-years in 1996 to 79.8 per 100,000 person-yearsin 2009, indicating that it doubled within 13 years (Health Promotion Administration, 2010).
A worldwide study on the risk factors for AMI in 2004 indicated that men had a higher AMI incidence rate and a lower age of onset than women did, and that the relevant risk factors involved smoking, dyslipidemia, diabetes, hypertension, abdominal obesity, diet, exercise, and sociopsychological factors (Yusuf et al., 2004). After adjusting age, gender, and city, the overall risk of coronary artery disease for individuals with moderate or severe disabilities was 2.2 times higher than that for people without disability(Plichart et al., 2010).
In addition, variables such as region, ethnicity, income, and educational attainment increased AMI risk (Rosengren et al., 2009; Steyn et al., 2005).
However, the frequency at which peoplewith disability usedpreventive health services such as pap smear, mammography, and prostate-specific antigen tests was greatly lower than the ideal rate of use(Armour, Thierry, & Wolf, 2009; Huang, Tsai, & Kung, 2012; Kung, Tsai, & Chiou, 2012; Ramirez, Farmer, Grant, & Papachristou, 2005).Thenumber of people with disability is increasing yearly, and as they age, get chronic diseases, or engage in decreased amounts of physical activity, AMI incidence rates increase. As AMI risk increases while the use of preventive health services remains insufficient, people with disability may experience higher morbidity than people withoutdisabilitydo. Therefore, this study
investigated the AMI risk ofpeople with disability and relevant factors for obtaining references for the formulation of preventive health policies.
2. Materials and methods 2.1. Data sources and participants
This study was a retrospective and longitudinal cohort study. The data were collected
from two sources, the National Health Insurance Research Database published by the
Ministry of Health and Welfare in Taiwan and the National Disability Registration Database of Taiwan compiled by the Ministry of the Interior. Since the National Health Insurance was implemented in Taiwan in 1995, the percentage of insured people has exceeded 99.5%. The National Health Insurance Research Database includes every patient’s medical information regarding outpatient records, emergency cases, hospitalizations, prescriptions, medical treatments, medical institutes, and doctors (National Health Insurance, 2013). Therefore, the data acquired from the Databasesareconsidered complete and reliable (Cheng, 2003; Sun et al., 2012).
This study focused on all the people with disability in the database who were aged 35 and above during 2002–2008 and were not in a vegetative state. The observation was
conductedfrom 2000 to the end of 2011. The patients with AMI were primarily diagnosed by usingthe ICD-9-CM (The International Classification of Disease, Ninth Revision, Clinical Modification), andthe codes 410, 410.x, 410.x0, or 410.x1 were assigned during
hospitalization. The participants who had been diagnosed with AMI before becoming disabled were excluded. This study has been approved by the research ethics committee of China Medical University and Hospital (Institutional Review Board No. CMU-REC-101- 012).
2.2. Variables Description
This study included the following variables: (1) demographics: gender, age, educational attainment, marital status, and indigenous status; (2) 17 disability types:people in
vegetativestates were excluded; physical disabilities included visual impairment, hearing
impairment, balance disorder, speech and language disorder, dysfunction of the primary
organs,physical disability, facial impairment, intractable epilepsy, and rare diseases; mental
disabilities included intellectual disabilities, dementia, autism, chronic mental disorders,
chromosomal abnormalities, congenital metabolic abnormalities, and other congenital
disorders;we further divideddisabilities into the categories of physical, mental, or both
(Verger et al., 2005); additionally, disability levels involved mild, moderate, severe, and extremely severe; (3) economic factors: 7 groups were formed based on monthly income; (4) environmental factors: levels of urbanization of residence area (7 levels, within which Level 1 represents the highest level of urbanization and Level 7 denotes the lowest level of
urbanization); in this study, the levels were categorized into four levels, namely, Level 1, Levels 2-3, Levels 4-5, and Levels 6-7, to facilitate analysis and discussion;(5) health
conditions: the Charlson comorbidity index (CCI; Deyo, Cherkin, & Ciol, 1992) was adopted in this study and 19 diseases were involved and assigned with a score of 0, 1, 2, 3, or ≥4.
2.3. Statistical analysis
This study adopted the SAS 9.3 statistical software for data analysis. Regarding
descriptive statistics, the number of people, percentages, and AMI incidence rates for people with disability were calculated based on the five dimensions of disability characteristics, demographics, economic factors, environmental factors, and health conditions. Regarding inferential statistics, we performed chi-square tests to analyze variables for verifying their correlation with AMI risk. A Cox proportional hazards model was employed for analyzing the AMI risk ofpeople with disability and relevant factors. The studyobservation time was during 2002–2011, and month was used as the unit for time. Confirmed AMI diagnoses were considered as events, whereas nonoccurrence of AMI or death during the study was regarded as censored. Additionally, the Cox proportional hazards model was used again to analyze the relative risks and relevant factors for the incidence of AMI among people with different types of disabilities.
3. Results
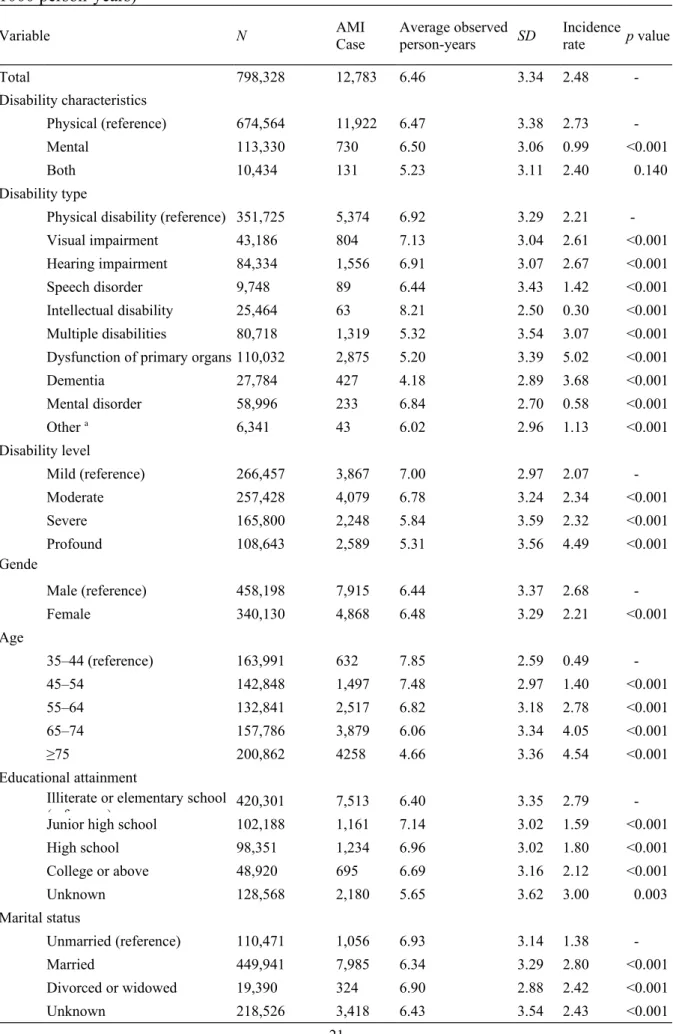
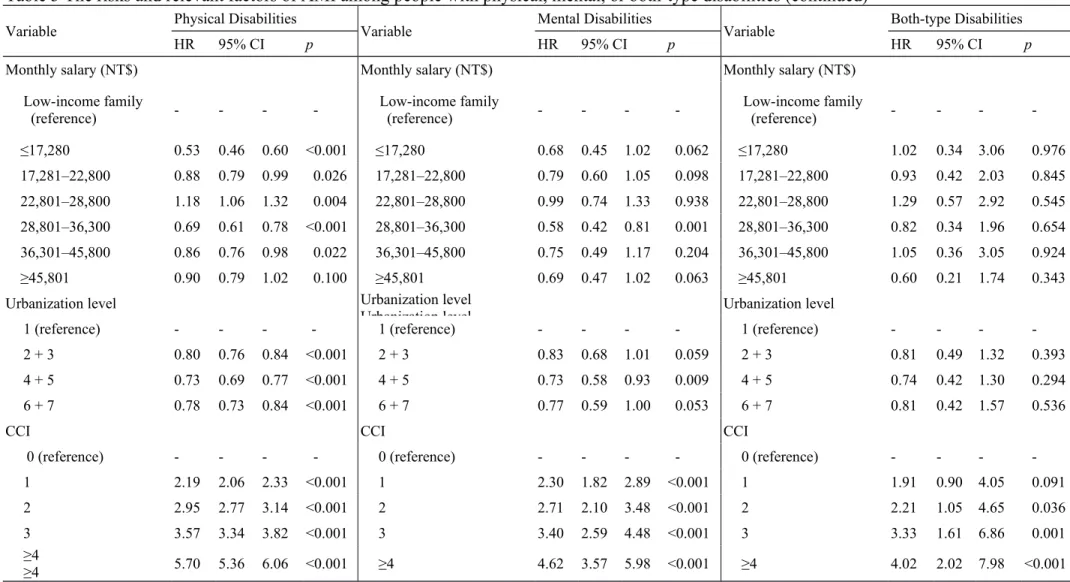
The analysis included 798,328 people with disability from 2002 to 2008. The average
observation period for each individual was 6.46 ± 3.34 years, during which 12,783 people
suffered from AMI, generating an annual incidence rate of 2.48 per one thousand people. The
incidence rates mentioned hereafter were calculated based on the unit of per 1000 person-
years (Table 1).
According to the demographic analysis, men had an AMI incidence rate of 2.68, which was higher than that of women, which was 2.21. People aged 35–44 had an AMI incidence rate of 0.49. The AMI incidence rate increased with age, and people aged 75 and above had the highest rate (4.54). Regarding educational attainment, the AMI incidence rate (2.79) among the people who were illiterateorhad elementary school educations was the highest, followed by that among the people with college educationsand above (2.12). Compared with theunmarried people, who had an AMI incidence rate of 1.38, married and divorced/widowed people had higher incidence rates (2.80 and 2.42, respectively). Regarding indigenous status, no significant difference (p> .05) existed between the AMI incidence rate of indigenous people (2.46) and that of nonindigenous people (2.48). Concerning disability types, people with intellectual disabilities or mental disorders had relatively lower incidence rates (0.30 and 0.58, respectively). Regarding disability characteristics, people with physical disabilities had an incidence rate of 2.73, whereas people with mental disabilities had a significantly lower rate of 0.99. In addition, AMI incidence rates increased with disability levels.
Regarding economic factors, people withmonthly salary lower than NT$17,280 had the lowest AMI incidence rate (1.29), whereas people with monthly salary of NT$22,801–28,800 had the highest AMI incidence rate (3.26), followed by those with monthly salary of
NT$45,801 and above (3.04). The AMI incidence rate among the people with disability in low-income families was 1.74. Regarding urbanization of residence area, the AMI incidence rate was the highest (3.02) in Level-1 highly developed and urbanized areas, and the rates in the areas of the other three levels were 2.34, 2.28, and 2.53. People with higher CCIs
exhibited significantly higher incidence rates. The AMI incidence rate among the people with a CCI of more than 3 was eight times higher than that among the people without comorbidity (7.26 vs. 0.87)
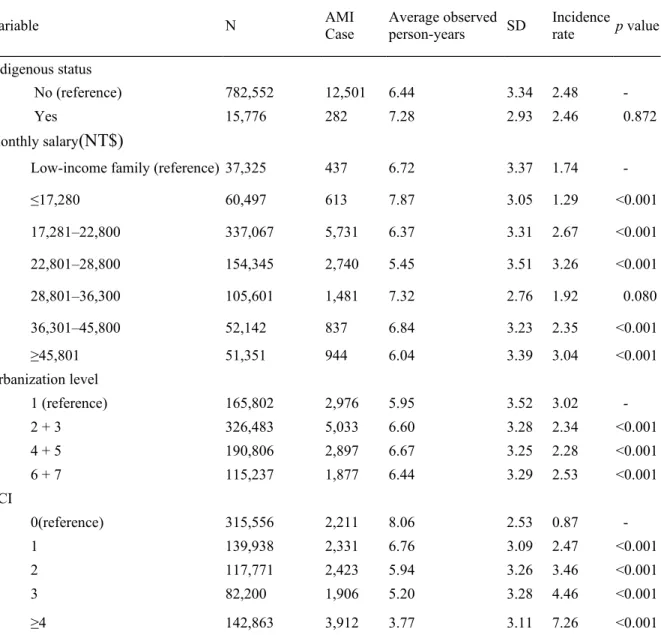
The Cox proportional hazards model was adopted in this study (Table 2). The disability
characteristics were categorized into physical disabilities, mental disabilities, and both.
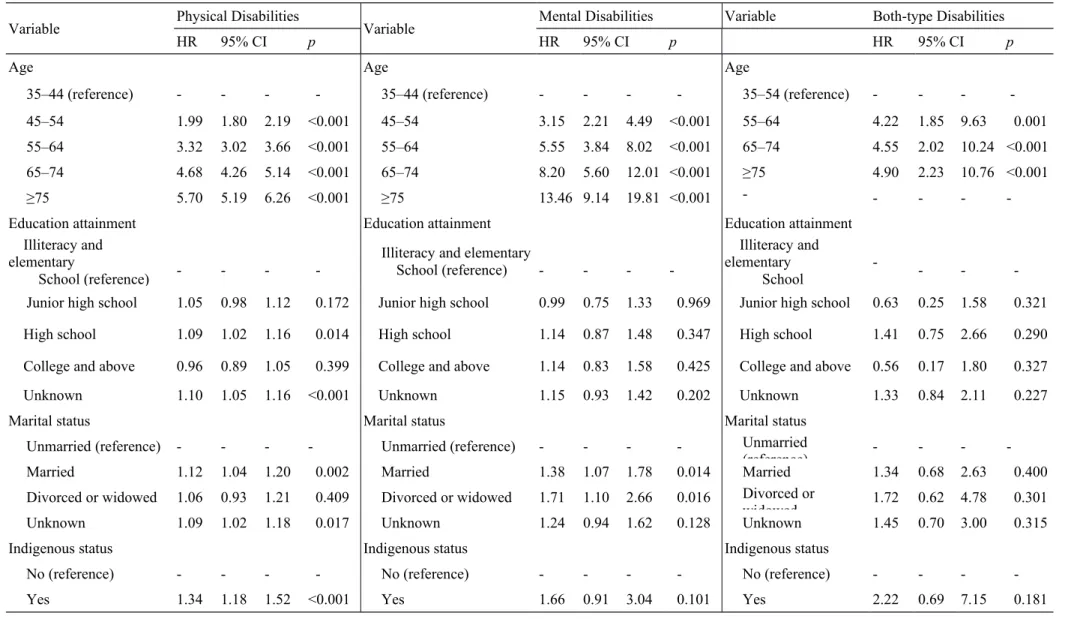
According to Model A in Table 2, when the other variables were controlled, the AMI risk for people with mental disabilities was 0.76 times the risk for those with physical disabilities (95% CI = 0.71–0.82, p< .05); conversely people with physical disabilities had 1.32 times the risk of AMI that those with mental disabilitiesdid. The AMI risk for people with both types of disabilities was 0.60 times the risk for those with physical disabilities (95% CI = 0.51–0.72, p< .05). Regarding the variables (Table 2; Model A), relatively higher AMI incidence rates
occurred among people withprofound disabilities, men, older people, married people,
indigenous people, people with moderate incomes, and people with high CCIs. The AMI risk for the people with profound disabilities was 2.04 times the risk for those with mild
disabilities (95% CI = 1.93–2.16, p< .05). Women had a lower AMI risk than men did (HR=.70, 95%CI= 0.67–0.73, p<.05). AMI risk increased with age;the AMI risk among people aged 65 and above was 5.01–6.03 times higher than the risk for those aged below 45.
The AMI risk among people with high school educations was 12% greater than that among people who were illiterateorhad elementary school educations(HR = .12, 95% CI = 1.05–
1.20, p< .05). Married people had a higher AMI risk than unmarried people did (HR = 1.17, 95% CI = 1.10–1.25, p < .05), andindigenous people had comparatively higher AMI risk as well (HR = 1.35, 95% CI = 1.19–1.52). The AMI risk for people with a monthly salary of NT$22,801–28,800 was 21% higher than the risk for those in low-income families (HR = 1.21, 95% CI = 1.09–1.34, p< .05). AMI risk also increased with increasing CCI. The AMI risk for people with a CCI of ≥4 was 5.89 times higher than the risk for those with a CCI of 0 (95% CI = 5.56–6.25, p< .05). Compared with people living in Level-1 urbanized areas, those living in areas with urbanization level of 2–7 exhibited lower AMI risk.
Model B in Table 2 shows that people who were visuallyimpaired orhad primary organ dysfunction had significantly higher AMI risks than people with physical disabilities
did,yielding AMI risks of 1.15 (95% CI = 1.07–1.24) and 1.66 (95% CI = 1.56–1.76),
respectively. Significantly lower than the others, the AMI risk for people with speech disorders and that for people with intellectual disabilities were 0.77 (95% CI = 0.62–0.954) and 0.37 (95% CI = 0.29–0.48), respectively. The results indicated that people with physical disabilities had a higher AMI risk than those with mental disabilities did.
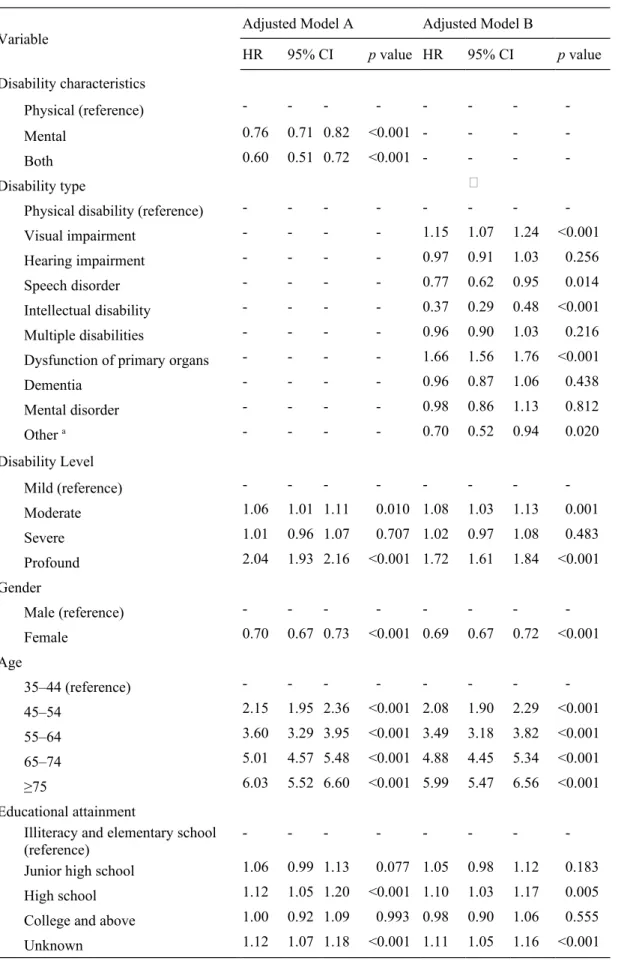
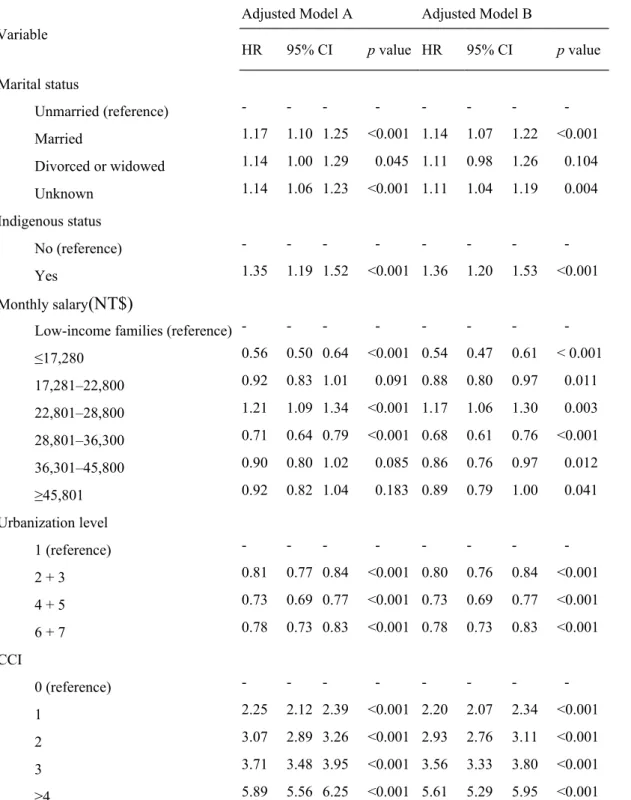
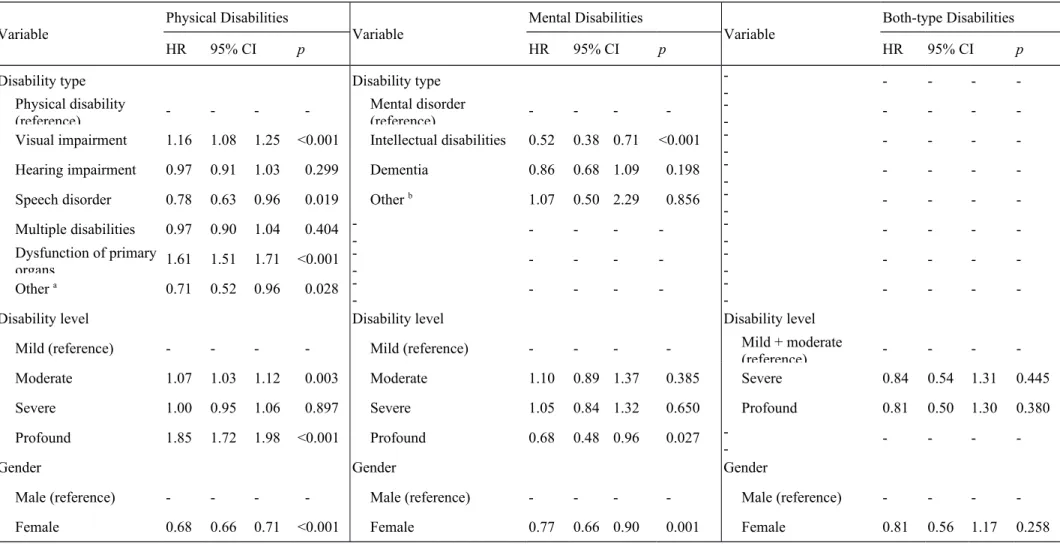
This study further adopted the Cox proportional hazards model to analyze the AMI risks and relevant factors for the three groups of people with disability (Table 3). After the variable of disabled types was controlled, the factors for the three groups were similar. However, people with higher levels of mental disabilities exhibited a lower AMI risk of 0.68 (95% CI = 0.48–0.96), whereas people with higher levels of physical disabilities exhibited a higher AMI risk of 1.85 (95% CI = 1.72–1.98). The other factors were similar to the overall risk.
4. Discussion
We found that the AMI risk was 2.48per 1000 person-yearsfor people with disability.
According to the 2010 statistics publicized by the National Health Insurance Administration in Taiwan, the overall AMI incidence rate in Taiwan was 0.80 per one thousand people in 2009, indicating that people with disability had a relatively higher AMI risk. A study conducted in the United States indicated that after the variable of age was controlled, the prevalence rates of CVD per 1000 people with cognitive limitations and people with physical disabilities were 13.0% and 19.7%, respectively, which were considerably greater than the rate (5.1%) for people without disabilities (Reichard, Stolzle, & Fox, 2011). Regarding disability characteristics, the AMI incidence rate among people with physical disabilities was the highest (2.73 per 1000 person-years), and the rate among people with mental disabilities (0.99) was relatively lower, the results of which corresponded withthose in the
aforementioned study.
Among people with physical disabilities, people with primary organ dysfunction had the
highest AMI rate (5.02 per 1000 person-years), followed by people with hearing impairment
(2.67) and people with visual impairment (2.61). People with disability cannot effectively
exercise because of restricted physical functions and the difficulties of performing daily activities, which results in metabolic abnormalities and increased weight that substantially increase the risk of chronic diseases. To improve the preventive healthcare and health among people with disability, whether the increase in the risk of chronic diseases leads to
comparatively higher AMI incidence rates is a crucial topic. Although people with mental disabilities had relatively lower AMI risks, the AMI incidence rate among people with dementia (3.68 per one thousand people)ranked second in the overall disability types. A study indicated that the prevalence of dementia increased with age: the prevalence rate for people aged 71–79 was 4.97%, whereas that for people aged 90 and above increased to 37.4%
(Plassman et al., 2007). Consequently, the high AMI incidence rate among people with dementia was correlated with age.
According to a follow-up study conducted in Korea, although the AMI incidence rate per one thousand people per year gradually decreased, older people had higher AMI incidence rates, indicating that age was a major factor for AMI incidence rates (Kim et al., 2013). Previous observational study in Taiwan found that the average age of acute
myocardial infarction occurred about 63.313.3,and male accounted for 68.3% of overall incidence(Shyu, Wu, & Mar, 2011). In our study, male or old people with disability had higher AMI risks than female or young people with disability did, which corresponded with the results of the aforementioned study.
In Models A and B, after the relevant variables were controlled, people with high school
educations had significantly higher AMI incidence rates (1.12 and 1.10, respectively) than
people who had other levels of educational attainments did. Regarding economic factors,
people with moderate incomes (NT$ 22,801–28,800) had the highest AMI risk (HR = 1.21
and 1.17, respectively), indicating that people with moderate to low socioeconomic status had
higher AMI risks than people with high socioeconomic statuses did. According to a study
conducted in Sweden, low socioeconomic status was a factor that increased overall AMI risk
(Manrique-Garcia, Sidorchuk, Hallqvist, & Moradi, 2011). Another study conducted in Sweden indicated that after various risk factors were adjusted, people with high levels of educational attainment had relatively lower AMI risks (Rosengren et al., 2009). Therefore, the educational and economic factors for AMI risk were similar between disabled and people with no disability.
According to a study conducted on Taiwanese communities, the risk of coronary artery disease for married people was 10% less than that for unmarried people (Lee et al., 2000). A study conducted in the United Kingdom indicated that after CVD risk was adjusted, women with partners and those withouthad a similar risk (relative risk = 0.99, 95% CI = 0.96-1.02) regarding the first occurrence of ischemic heart disease(Floud et al., 2014). Another study conducted in Sweden showed that the incidence rates of ischemic heart disease did not significantly vary between married and single people (Rizzuto, Orsini, Qiu, Wang, &
Fratiglioni, 2012). In a case control study conducted in China,2,902 cases were compared with a control group of 2,949 cases; after the AMI risk factors were adjusted, the AMI risk for single people was 1.51 times the risk for married people (Hu et al., 2012). Previous studies focused on regular people who were not disabled; however,people with
disabilitytypically face greater familial and economic pressure after getting married than regular people do. Consequently, whether the results of this study would differ from those presented in previous studies regarding this topicrequires further research.
Approximately 520,000 indigenous people live in Taiwan, which comprises 2% of the
total population (Council of Indigenous Peoples, 2013). This study found that after the other
variables were controlled, the AMI risk for indigenous people with disability was higher than
that for nonindigenous people with disability. A study conducted in Australia indicated that
after age, gender, and year were adjusted, the AMI incidence rate among indigenous people
was 2.3 times higher than that among nonindigenous people (Randall et al., 2014). The
indigenous people in Taiwan are facing an increasingly drinking problem, and alcohol intake
can result in abnormalities regarding nutritional conversion and metabolism (Rittmueller, Corriveau, & Sharma, 2012; Yen et al., 2008). Excessive alcohol consumption increases hyperuricemia and metabolic syndromes, and thereby increases the risk of CVD (Chuang, Lee, Hsieh, & Pan, 2011; Yeh, Chang, & Pan, 2011). Health authorities may further
investigate the health conditions of indigenous people for reducing their AMI incidence rates.
This study found that both the people living in areas with high urbanization levels and the people with relatively higher scores of comorbidity suffered significantly increasing AMI risks. Regarding urbanization levels, a study based on the National Health Interview Survey indicated that people living in areas with Level-1 urbanization had a relatively higher prevalence rate of cerebral infarction (2.49%) (Lin, Lin, Liu, Chen, & Chiu, 2007). Stroke and AMI had similar characteristics, and both are related to atherosclerosis. Consequently, we observed that high urbanization levels increase the risk of AMI.
5. Conclusion
Although the incidence of AMI has declined in developed countries each year, AMI is still an acute disease with high mortality rates. The proportion of people with disability worldwide is increasing annually. The loss of physical functions reduces mobility and increases the risk of chronic diseases, and intellectual impairment results in a lack of health knowledge. Acute diseases pose tremendous health risks to people with disability. The results of this study showed that the AMI incidence rate (per 1000person-years) among people with disability from 2002 to 2008 was 2.48. Overall, relatively higher AMI risks occurred to people with disability who were male, aged 65 and above, married, or indigenous, and those who had physical disabilities, higher comorbidity levels, orwere living in highly urbanized areas.
Because populations worldwide are aging, the number of people with congenital or
acquired disabilities increases. The prevalence of chronic diseases is relatively higher among
people with disability; however,the rate at which people with disabilityuse preventive health services is comparatively lower. Therefore, we investigated the factors related to AMI to provide useful references to help public health authorities enhance the engagement of people with disability in preventive health services.
6. Limitations
This study used retrospective secondary data, and therefore AMI-related factors such as family history, lifestyle, health behaviors, obesity, and stress levels, which were not provided by the National Health Insurance Research Database, were not included in the analysis.
Although this study contained several limitations, the amply long observation duration and large sample size still rendered the results relatively representative and valuable as references for public health discussions.
Acknowledgments
This study was supported by grants (CMU101-ASIA-14, DOH9805006A) from China
Medical University, Asia University, and the Health Promotion Administration. The
preventive healthcare files were obtained from the Health Promotion Administration,
Taiwan. We are also grateful for the use of the National Health Insurance Research Database
as provided by the Ministry of Health and Welfare, Taiwan.
References
Annual Report by the Ministry of the Interior (2013). The number of people with disabilities obtained based on disability causes.http://statis.moi.gov.tw/micst/stmain.jsp?sys=100 Armour, B. S., Thierry, J. M., & Wolf, L. A. (2009). State-level differences in breast and
cervical cancer screening by disability status: United States, 2008. Women's Health Issues, 19, 406-414.
Canto, J. G., Kiefe, C. I., Rogers, W. J., Peterson, E. D., Frederick, P. D., French, W. J., . . . Zalenski, R. J. (2011). Number of coronary heart disease risk factors and mortality in patients with first myocardial infarction. JAMA: The Journal of the American Medical Association, 306, 2120-2127.
Cheng, T.M. (2003). Taiwan’s new national health insurance program: Genesis and experience so far. Health Affairs, 22(3), 61-76.
Chuang, S.Y., Lee, S. C., Hsieh, Y.T., & Pan, W.H. (2011). Trends in hyperuricemia and gout prevalence: Nutrition and Health Survey in Taiwan from 1993-1996 to 2005-2008.
Asia Pacific Journal of Clinical Nutrition, 20(2), 301-308.
Deyo, R. A., Cherkin, D. C., & Ciol, M. A. (1992). Adapting a clinical comorbidity index for use with ICD-9-CM administrative databases. Journal of Clinical Epidemiology, 45, 613- 619.
Floud, S., Balkwill, A., Canoy, D., Wright, F. L., Reeves, G. K., Green, J., Beral,V., Cairns, B. J. and the Million Women Study Collaborators(2014). Marital status and ischemic heart disease incidence and mortality in women: A large prospective study. BMC Medicine, 12, 42.
Hu, B., Li, W., Wang, X., Liu, L., Teo, K., & Yusuf, S. (2012). Marital status, education, and risk of acute myocardial infarction in Mainland China: the INTER-HEART study. Journal of Epidemiology, 22, 123-129.
Huang, K.H., Tsai, W.C., & Kung, P.T. (2012). The use of Pap smear and its influencing
factors among women with disabilities in Taiwan. Research in Developmental Disabilities, 33, 307-314.
Kim, R. B., Kim, B.G., Kim, Y.M., Seo, J. W., Lim, Y. S., Kim, H. S., . . . Shin, J.Y. (2013).
Trends in the incidence of hospitalized acute myocardial infarction and stroke in Korea, 2006-2010. Journal of Korean Medical Science, 28, 16-24.
Klijs, B., Nusselder, W. J., Looman, C. W., & Mackenbach, J. P. (2011). Contribution of chronic disease to the burden of disability. PloS One, 6(9), e25325.
Kung, P.T., Tsai, W.C., & Chiou, S.J. (2012). The assessment of the likelihood of
mammography usage with relevant factors among women with disabilities. Research in Developmental Disabilities, 33, 136-143.
Lee, Y.T., Lin, R. S., Sung, F. C., Yang, C.Y., Chien, K.L., Chen, W.J., . . . Huang, Y.C.
(2000). Chin-Shan Community Cardiovascular Cohort in Taiwan–baseline data and five- year follow-up morbidity and mortality. Journal of Clinical Epidemiology, 53, 838-846.
Lin, H.C., Lin, Y.J., Liu, T.C., Chen, C.S., & Chiu, W.T. (2007). Urbanization and stroke prevalence in Taiwan: Analysis of a nationwide survey. Journal of Urban Health, 84, 604- 614.
Manrique-Garcia, E., Sidorchuk, A., Hallqvist, J., & Moradi, T. (2011). Socioeconomic position and incidence of acute myocardial infarction: A meta-analysis. Journal of Epidemiology and Community Health, 65, 301-309.
Ministry of the Interior. (2009). White Paper on the Right and Interest Protection for People with Disability.
Ministry of the Interior. (2013).Statistical Yearbook of Interior: 102 years 24 weeks (101 years handicapped welfare statistics). http://sowf.moi.gov.tw/stat/week/list.htm
National Health Insurance Administration, Ministry of Health and Welfare. (2010). News
release. http://www.hpa.gov.tw/BHPNet/Web/News/News.aspx?No=201009240001
National Health Insurance Administration, Ministry of Health and Welfare. (2013). 2012–
2013 Introduction of National Health Insurance.http://www.nhi.gov.tw/resource/Webdata/
22954_1_
National Heart, Lung, and Blood Institute.(2006). National Heart Attack Alert Program.
http://www.nhlbi.nih.gov/about/nhaap/nhaap_pd.htm.
North, B. J., & Sinclair, D. A. (2012). The intersection between aging and cardiovascular disease. Circulation Research, 110, 1097-1108.
Perenboom, R., Van Herten, L., Boshuizen, H., & Van Den Bos, G. (2004). Trends in disability-free life expectancy. Disability & Rehabilitation, 26, 377-386.
Plassman, B. L., Langa, K. M., Fisher, G. G., Heeringa, S. G., Weir, D. R., Ofstedal, M.
B., . . . Rodgers, W. L. (2007). Prevalence of dementia in the United States: The aging, demographics, and memory study. Neuroepidemiology, 29, 125-132.
Plichart, M., Barberger‐Gateau, P., Tzourio, C., Amouyel, P., Pérès, K., Ritchie, K., . . . Empana, J. P. (2010). Disability and incident coronary heart disease in older community‐
dwelling adults: The three‐city study. Journal of the American Geriatrics Society, 58, 636- 642.
Ramirez, A., Farmer, G. C., Grant, D., & Papachristou, T. (2005). Disability and preventive cancer screening: results from the 2001 California Health Interview Survey. Journal Information, 95, 2057-2064.
Randall, D., Jorm, L., Lujic, S., Eades, S., Churches, T., O’Loughlin, A., & Leyland, A.
(2014). Exploring disparities in acute myocardial infarction events between Aboriginal and non-Aboriginal Australians: Roles of age, gender, geography and area-level disadvantage.
Health &Place, 28, 58-66.
Reichard, A., Stolzle, H., & Fox, M. H. (2011). Health disparities among adults with physical disabilities or cognitive limitations compared to individuals with no disabilities in the United States. Disability and Health Journal, 4, 59-67.
Rittmueller, S. E., Corriveau, A., & Sharma, S. (2012). Dietary quality and adequacy among
Aboriginal alcohol consumers in the Northwest Territories, Canada. International Journal of Circumpolar Health, 71, 17341.
Rizzuto, D., Orsini, N., Qiu, C., Wang, H.X., & Fratiglioni, L. (2012). Lifestyle, social factors, and survival after age 75: Population based study. British Medical Journal, 345, e5568.
Rosengren, A., Subramanian, S., Islam, S., Chow, C. K., Avezum, A., Kazmi, K., . . . Yusuf, S. (2009). Education and risk for acute myocardial infarction in 52 high, middle and low- income countries: INTERHEART case-control study. Heart, 95, 2014-2022.
Schmidt, M., Jacobsen, J. B., Lash, T. L., Bøtker, H. E., & Sørensen, H. T. (2012). 25 year trends in first time hospitalisation for acute myocardial infarction, subsequent short and long term mortality, and the prognostic impact of sex and comorbidity: A Danish nationwide cohort study. British Medical Journal, 344, e356.
Shyu, K.G., Wu, C.J., & Mar, G.Y. (2011). Clinical characteristics, management and in- hospital outcomes of patients with acute coronary syndromed observations from the Taiwan ACS full spectrum registry. ActaCardiologicaSinica , 27, 135-144.
Steyn, K., Sliwa, K., Hawken, S., Commerford, P., Onen, C., Damasceno, A., . . . Yusuf, S.
(2005). Risk factors associated with myocardial infarction in Africa: The INTERHEART Africa study. Circulation, 112, 3554-3561.
Sun, Y., Chang, Y.H., Chen, H.F., Su, Y.H., Su, H.F., & Li, C.Y. (2012). Risk of Parkinson disease onset in patients with diabetes a 9-year population-based cohort study with age and sex stratifications. Diabetes Care, 35, 1047-1049.
Takii, T., Yasuda, S., Takahashi, J., Ito, K., Shiba, N., Shirato, K., & Shimokawa, H. (2010).
Trends in acute myocardial infarction incidence and mortality over 30 years in Japan: report from the MIYAGI-AMI Registry Study. Circulation Journal: Official Journal of the
Japanese Circulation Society, 74(1), 93-100.
Verger, P., Aulagnier, M., Souville, M., Ravaud, J.-F., Lussault, P.-Y., Garnier, J.-P., &
Paraponaris, A. (2005). Women with disabilities: general practitioners and breast cancer screening. American Journal of Preventive Medicine, 28(2), 215-220.
World Health Organization (2011).Cardiaovascular disease.http://www.who.int/cardiovascular_diseases/en/
World Health Organization (2013). Cardiovascular disease.http://www.who.int/cardiovascular_diseases/en/
Yeh, R. W., Sidney, S., Chandra, M., Sorel, M., Selby, J. V., & Go, A. S. (2010). Population trends in the incidence and outcomes of acute myocardial infarction. New England Journal of Medicine, 362, 2155-2165.
Yusuf, S., Hawken, S., Ôunpuu, S., Dans, T., Avezum, A., Lanas, F., &Varigos, J. (2004).
Effect of potentially modifiable risk factors associated with myocardial infarction in 52 countries (the INTERHEART study): Case-control study. The Lancet, 364, 937-952.
Highlights:
1. AMI incidence in people with disability was as high as 2.48 per 1000 person-years.
2. AMI risk for physical disabilities was 1.32 times that of mental disabilities.
3. AMI risk for profound disability was 2.04 times that for those with milddisability.
4. People with visual impairment or dysfunctional primary organs had higher AMI risks.
5. Male, age≧65, indigenous, physical disability, and high comorbidity had higher AMI
risk.
Table 1 The incidence rates of acute myocardial infarction among people with disability (per 1000 person-years)
Variable N AMI
Case Average observed
person-years SD Incidence rate p value
Total 798,328 12,783 6.46 3.34 2.48 -
Disability characteristics
Physical (reference) 674,564 11,922 6.47 3.38 2.73 -
Mental 113,330 730 6.50 3.06 0.99 <0.001
Both 10,434 131 5.23 3.11 2.40 0.140
Disability type
Physical disability (reference) 351,725 5,374 6.92 3.29 2.21 -
Visual impairment 43,186 804 7.13 3.04 2.61 <0.001
Hearing impairment 84,334 1,556 6.91 3.07 2.67 <0.001
Speech disorder 9,748 89 6.44 3.43 1.42 <0.001
Intellectual disability 25,464 63 8.21 2.50 0.30 <0.001
Multiple disabilities 80,718 1,319 5.32 3.54 3.07 <0.001
Dysfunction of primary organs 110,032 2,875 5.20 3.39 5.02 <0.001
Dementia 27,784 427 4.18 2.89 3.68 <0.001
Mental disorder 58,996 233 6.84 2.70 0.58 <0.001
Other
a6,341 43 6.02 2.96 1.13 <0.001
Disability level
Mild (reference) 266,457 3,867 7.00 2.97 2.07 -
Moderate 257,428 4,079 6.78 3.24 2.34 <0.001
Severe 165,800 2,248 5.84 3.59 2.32 <0.001
Profound 108,643 2,589 5.31 3.56 4.49 <0.001
Gende
r Male (reference) 458,198 7,915 6.44 3.37 2.68 -
Female 340,130 4,868 6.48 3.29 2.21 <0.001
Age
35–44 (reference) 163,991 632 7.85 2.59 0.49 -
45–54 142,848 1,497 7.48 2.97 1.40 <0.001
55–64 132,841 2,517 6.82 3.18 2.78 <0.001
65–74 157,786 3,879 6.06 3.34 4.05 <0.001
≥75 200,862 4258 4.66 3.36 4.54 <0.001
Educational attainment
Illiterate or elementary school
(reference) 420,301 7,513 6.40 3.35 2.79 -
Junior high school 102,188 1,161 7.14 3.02 1.59 <0.001
High school 98,351 1,234 6.96 3.02 1.80 <0.001
College or above 48,920 695 6.69 3.16 2.12 <0.001
Unknown 128,568 2,180 5.65 3.62 3.00 0.003
Marital status
Unmarried (reference) 110,471 1,056 6.93 3.14 1.38 -
Married 449,941 7,985 6.34 3.29 2.80 <0.001
Divorced or widowed 19,390 324 6.90 2.88 2.42 <0.001
Unknown 218,526 3,418 6.43 3.54 2.43 <0.001
Table 1 The incidence rates of acute myocardial infarction among people with disability (per 1000 person-years) (continued)
Variable N AMI
Case Average observed
person-years SD Incidence rate p value Indigenous status
No (reference) 782,552 12,501 6.44 3.34 2.48 -
Yes 15,776 282 7.28 2.93 2.46 0.872
Monthly salary (NT$)
Low-income family (reference) 37,325 437 6.72 3.37 1.74 -
≤17,280 60,497 613 7.87 3.05 1.29 <0.001
17,281–22,800 337,067 5,731 6.37 3.31 2.67 <0.001
22,801–28,800 154,345 2,740 5.45 3.51 3.26 <0.001
28,801–36,300 105,601 1,481 7.32 2.76 1.92 0.080
36,301–45,800 52,142 837 6.84 3.23 2.35 <0.001
≥45,801 51,351 944 6.04 3.39 3.04 <0.001
Urbanization level
1 (reference) 165,802 2,976 5.95 3.52 3.02 -
2 + 3 326,483 5,033 6.60 3.28 2.34 <0.001
4 + 5 190,806 2,897 6.67 3.25 2.28 <0.001
6 + 7 115,237 1,877 6.44 3.29 2.53 <0.001
CCI
0(reference) 315,556 2,211 8.06 2.53 0.87 -
1 139,938 2,331 6.76 3.09 2.47 <0.001
2 117,771 2,423 5.94 3.26 3.46 <0.001
3 82,200 1,906 5.20 3.28 4.46 <0.001
≥4 142,863 3,912 3.77 3.11 7.26 <0.001
a
Including facial impairment, autism, chromosomal abnormalities, congenital disorders, balance disorder, intractable epilepsy, and rare diseases.
b
Total average age: 61.02 ± 16.04; average age of people with disability with AMI: 67.71 ±
12.45; average age of people with disability without AMI: 60.91 ± 16.07.
Table 2 The risk and relevant factors of acute myocardial infarction among people with disability
Variable Adjusted Model A Adjusted Model B
HR 95% CI p value HR 95% CI p value
Disability characteristics
Physical (reference) - - - - - - - -
Mental 0.76 0.71 0.82 <0.001 - - - -
Both 0.60 0.51 0.72 <0.001 - - - -
Disability type �
Physical disability (reference) - - - - - - - -
Visual impairment - - - - 1.15 1.07 1.24 <0.001
Hearing impairment - - - - 0.97 0.91 1.03 0.256
Speech disorder - - - - 0.77 0.62 0.95 0.014
Intellectual disability - - - - 0.37 0.29 0.48 <0.001
Multiple disabilities - - - - 0.96 0.90 1.03 0.216
Dysfunction of primary organs - - - - 1.66 1.56 1.76 <0.001
Dementia - - - - 0.96 0.87 1.06 0.438
Mental disorder - - - - 0.98 0.86 1.13 0.812
Other
a- - - - 0.70 0.52 0.94 0.020
Disability Level
Mild (reference) - - - - - - - -
Moderate 1.06 1.01 1.11 0.010 1.08 1.03 1.13 0.001
Severe 1.01 0.96 1.07 0.707 1.02 0.97 1.08 0.483
Profound 2.04 1.93 2.16 <0.001 1.72 1.61 1.84 <0.001 Gender
Male (reference) - - - - - - - -
Female 0.70 0.67 0.73 <0.001 0.69 0.67 0.72 <0.001 Age
35–44 (reference) - - - - - - - -
45–54 2.15 1.95 2.36 <0.001 2.08 1.90 2.29 <0.001 55–64 3.60 3.29 3.95 <0.001 3.49 3.18 3.82 <0.001 65–74 5.01 4.57 5.48 <0.001 4.88 4.45 5.34 <0.001
≥75 6.03 5.52 6.60 <0.001 5.99 5.47 6.56 <0.001 Educational attainment
Illiteracy and elementary school
(reference) - - - - - - - -
Junior high school 1.06 0.99 1.13 0.077 1.05 0.98 1.12 0.183
High school 1.12 1.05 1.20 <0.001 1.10 1.03 1.17 0.005
College and above 1.00 0.92 1.09 0.993 0.98 0.90 1.06 0.555
Unknown 1.12 1.07 1.18 <0.001 1.11 1.05 1.16 <0.001
Table 2 The risk and relevant factors of acute myocardial infarction among people with disability(continued)
Variable
Adjusted Model A Adjusted Model B
HR 95% CI p value HR 95% CI p value
Marital status
Unmarried (reference) - - - - - - - -
Married 1.17 1.10 1.25 <0.001 1.14 1.07 1.22 <0.001 Divorced or widowed 1.14 1.00 1.29 0.045 1.11 0.98 1.26 0.104 Unknown 1.14 1.06 1.23 <0.001 1.11 1.04 1.19 0.004 Indigenous status
No (reference) - - - - - - - -
Yes 1.35 1.19 1.52 <0.001 1.36 1.20 1.53 <0.001 Monthly salary (NT$)
Low-income families (reference) - - - - - - - -
≤17,280 0.56 0.50 0.64 <0.001 0.54 0.47 0.61 < 0.001 17,281–22,800 0.92 0.83 1.01 0.091 0.88 0.80 0.97 0.011 22,801–28,800 1.21 1.09 1.34 <0.001 1.17 1.06 1.30 0.003 28,801–36,300 0.71 0.64 0.79 <0.001 0.68 0.61 0.76 <0.001 36,301–45,800 0.90 0.80 1.02 0.085 0.86 0.76 0.97 0.012
≥45,801 0.92 0.82 1.04 0.183 0.89 0.79 1.00 0.041
Urbanization level
1 (reference) - - - - - - - -
2 + 3 0.81 0.77 0.84 <0.001 0.80 0.76 0.84 <0.001 4 + 5 0.73 0.69 0.77 <0.001 0.73 0.69 0.77 <0.001 6 + 7 0.78 0.73 0.83 <0.001 0.78 0.73 0.83 <0.001 CCI
0 (reference) - - - - - - - -
1 2.25 2.12 2.39 <0.001 2.20 2.07 2.34 <0.001 2 3.07 2.89 3.26 <0.001 2.93 2.76 3.11 <0.001 3 3.71 3.48 3.95 <0.001 3.56 3.33 3.80 <0.001
≥4 5.89 5.56 6.25 <0.001 5.61 5.29 5.95 <0.001
a
Including facial impairment, autism, chromosomal abnormalities, congenital disorders,
balance disorder, intractable epilepsy, and rare diseases.
Table 3 The risks and relevant factors of AMI among people with physical, mental, or both-type disabilities
Variable Physical Disabilities
Variable Mental Disabilities
Variable Both-type Disabilities
HR 95% CI p HR 95% CI p HR 95% CI p
Disability type Disability type -
- - - - -
Physical disability
(reference) - - - - Mental disorder
(reference) - - - - -
- - - - -
Visual impairment 1.16 1.08 1.25 <0.001 Intellectual disabilities 0.52 0.38 0.71 <0.001 -
- - - - -
Hearing impairment 0.97 0.91 1.03 0.299 Dementia 0.86 0.68 1.09 0.198 -
- - - - -
Speech disorder 0.78 0.63 0.96 0.019 Other
b1.07 0.50 2.29 0.856 -
- - - - -
Multiple disabilities 0.97 0.90 1.04 0.404 -
- - - - - -
- - - - -
Dysfunction of primary
organs 1.61 1.51 1.71 <0.001 -
- - - - - -
- - - - -
Other
a0.71 0.52 0.96 0.028 -
- - - - - -
- - - - -
Disability level Disability level Disability level
Mild (reference) - - - - Mild (reference) - - - - Mild + moderate
(reference) - - - -
Moderate 1.07 1.03 1.12 0.003 Moderate 1.10 0.89 1.37 0.385 Severe 0.84 0.54 1.31 0.445
Severe 1.00 0.95 1.06 0.897 Severe 1.05 0.84 1.32 0.650 Profound 0.81 0.50 1.30 0.380
Profound 1.85 1.72 1.98 <0.001 Profound 0.68 0.48 0.96 0.027 -
- - - - -
Gender Gender Gender
Male (reference) - - - - Male (reference) - - - - Male (reference) - - - -
Female 0.68 0.66 0.71 <0.001 Female 0.77 0.66 0.90 0.001 Female 0.81 0.56 1.17 0.258
Table 3 The risks and relevant factors of AMI among people with physical, mental, or both-type disabilities (continued)
Variable Physical Disabilities
Variable Mental Disabilities Variable Both-type Disabilities
HR 95% CI p HR 95% CI p HR 95% CI p
Age Age Age
35–44 (reference) - - - - 35–44 (reference) - - - - 35–54 (reference) - - - -
45–54 1.99 1.80 2.19 <0.001 45–54 3.15 2.21 4.49 <0.001 55–64 4.22 1.85 9.63 0.001
55–64 3.32 3.02 3.66 <0.001 55–64 5.55 3.84 8.02 <0.001 65–74 4.55 2.02 10.24 <0.001
65–74 4.68 4.26 5.14 <0.001 65–74 8.20 5.60 12.01 <0.001 ≥75 4.90 2.23 10.76 <0.001
≥75 5.70 5.19 6.26 <0.001 ≥75 13.46 9.14 19.81 <0.001 -
- - - - -
Education attainment Education attainment Education attainment
Illiteracy and elementary
School (reference) - - - - Illiteracy and elementary
School (reference) - - - -
Illiteracy and elementary
School - - - -
Junior high school 1.05 0.98 1.12 0.172 Junior high school 0.99 0.75 1.33 0.969 Junior high school 0.63 0.25 1.58 0.321 High school 1.09 1.02 1.16 0.014 High school 1.14 0.87 1.48 0.347 High school 1.41 0.75 2.66 0.290 College and above 0.96 0.89 1.05 0.399 College and above 1.14 0.83 1.58 0.425 College and above 0.56 0.17 1.80 0.327
Unknown 1.10 1.05 1.16 <0.001 Unknown 1.15 0.93 1.42 0.202 Unknown 1.33 0.84 2.11 0.227
Marital status Marital status Marital status
Unmarried (reference) - - - - Unmarried (reference) - - - - Unmarried
(reference) - - - -
Married 1.12 1.04 1.20 0.002 Married 1.38 1.07 1.78 0.014 Married 1.34 0.68 2.63 0.400
Divorced or widowed 1.06 0.93 1.21 0.409 Divorced or widowed 1.71 1.10 2.66 0.016 Divorced or
widowed 1.72 0.62 4.78 0.301
Unknown 1.09 1.02 1.18 0.017 Unknown 1.24 0.94 1.62 0.128 Unknown 1.45 0.70 3.00 0.315
Indigenous status Indigenous status Indigenous status
No (reference) - - - - No (reference) - - - - No (reference) - - - -
Yes 1.34 1.18 1.52 <0.001 Yes 1.66 0.91 3.04 0.101 Yes 2.22 0.69 7.15 0.181
Table 3 The risks and relevant factors of AMI among people with physical, mental, or both-type disabilities (continued)
Variable Physical Disabilities
Variable Mental Disabilities
Variable Both-type Disabilities
HR 95% CI p HR 95% CI p HR 95% CI p
Monthly salary (NT$) Monthly salary (NT$) Monthly salary (NT$)
Low-income family
(reference) - - - - Low-income family
(reference) - - - - Low-income family
(reference) - - - -
≤17,280 0.53 0.46 0.60 <0.001 ≤17,280 0.68 0.45 1.02 0.062 ≤17,280 1.02 0.34 3.06 0.976
17,281–22,800 0.88 0.79 0.99 0.026 17,281–22,800 0.79 0.60 1.05 0.098 17,281–22,800 0.93 0.42 2.03 0.845 22,801–28,800 1.18 1.06 1.32 0.004 22,801–28,800 0.99 0.74 1.33 0.938 22,801–28,800 1.29 0.57 2.92 0.545 28,801–36,300 0.69 0.61 0.78 <0.001 28,801–36,300 0.58 0.42 0.81 0.001 28,801–36,300 0.82 0.34 1.96 0.654 36,301–45,800 0.86 0.76 0.98 0.022 36,301–45,800 0.75 0.49 1.17 0.204 36,301–45,800 1.05 0.36 3.05 0.924
≥45,801 0.90 0.79 1.02 0.100 ≥45,801 0.69 0.47 1.02 0.063 ≥45,801 0.60 0.21 1.74 0.343
Urbanization level Urbanization level
Urbanization level Urbanization level
1 (reference) - - - - 1 (reference) - - - - 1 (reference) - - - -
2 + 3 0.80 0.76 0.84 <0.001 2 + 3 0.83 0.68 1.01 0.059 2 + 3 0.81 0.49 1.32 0.393
4 + 5 0.73 0.69 0.77 <0.001 4 + 5 0.73 0.58 0.93 0.009 4 + 5 0.74 0.42 1.30 0.294
6 + 7 0.78 0.73 0.84 <0.001 6 + 7 0.77 0.59 1.00 0.053 6 + 7 0.81 0.42 1.57 0.536
CCI CCI CCI
0 (reference) - - - - 0 (reference) - - - - 0 (reference) - - - -
1 2.19 2.06 2.33 <0.001 1 2.30 1.82 2.89 <0.001 1 1.91 0.90 4.05 0.091
2 2.95 2.77 3.14 <0.001 2 2.71 2.10 3.48 <0.001 2 2.21 1.05 4.65 0.036
3 3.57 3.34 3.82 <0.001 3 3.40 2.59 4.48 <0.001 3 3.33 1.61 6.86 0.001
≥4
≥4 5.70 5.36 6.06 <0.001 ≥4 4.62 3.57 5.98 <0.001 ≥4 4.02 2.02 7.98 <0.001
a
Including facial impairment, balance disorder, intractable epilepsy, and rare diseases
b