國立臺灣大學理學院大氣科學研究所 碩士論文
Department of Atmospheric Sciences College of Science
National Taiwan University Master Thesis
北極層狀雲逆相位之形成機制
Mechanism of Phase Inversion in Arctic Stratiform Clouds
劉佩欣 Pei-Hsin Liu
指導教授:陳正平 博士 Advisor: Jen-Ping Chen, Ph.D.
中華民國 109 年 8 月 August, 2020
誌謝
感謝陳正平老師的指導,教會了我許多雲微物理的知識,並提點了我很多新的 想法,讓我能完成這篇論文。感謝董希泉老師提供了這個題目的構想和觀測資料的 資源,讓我能找到這個題目做下去。感謝林宜萩學姐提供我模式和研究上的協助,
解決了很多我研究上遇到的問題。感謝隋中興老師、吳健銘老師、陳維婷老師和蘇 世顥老師等口試委員給了我很多寶貴的建議。感謝曾敏端學長提供我 cloud tracking 的程式。感謝 Lea 解答了我很多研究所生涯上的疑惑,一起討論黃阿瑪真的很開 心。感謝揚揚常常跟我討論,幫助我釐清很多事情。感謝雲與氣膠研究室的成員對 我的勉勵和幫助,常常提供有用的資訊和食物給我。感謝 B03 的大家,能這樣繼 續聯繫著感情真的非常難能可貴。感謝我的父母,支持我的選擇,讓我能讀到碩士。
最後,感謝這一路上所有幫助過我的人!
中文摘要
北極層狀雲通常有逆相位的結構(即雲頂為液態、下方為混合態或冰態的結
構),並且可以持續很長的時間。先前的研究認為逆相位結構是由冰晶的重力沉降
和持續在高空生成液態雲的結果,而浸入核化被認為是北極層狀雲中最主要的冰 晶核化過程。然而,冰核的作用以及其和不同環境因素之間的非線性過程對此逆相 位現象的的影響尚未得到充分的了解。冰晶核化過程受到溫度、飽和度、冰核的種 類和數量濃度影響。在雲的上層中,有任何不利於這些因子的條件都會使冰晶核化 速率減小,從而能夠保持逆相位的結構。
本研究利用 WRF 模式搭配詳盡的冰晶核化方案,試圖找出北極層狀雲中逆相 位結構的微物理機制。該冰晶核化方案可以預報不同種類冰核在三個相態間的轉 換,並考慮了不同的冰晶核化途徑以及隨著降水粒子的沉降。本研究模擬的個案在 2008 年 3 月 4 日到 3 月 5 日期間於阿拉斯加州巴羅鎮的 ARM 計畫中所觀測到。
沙塵和煤灰為兩個主要測試的冰核種類,並利用 MERRA-2 中的氣溶膠再分析資 料來提供模式的初始和邊界條件。模式結果顯示此個案的雲主要是因為鋒面上升 運動而產生。沙塵和煤灰都成功模擬出逆相位結構,但在煤灰的實驗中,沒有任何 水雲到達巴羅,顯示在這個個案中沙塵可能是主要的冰核。在雲中,沙塵主要透過 異質凝華核化產生冰晶,而非如前人研究中所認為的浸入核化。但是因為冰晶核化 速率很低,且重力沉降移除了沙塵,使生成的冰晶數量相對較少,而導致華格納- 白吉隆-芬代生過程十分緩慢,從而可以讓雲水藉由舉升絕熱冷卻持續形成。此外,
一旦沙塵進入雲滴中,冰核就只能透過浸入核化產生冰晶,但在這模擬的個案條件 中,此核化過程效率較低。在本研究中,北極層狀雲的逆相位結構機制是由於冰核 數量有限,且部分陷入較不易核化的水雲中,以及通過重力沉降移除的沙塵所導致 的。
關鍵字:北極層狀雲、北極混合態雲、逆相位、冰晶核化、古典冰晶理論、沙塵捕 獲
ABSTRACT
Arctic stratiform clouds (ASC) often exhibit a phase inversion structure (i.e., liquid top and mixed- or ice-phase below), and can persist for quite a long time. Previous studies indicated that the phase inversion structure is the result of persistent liquid cloud generation aloft, and gravitational sedimentation of ice precipitation that formed dominantly by immersion freezing; however, the role of ice nuclei (IN) and nonlinear effect of different environmental factors on phase inversion was not fully addressed before. Ice nucleation processes are affected by temperature, saturation, and the species and number concentration of IN. Unfavorable conditions in any of these factors at the upper part of the cloud can minimize the ice nucleation rate there and thus maintain the phase inversion.
This study aims to find out the microphysics mechanism for ASC phase inversion by using the Weather Research and Forecasting (WRF) model coupled with a detailed ice nucleation scheme. This ice nucleation scheme considers prognostic IN species, their conversion between different phases, and different routes of ice nucleation and the sedimentation with precipitation particles. The 2008 Mar 04-05 case observed with an Atmospheric Radiation Measurement (ARM) facility at Barrow, Alaska, is simulated.
Dust and soot are considered as the two main IN, using the Modern-Era Retrospective analysis for Research and Applications, Version 2 (MERRA-2) aerosol reanalysis data for providing initial and boundary conditions. The simulation result reveals that clouds formed because of the upward motion associated with a frontal system. Simulations with either dust or soot particles can both reproduce the phase inversion structure, but no liquid cloud can arrive Barrow in the soot run, inferring that dust may be the dominant IN in
this case. In the cloud, ice particles nucleated from dust mainly through deposition nucleation rather than immersion as suggested in earlier studies. However, due to low ice nucleation rate and gravitational removal, the amount of ice particles that produced is relatively low, which yielded a slow Wegener–Bergeron–Findeisen conversion to allow the sustentation of cloud water during adiabatic cooling; this results in a persistent liquid cloud aloft. Furthermore, once dust particles get into the cloud drops, ice nucleation can only proceed via immersion freezing, which is rather inefficient comparing to deposition nucleation under the simulated conditions. The limited amount of dust together with the trap of dust in an inefficient nucleation phase and the nucleation scavenging of dust by falling ice precipitation serve as the main mechanism of ASC phase inversion in this study.
Keywords: Arctic stratiform clouds, Arctic mixed-phase clouds, phase inversion, ice nucleation, classical nucleation theory, dust trap
CONTENTS
誌謝 ... i
中文摘要 ... ii
ABSTRACT ... iii
CONTENTS ... v
LIST OF TABLES ... vii
LIST OF FIGURES ... viii
Chapter 1 Introduction ... 1
Chapter 2 Data and Methodology ... 5
2.1 Observation ... 5
2.2 Model ... 5
2.2.1 Model settings ... 5
2.2.2 Aerosol settings ... 6
2.2.3 Experiment design ... 8
2.3 Case overview ... 9
2.4 Analysis method ... 9
Chapter 3 Results ... 11
3.1 Ice nucleation with dust or soot ... 11
3.2 Comparison with ARM observations ... 12
Chapter 4 Phase inversion mechanism investigation ... 15
4.1 Soot ... 15
4.2 Dust ... 16
4.2.1 Ice nucleation process ... 17
.4.2.1.1 Deposition nucleation versus immersion freezing ... 17
.4.2.1.2 Immersion due to activation or collection ... 18
4.2.2 The WBF efficiency and liquid persistence ... 20
.4.2.2.1 WBF characteristic time ... 20
.4.2.2.2 Sensitivity of dust number concentration ... 22
Chapter 5 Discussion and Conclusion ... 24
REFERENCE ... 28
TABLES ... 34
FIGURES ... 37
LIST OF TABLES
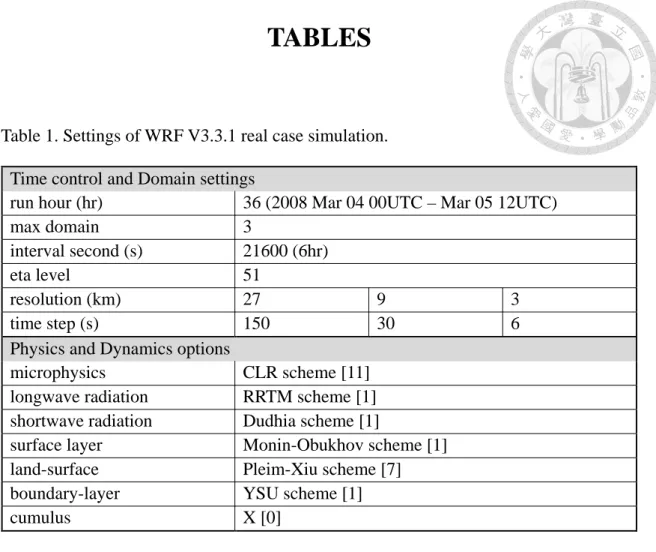
Table 1. Settings of WRF V3.3.1 real case simulation. ... 34
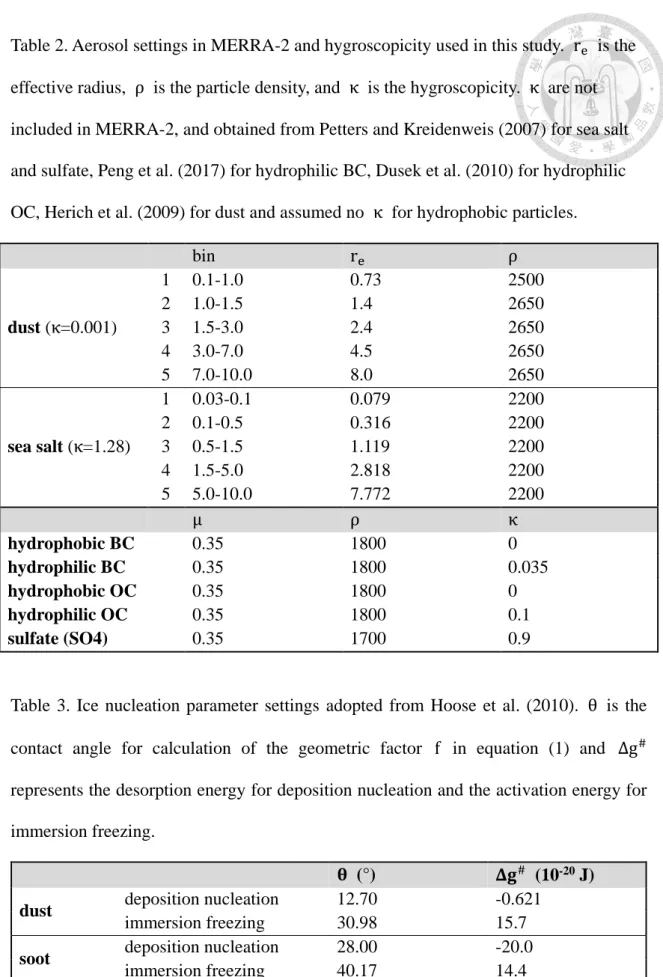
Table 2. Aerosol settings in MERRA-2 and hygroscopicity used in this study. ... 35
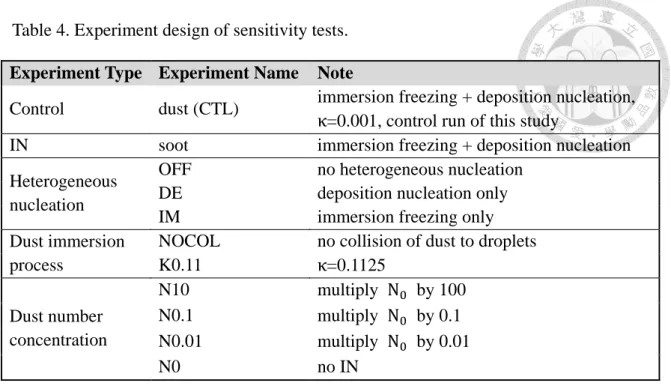
Table 3. Ice nucleation parameter settings adopted from Hoose et al. (2010). ... 35
Table 4. Experiment design of sensitivity tests. ... 36
LIST OF FIGURES
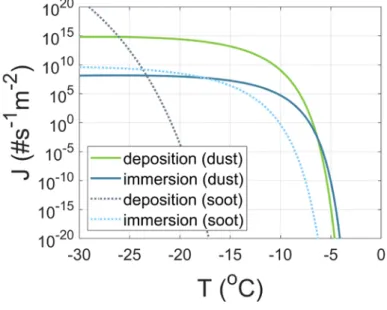
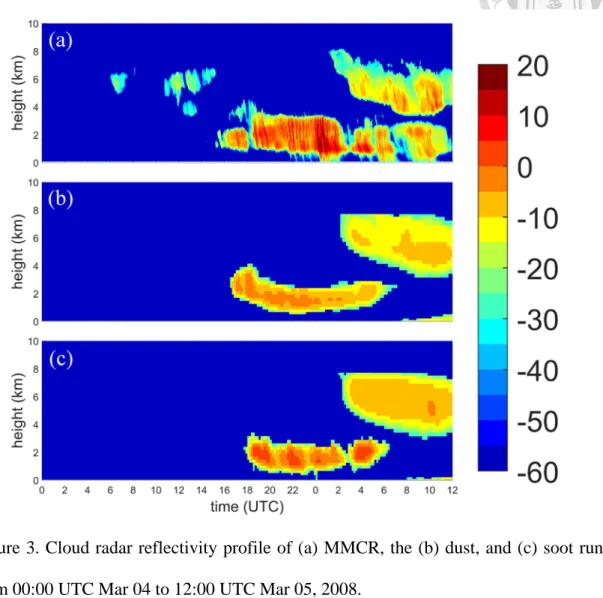
Figure 1. Ice nucleation rate for dust and soot from classical nucleation theory without considering embryo size. ... 37 Figure 2. The fitted MERRA-2 dust lognormal size distributions. ... 37 Figure 3. Cloud radar reflectivity profile of (a) MMCR, the (b) dust, and (c) soot runs from 00:00 UTC Mar 04 to 12:00 UTC Mar 05, 2008. ... 38 Figure 4. Time series of depolarization ratio (shading) observed by MPL at Barrow
adopted from Qiu et al. (2015). ... 38 Figure 5. Temperature profile at Barrow from ARM (purple line) and WRF in the dust run (orange line) at 12:00 UTC on Mar 04, 2008. ... 39 Figure 6. Specific humidity profile at Barrow from ARM (purple line) and WRF in the dust run (orange line) at 12:00 UTC on Mar 04, 2008. ... 39 Figure 7. MODIS image on Mar 04, 2008. ... 40 Figure 8. Domain setting for the model simulations. ... 40 Figure 9. Distributions of (a) potential temperature at 850 hPa, and (b) height at 500 hPa in domain 1 in the dust run. ... 41 Figure 10. Time series of horizontal distributions of ice (shading) and cloud liquid content (contour: 0.0001~0.01 g m-3) in domain 3 at 800 hPa on Mar 04, 2008 in the dust run. ... 42 Figure 11. Time series of horizontal distributions of ice (shading) and cloud liquid content (contour: 0.0001~0.01 g m-3) in domain 3 at 800 hPa on Mar 04, 2008 in the soot run. ... 42 Figure 12. (a) NE-SW and (b) NW-SE cross-sections of ice (shading), cloud liquid content
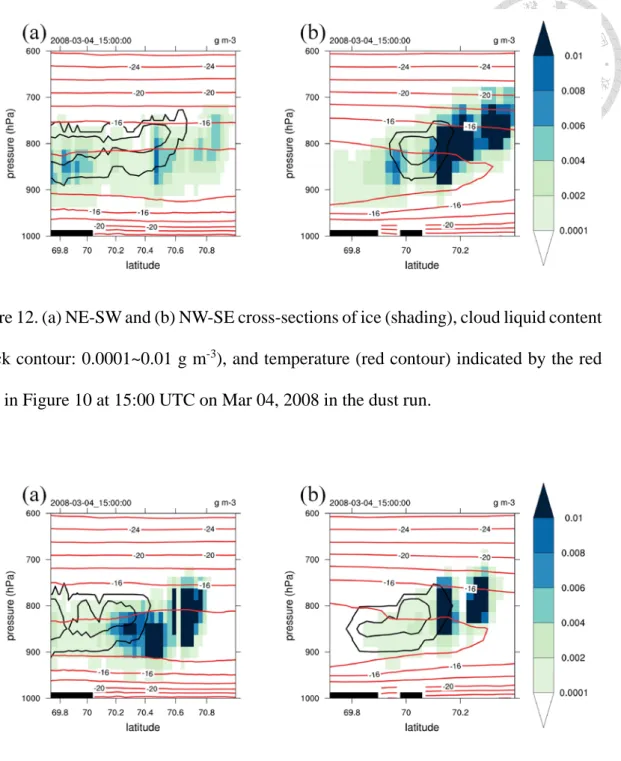
(black contour: 0.0001~0.01 g m-3), and temperature (red contour) indicated by the red lines in Figure 10 at 15:00 UTC on Mar 04, 2008 in the dust run.
... 43 Figure 13. (a) NE-SW and (b) NW-SE cross-sections of ice (shading), cloud liquid content (black contour: 0.0001~0.01 g m-3), and temperature (red contour) indicated by the red lines in Figure 11 at 15:00 UTC on Mar 04, 2008 in the soot run.
... 43 Figure 14. Distributions of wind at 850 hPa in the (a) dust and (b) soot runs, and (c) difference of the soot run from the dust run in domain 1 at 12:00 UTC on Mar 04, 2008. ... 44 Figure 15. Time series of average (a) IWP and (b) LWP in domain 3 of the dust and soot runs during 12:00-17:30 UTC on Mar 04, 2008. ... 45 Figure 16. Number concentration of IN in ice (shading) and cloud liquid content (contour:
0.0001~0.01 g m-3) at the NE-SW cross-section indicated by the long red line in Figure 10 at 15:00 UTC on Mar 04, 2008 for the (a) dust and (b) soot runs.
... 45 Figure 17. Time series of average IN in ice in domain 3 of the (a) dust and (b) soot runs during 12:00-18:00 UTC on Mar 04, 2008. Black contour represents 10-8 g m-3 of liquid. ... 46 Figure 18. Time series of LWP and TWP. ARM observed LWP at Barrow. ... 46 Figure 19. Time series of liquid (a) mass mixing ratio fraction and (b) scattering area ratio averaged within 5x5 grids area centered at Barrow of the dust run. ... 47 Figure 20. Time series of liquid (a) mass mixing ratio fraction and (b) scattering area ratio averaged within 5x5 grids area centered at Barrow of the soot run. ... 47 Figure 21. Horizontal distributions of ice in (a) and (b), and ice number concentration in
(c) and (d) in domain 3. (a) and (c) are for the dust run, and (b) and (d) are for the soot run. ... 48 Figure 22. Horizontal distributions of ice (shading) and cloud liquid content (contour:
0.0001~0.01 g m-3) in domain 3 of the (a) OFF, (b) DE, and (c) IM runs at 800 hPa at 15:00 UTC on Mar 04, 2008. ... 49 Figure 23. Ice (shading) and cloud liquid content (contour: 0.0001~0.01 g m-3) at the NE-
SW cross-section indicated by the long red line in Figure 10 at 15:00 UTC on Mar 04, 2008 for the (a) OFF, (b) DE, and (c) IM runs. ... 50 Figure 24. Time series of average (a) IWP and (b) LWP in domain 3 of heterogeneous process sensitivity tests during 12:00-17:30 UTC on Mar 04, 2008. ... 50 Figure 25. Number concentration of IN in liquid (shading) and cloud liquid content
(contour: 0.0001~0.01 g m-3) at the NE-SW cross-section indicated by the long red line in Figure 10 at 15:00 UTC on Mar 04, 2008 for the (a) CTL, (b) DE, and (c) IM runs. ... 51 Figure 26. Time series of average the number concentration of IN in liquid in domain 3 of the (a) CTL, (b) DE, and (c) IM runs during 12:00-18:00 UTC on Mar 04, 2008. ... 52 Figure 27. Critical saturation for the deliquescence activation of κ equaling to 0.001 (orange line) and 0.1125 (green line), and the adsorption activation of dust (blue line) at -15⁰C. ... 53 Figure 28. Number concentration of IN and cloud liquid content (contour: 0.0001~0.01 g m-3) in liquid (shading) at the NE-SW cross-section indicated by the long red line in Figure 10 at 15:00 UTC on Mar 04, 2008 for the (a) CTL, (b) NOCOL, and (c) K0.11 runs. ... 54
of the (a) CTL, (b) NOCOL, and (c) K0.11 runs during 12:00-18:00 UTC on Mar 04, 2008. ... 55 Figure 30. Time series of average (a) IWP and (b) LWP in domain 3 of dust immersion process sensitivity tests during 12:00-17:30 UTC on Mar 04, 2008. ... 55 Figure 31. Horizontal distribution of vertical velocity (shading) and cloud liquid content (contour: 0.0001~0.01 g m-3) at 800 hPa in the CTL run. ... 56 Figure 32. Cloud liquid content (contour: 0.0001~0.01 g m-3) and (a) WBF characteristic time τ and (b) ice number concentration (shading) at the NE-SW cross- section indicated by the long red line in Figure 10 at 15:00 UTC on Mar 04, 2008 in the CTL run... 56 Figure 33. Probability of WBF characteristic time τ in the CTL run during 12:00-17:30 UTC on Mar 04, 2008. ... 57 Figure 34. Horizontal distributions of ice (shading) and cloud liquid content (contour:
0.0001~0.01 g m-3) in domain 3 of the (a) N10, (b) CTL, (c) N0.1, and (d) N0.01 runs at 800 hPa at 15:00 UTC on Mar 04, 2008. ... 57 Figure 35. Ice (shading) and cloud liquid content (contour: 0.0001~0.01 g m-3) at the NE-
SW cross-section indicated by the long red line in Figure 10 at 15:00 UTC on Mar 04, 2008 for the (a) N10, (b) CTL, (c) N0.1, and (d) N0.01 runs. ... 58 Figure 36. Time series of average (a) IWP and (b) LWP in domain 3 of dust number concentration sensitivity tests during 12:00-17:30 UTC on Mar 04, 2008. . 59 Figure 37. WBF characteristic time τ (shading) and cloud liquid content (contour:
0.0001~0.01 g m-3) at the NE-SW cross-section indicated by the long red line in Figure 10 at 15:00 UTC on Mar 04, 2008 for the (a) N10, (b) CTL, (c) N0.1, and (d) N0.01 runs. ... 59 Figure 38. Ice number concentration (shading) and cloud liquid content (contour:
0.0001~0.01 g m-3) at the NE-SW cross-section indicated by the long red line in Figure 10 at 15:00 UTC on Mar 04, 2008 for the (a) N10, (b) CTL, (c) N0.1, and (d) N0.01 runs. ... 60 Figure 39. Probability of WBF characteristic time τ in the (a) N10, (b) CTL, (c) N0.1, and (d) N0.01 runs during 12:00-17:30 UTC on Mar 04, 2008. ... 61 Figure 40. Time series of liquid (a) mass mixing ratio fraction and (b) scattering area ratio averaged within 5x5 grids area centered at Barrow of the N0.1 run. ... 62 Figure 41. Time series of liquid (a) mass mixing ratio fraction and (b) scattering area ratio averaged within 5x5 grids area centered at Barrow of the N0.01 run. ... 62 Figure 42. Schematic diagram of the proposed phase inversion mechanism. ... 63 Figure 43. Back trajectories of the edges (hollow circle) of domain 1 starting from Mar 04, 2008 with initial height as (a) 1000m, (b) 2000m, and (c) 3000m. ... 63
Chapter 1 Introduction
The Arctic region, where clouds have a great impact on the radiation budget, is sensitive to climate change (Curry et al. 1996). In the Arctic, liquid-containing clouds have stronger longwave surface radiative forcing than ice clouds (Shupe and Intrieri 2004). Arctic stratiform cloud (ASC), a kind of liquid-containing clouds in the Arctic, often exhibited liquid top and mixed- or ice-phase below, which is called the phase inversion (Shupe et al. 2008), and occurred 42.3% of the time annually (Qiu et al. 2015) with relatively long lifetime more than 12 hours (Shupe et al. 2006). Therefore, ASC and their phase inversion structure are important to surface radiation budget in the Arctic and should be well understood to improve simulations of climate change.
The phase inversion structure in ASC, often coincident with temperature and specific humidity inversions within or above cloud (Qiu et al. 2015; Sedlar et al. 2012), is suggested a result of persistent liquid layer generation aloft and gravitational ice precipitation below (Morrison et al. 2012). Firstly, supercooled liquid cloud layer forms and ice nucleates within the cloud afterward (de Boer et al. 2011). After nucleation, ice particles grow via the Wegener–Bergeron–Findeisen (WBF) process and precipitate out by gravity, forming an ice-dominant cloud layer below the liquid-dominant cloud layer.
The depletion of liquid by the WBF process is compensated by the production due to updrafts of radiative-cooling-induced turbulence mixing (Morrison et al. 2012), or entrainment of water vapor from moist inversion above the cloud (Solomon et al. 2011).
Consequently, the magnitude of the WBF process plays a key role in the maintenance of the liquid layer. Hence, ice number concentration, affecting the WBF process, is critical to phase inversion in ASC.
Ice nucleation itself may also lead to phase inversion in ASC if the environment is not suitable for the liquid layer to nucleate ice. Ice nucleation in ASC is dominated by heterogeneous nucleation process because ASC are found to be most common in the ‐25 to ‐10⁰C environment, which is much higher than the temperature for significant homogeneous freezing rate (de Boer et al. 2011). Heterogeneous nucleation process requires ice nuclei (IN) to assist nucleation, including four ways: deposition nucleation, immersion freezing, condensation freezing, and contact freezing. Deposition nucleation is the direct deposition of water vapor on IN; immersion freezing is the freezing of water droplets with immersed IN; condensation freezing is the process of condensation of water vapor on IN quickly followed by freezing of the condensed water; contact freezing is the nucleation occurring at the site of the collision between IN and water droplets. Among all kinds of heterogeneous processes, immersion freezing is thought to be the main process in ASC (de Boer et al. 2010; Prenni et al. 2009), which meets the observation of first liquid formation (de Boer et al. 2011). However, the true role of different heterogeneous processes is not well understood yet because of the poor knowledge of IN species and the usage of empirical parameterizations in the model.
Empirical parameterizations mostly do not account for IN species and often relate ice nucleation to a single environmental factor simply regardless of the actual variation of IN. For example, immersion freezing is often parameterized as a function of temperature only (Bigg 1953; Diehl and Wurzler 2004), while deposition nucleation is often associated with supersaturation only (Meyers et al. 1992; Prenni et al. 2007).
Moreover, the ice nucleation rate is often calculated by the difference between the number concentration of IN and that of existing ice particles (de Boer et al. 2010; Morrison et al.
2009) regardless of possible removal by precipitation scavenging. These methods lack
Paukert and Hoose (2014) fixed these problems by using a more complex ice nucleation parameterization by considering temperature, saturation and IN species to simulate ASC, but they accounted for immersion freezing only. As immersion freezing and deposition nucleation of dust, and immersion freezing and contact freezing of soot are dominant in the Arctic (Hoose et al. 2010), the role of IN combining with nonlinear effect between different environmental factors on different ice nucleation processes in ASC was not fully investigated before. Ice nucleation processes are affected by temperature, saturation, and IN species and number concentration. Unfavorable conditions in any of these factors can cause a lower ice nucleation rate in the liquid layer and thus maintain the phase inversion structure in ASC, and these factors can be investigated only when a prognostic treatment of IN and the classical nucleation theory are considered at the same time.
The classical nucleation for heterogeneous nucleation derived in Chen et al. (2008) accounts for deposition nucleation and immersion freezing, while condensation freezing and contact freezing may be linked to immersion freezing if the preceding process (i.e, condensation and contact) can be accounted for. The nucleation rate can be expressed as
J = A’ ∙ rN2∙ √f ∙ exp(−ΔgkT#−Δgg), ( 1 ) where k is the Boltzmann constant, T is the temperature, A’ depends on ambient parameters, rN is the radius of IN, f is a geometric factor to account for the curvatures of the IN and ice germ, Δg# represents the desorption energy for deposition nucleation and the activation energy for immersion freezing, and Δgg is the germ formation energy.
The curvature of the ice germ is associated with the contact angle θ . The effects of curvature and solute on freezing is considered by including the water activity term in Δgg. This formula, which would be used in this study, can calculate different nucleation processes for different IN species in a simple way and can discover the roles of aerosol
and ice nucleation in phase inversion.
This study aims to further clarify the mechanism of phase inversion and find out the actual role of specific IN species and the associated ice nucleation process in ASC by model simulation. We seek to advance our knowledge of ASC and the role of aerosol particles in such systems.
Chapter 2 Data and Methodology
This study is based on real-case sensitivity simulations using the Weather Research and Forecasting (WRF) model with a detailed bulk microphysics scheme. The model results are verified with the observational data from the Atmospheric Radiation Measurement (ARM) program.
2.1 Observation
The observational data are obtained from the ARM program (https://adc.arm.gov/discovery/#/) of the North Slope Alaska (NSA) facility at Barrow,
Alaska (71.323°N, 156.609°W). The sounding data are used to determine the vertical profile of the atmosphere. The cloud radar reflectivity data are from the millimeter- wavelength cloud radar (MMCR), with a frequency of 35 GHz and a resolution of 10 seconds. The liquid water path (LWP) data are retrieved from the microwave radiometer (MWR) with two frequencies of 23.8 and 31.4 GHz. The depolarization ratio are from the micropulse lidar (MPL) with a wavelength of 523 nm. The reflectivity, LWP, and depolarization ratio data are used for the comparison with the model results.
2.2 Model
2.2.1 Model settings
This study applies the WRF model version 3.3.1 coupled with the Cheng et al. (2010) cloud microphysics scheme to simulate ASC. The Cheng et al. (2010) scheme is coupled with a detailed aerosol-cloud interaction scheme of Lin (2015), which considers the
classical nucleation theory (Chen et al. 2008; Hoose et al. 2010) and the conversion of IN between different phases with prognostic IN information. The aerosol activation scheme is calculated from the κ-Köhler equation (Petters and Kreidenweis 2007), which is based on the Köhler theory (Chen 1994; Pruppacher and Klett 1980). No cumulus parameterization is used in either domain to prevent ice formation other than from the ice nucleation scheme. Details of the model settings and the physical options used in this study are shown in Table 1, and the domain settings are described in §2.3. The meteorological reanalysis datasets are from the National Centers for Environmental Prediction (NCEP) final (FNL) Operational Global Analysis data with a resolution of 1°
by 1° and 27 vertical levels, and updates every 6 hours.
2.2.2 Aerosol settings
The boundary and initial conditions of aerosols are taken from the Modern-Era Retrospective analysis for Research and Applications, Version 2 (MERRA-2). MERRA- 2 provides mixing ratios for five aerosol species, including dust, black carbon (BC), organic carbon (OC), sulfate, and sea salt (Table 2), with spatial resolutions of 0.625° by 0.5° and 72 vertical (eta) levels (Bosilovich et al. 2015). The size distributions of aerosols are described with lognormal distributions in the simulation, where the kth moment, Mk, of the distribution can be calculated as
Mk= N0 ∙ μk∙ exp(k22ln2σ), ( 2 ) where N0 is the number concentration of IN, and μ and σ are the two parameters describing the distribution.
The main IN considered in this study are dust and soot. The IN-dependent parameters θ and Δg# in equation (1) are adopted from Hoose et al. (2010) and listed
in Table 3. Offline calculation of ice nucleation rate shows that both deposition nucleation and immersion freezing are significant for dust, while roughly only immersion freezing is significant for soot above -25°C (Figure 1). For dust, 5 size bins are provided in MERRA-2. To convert them to a lognormal distribution, the smallest bin is first fitted to represent the accumulation mode (cf. Whitby (1978)), and the remaining bins are fitted to represent the coarse mode (Figure 2). The parameters μ and σ used in the lognormal distributions are determined by the least root mean square error of the 5 bins, and N0 of the dust is calculated afterward. For soot, two bins of BC (one is hydrophilic and the other is hydrophobic) with μ as 0.35 μm are provided in MERRA-2, and they are fitted to accumulation mode only. Given σ as 1.6 (Konovalov et al. 2018), N0 of soot can be derived. The other aerosol species are all soluble and serve as condensation nuclei (CN) in the model. Their size distributions are described by lognormal distributions with the accumulation mode composed of internally mixed sulfate and OC and the coarse mode composed of sea salt. For the accumulation mode, σ is given as 2 (Whitby 1978), N0 is based on the number concentration of sulfate, and μ is then solved from equation (2).
For coarse mode, sea salt is provided with 5 size bins in MERRA-2, and its μ and σ are fitted by the least root mean square error of the 5 bins with N0 derived afterward.
The hygroscopicity factor κ (Petters and Kreidenweis 2007) that is required for calculating the Köhler-curve activation is assumed to be independent of size. For dust, the pure mineral dust κ is assumed to be 0.001 according to Herich et al. (2009), while the polluted dust κ is derived from the mixed composition of pure dust and sulfate with a result of 0.1125. For soot, κ is derived from the mixture of the hydrophilic and the hydrophobic BC with a result of 0.0326. For CN, the accumulation mode κ is determined from the composition of sulfate and OC with a result of 0.8, while the coarse mode κ is assumed to be 1.28 according to Petters and Kreidenweis (2007). Details of
the κ used in this study are listed in Table 2.
2.2.3 Experiment design
As dust is thought to be the dominant IN (Hoose et al. 2010), the simulation with dust is considered as the control run (CTL) in this study and sensitivity tests are designed as listed in Table 4 to investigate the roles of IN and ice nucleation on forming phase inversion in ASC. The IN experiment compares soot with dust to find out the main nucleating and phase-inversion-forming IN in ASC. Two other experiments are designed to find out the role of the ice nucleation process. One is the heterogeneous nucleation process experiment that tries to find out the main nucleation process by turning off ice nucleation processes: deposition nucleation only (DE), immersion freezing only (IM), and no heterogeneous process (OFF). The other is the dust immersion process experiment that tries to find out whether activation or collection is dominant for dust particles to get into droplets that modulates the numbers of dust particles to nucleate via immersion freezing and deposition nucleation. Two tests are compared with CTL: one turns off the collision between dust and droplets (NOCOL) and the other raises the κ of dust from 0.001 to 0.1125 (K0.11). Besides ice nucleation, liquid persistence is also important to phase inversion and is affected by the WBF process, which is affected by the number of nucleated ice particles. Thus, the dust number concentration experiment is designed by multiplying the number of dust particles in CTL by 10 (N10), 0.1 (N0.1), 0.01 (N0.01), and 0 (N0) to explore the effect of the strength of the WBF process on the liquid persistence and phase inversion. From these sensitivity tests, the microphysics mechanism of phase inversion in ASC can be discovered.
2.3 Case overview
The selected case was observed during 2008 Mar 04-05 at Barrow (Qiu et al. 2015).
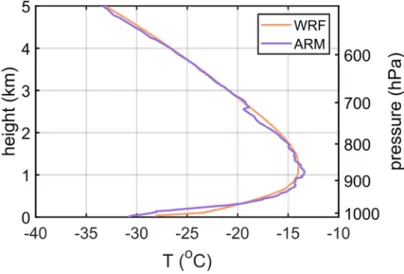
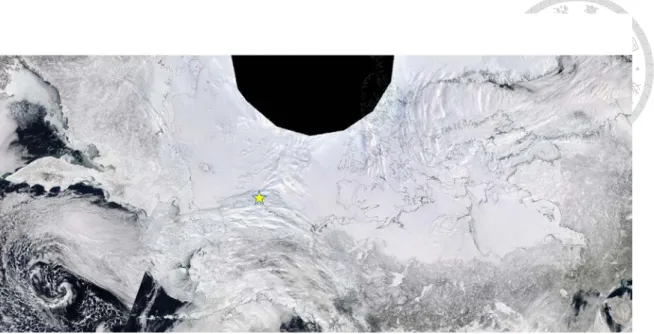
The cloud radar reflectivity data display that a low-level cloud persisted from Mar 04 to Mar 05, with a high-level cloud covering this cloud during the later period of Mar 05 (Figure 3a). The depolarization ratio data show that the low-level cloud is a phase- inverted ASC, while the high cloud is not the topic of this study because of the lack of phase inversion (Figure 4). The sounding data reveal strong temperature and specific humidity inversions below the cloud (Figure 5 & Figure 6), which is somewhat uncommon for ASC (Qiu et al. 2015). The sounding data from FNL at Barrow show temperature profiles similar to the observation, except that the water vapor content is much lower and the moisture inversion is weaker than the observation (Figure 6). From the Moderate Resolution Imaging Spectroradiometer (MODIS) image (https://wvs.earthdata.nasa.gov/), a large area of front-liked stratiform clouds was located around Barrow (Figure 7).
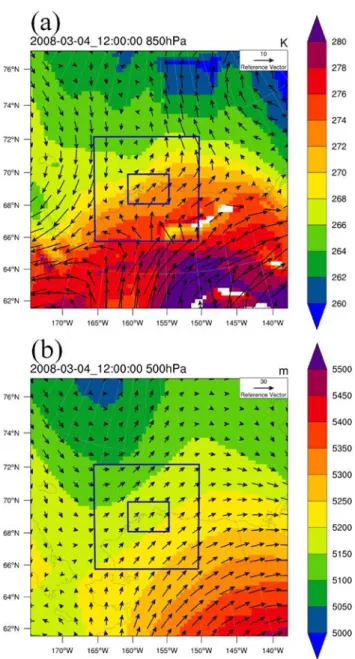
Three nested domains with horizontal resolutions of 27km, 9km, and 3km respectively, and 51 eta levels are designed for the simulation as shown in Figure 8, and the simulation runs from Mar 04 00UTC to Mar 05 12UTC (Table 1). The synoptic pattern according to the FNL data indicates that a front existed in domain 3 with a large potential temperature gradient and confluence flow located at 850 hPa and a trough to the west at 500 hPa (Figure 9). This is a suitable environment for updrafts and cloud formation.
2.4 Analysis method
The simulated clouds and their precipitation particles in domain 3 are defined with the threshold of total hydrometers mixing ratio larger than 10-7 kg kg-1. With the cloud
boundary defined by the above threshold, the observed high cloud can be easily excluded because it is not connected to the lower ASC. The following analyses will focus on the lower ASC in domain 3 to better clarify the mechanism of phase inversion.
Chapter 3 Results
In this chapter, whether dust or soot serves as the main IN in ASC and phase inversion is investigated by using different IN in the model (Table 4). The model results of dust and soot are discussed first, then the model simulations are verified by comparing them with the observation at Barrow.
3.1 Ice nucleation with dust or soot
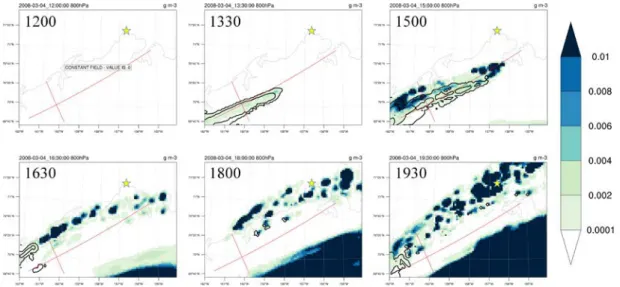
The distributions of the simulated clouds in domain 3 with dust or soot as IN are shown in Figure 10 and Figure 11. Both runs produced significant amounts of ice in the clouds that are moving northward in domain 3. The cloud located at the southeast appeared later with no liquid layer; this is the northern part of the high-level cloud that appeared at Barrow on Mar 05. The other one that spanned from the southwest to the northeast contains a liquid layer at the southern part of the cloud. Figure 12 and Figure 13 show the vertical profiles of this cloud. One can see that the cloud is vertically tilted in the southeast-northwest direction, and the phase inversion structure is visible with a liquid-dominant layer at the top and ice-dominant layer below in both runs.
The ASC in the dust and soot runs shows significant differences in both location and the phase partition. The location and the generation time of the ASC are different in the two runs (Figure 10 versus Figure 11 & Figure 12 versus Figure 13) not only because different IN are used but also because the domain-1 weather is not fixed and may be influenced by the microphysics (Figure 14). The time-series of ice and liquid water paths averaged over the whole ASC also show differences in not only the amount but also the timing: ice forms before liquid in the dust run and the opposite is true in the soot run
(Figure 15), inferring that dust particles nucleate mainly by deposition nucleation (more discussion in §.4.2.1.1) and soot particles nucleate by immersion freezing. Figure 16 shows that more soot particles are nucleated than dust, especially of the northern part of the cloud. Even though soot particles are less effective IN (cf. Figure 1), they make up the overall nucleation by the vast numbers (cf. Figure 16 & Figure 17).
In conclusion, dust and soot both produce the ASC successfully with some differences in the cloud between the two IN runs, and these results are verified by observation in the next section.
3.2 Comparison with ARM observations
To verify the model simulation, the model results of the dust and soot runs are compared with the observational data by averaging results within 5x5 grids (15x15 km2) that centered at Barrow to accommodate the position error commonly seen in model simulations. Cloud radar reflectivity profiles determine cloud boundaries and are shown in Figure 3. Both the dust and soot runs successfully reproduced the low-level and high clouds as observed by MMCR, although the low-level cloud appears 1 hour later in the dust run and 3 hours later in the soot run, and disappeared earlier during Mar 05 in both two IN runs. The values of cloud radar reflectivity are the smallest in the dust run, while the soot run has larger values similar to MMCR. Figure 18 compares the LWP profiles from simulations and observation. Note that it is uncertain whether MWR detects liquid only or receive signals from cloud ice also; therefore, both LWP and total water path (TWP) are calculated. The simulated LWP from either the dust or soot run is much weaker than that from MWR, while TWP better captures the trend in MWR. In the dust run, both the values of LWP and TWP are much less than MWR. In the soot run, TWP is larger and
matches MWR better, but no significant LWP is simulated. The problem of the low LWP produced in the simulation likely is mainly due to the dryer moisture profile in the model initialization data as indicated in Figure 6. The model’s initialized specific humidity is short by about 50% to 200% in the cloud layer at 1-2 km altitudes. In this regard, the better agreement in cloud radar reflectivity in the soot run could be right for the wrong reason.
The phase inversion structure is identified mainly by the depolarization ratio from the MPL observation as shown in Figure 4 (Qiu et al. 2015), and the signal of which is sensitive to the shape and scattering cross-section area. However, the microphysics scheme used here does not provide ice-particle shape information to calculate the true ice cross-section area for comparing with the observation directly. The simulated vertical structure of phase partition may be revealed most directly by looking at the mass mixing ratio fraction of liquid to that of total hydrometeors, or, to approximate closer to the lidar observation signals, simply by looking at the ratio of cross-section area by liquid droplets to that of total hydrometeors assuming that all aspherical shape signals are from ice particles. As shown in Figure 19, the indication of a liquid layer in the dust run (high liquid mass fraction and droplet cross-section area ratio) persists from Mar 04 20:00 UTC to Mar 05 02:00 UTC near the top of the ice-dominant cloud deck. The simulated liquid layer is within the ice cloud that differs from the observation, but note that the specific humidity is less than the observation in the model (Figure 6) and there may be a signal- saturation problem in lidar (Morrison et al. 2012; Shupe et al. 2006) that whether a deeper layer of liquid or ice cloud presents above the observed thin liquid layer is unknown.
From the point of view of observation, as the simulated ice-dominant cloud layer base is still below the liquid one, the phase inversion structure is reproduced in the dust run. By contrast, no liquid arrives at Barrow in the soot run (Figure 20) because too much ice is
produced by soot in the north that blocks the generation of liquid there (Figure 21), which is totally different from the observation. In general, the dust run simulates the phase inversion structure and catches the patterns as observed at Barrow better than the soot run.
Chapter 4 Phase inversion mechanism investigation
In this chapter, the role of IN in ASC phase inversion is discussed.
4.1 Soot
Despite the large number of soot particles, the observed cloud system does not have so much ice as simulated and thus enabling the phase inversion structure to form. This discrepancy indicates some potential problem may exist in the model’s soot nucleation mechanism. Firstly, the number concentration retrieved from MERRA-2 may be overestimated. Randles et al. (2016) compared MERRA-2 data with the aircraft campaign from the National Oceanic and Atmospheric Administration (NOAA) High-performance Instrumented Airborne Platform for Environmental Research Pole-Observations of Carbon Cycle and Greenhouse Gases Study (HIPPO) and found that MERRA-2 generally overestimated the mass of BC by about 300% to 400%. This mass overestimation would lead to an overestimation in soot number concentration when calculating from equation (2), but the order of overestimation might not explain the model discrepancy. Secondly, the activation of soot to form cloud drops (which can freeze later) may be overestimated because of the relatively large κ value that used. Aging of BC from hydrophobic to hydrophilic is assumed to be fixed with an e-folding timescale of 2.5 days in MERRA-2 (Randles et al. 2016). However, the timescale of aging changes seasonally. In winter, most of the BC aging timescale is 1-2 weeks, while the timescale shortens to 1-3 days in summer (Liu et al. 2011). Consequently, MERRA-2 overestimates the amount of hydrophilic BC in the studied time and leads to a larger κ, which would result in a greater number of soot particles in droplets that more ice can be nucleated by immersion freezing.
Nevertheless, our sensitivity tests (cf. §.4.2.1.2) indicated that the main pathway for dust and soot particles to enter cloud drops is Brownian collision, so error in activation might not be so important. Thirdly, the immersion freezing rate may be uncertain. Hoose et al.
(2010) retrieved the contact angle and the activation energy of soot immersion freezing from the experiment conducted by DeMott (1990). The soot particles were produced in an acetylene burner and then flowed into a cloud chamber which cannot account for the aging of soot. As the aging of soot affects the hydrophilicity and then affects the nucleation ability of soot particles (Brooks et al. 2014; Lupi and Molinero 2014), the IN- dependent parameters used in this study may not be representative of the soot particles in this case. Because of the problems discussed above, the role of soot will not be analyzed in more detail in this study.
4.2 Dust
The role of dust will be discussed in this section. As Barrow is at the downstream of the cloud movement (see §3.1), when the cloud has already developed for a few hours, the situation may become too complicated to clarify the mechanism of phase inversion.
Therefore, the following analyses focus on the early formation time of the cloud, from 12:00 UTC to 17:30 UTC on Mar 04, to get a more complete picture of the ASC. Two crucial parts of the phase inversion structure, ice nucleation process and liquid persistence, are investigated by comparing the dust run (CTL) with different sensitivity tests listed in Table 4. Although the microphysics differences in different sensitivity tests may lead to different cloud results, the frontal synoptic environment dominates the cloud formation, persistence, and dissipation that the cloud dynamics can be seen as a secondary effect and the role of cloud microphysics can be clarified.
4.2.1 Ice nucleation process
Ice nucleation is one of the key factors in ASC phase inversion. By turning off all heterogeneous nucleation processes (OFF in Table 4), no ice is nucleated (Figure 22a, Figure 23a, & Figure 24a), inferring that heterogeneous nucleation processes are crucial to ice formation. Deposition nucleation and immersion freezing are the two more well- known heterogeneous nucleation processes for dust particles to nucleate, and their roles in ice nucleation are discussed in this section.
.4.2.1.1 Deposition nucleation versus immersion freezing
To know how ice particles are nucleated in ASC, sensitivity tests of the ice nucleation process by remaining either deposition nucleation (DE) or immersion freezing (IM) are designed (Table 4).
From the offline calculation of the nucleation rate (Figure 1), the deposition nucleation rate is larger than the immersion freezing rate by about 5-7 orders at the temperature range (-14 ~ -26°C) of consideration. From the liquid and ice distributions pattern in the clouds (Figure 22b,c & Figure 23b,c), DE and IM both have a significant area of liquid and ice presence, but the latter has a larger liquid area, less ice, and has no ice out of the liquid layer above 900 hPa. From the time series of average ice water path (IWP) and LWP in domain 3 (Figure 24), DE is very similar to CTL, while IM has much less IWP and more LWP. All these indicate that deposition nucleation is the main ice nucleation process in this case, implying that no liquid formation is needed before ice formation. Such results are different from previous studies (de Boer et al. 2010; Prenni et al. 2009) that emphasized the role of immersion freezing in ASC.
Different from deposition nucleation, immersion freezing requires liquid to form first, which can be seen in Figure 24 that the value of LWP rises earlier than that of IWP in IM. Although immersion freezing is weaker in this case, IM still produces a small amount of ice (Figure 22c, Figure 23c, & Figure 24a). However, LWP and IWP in DE are nearly the same as those in CTL (Figure 22b, Figure 23b, & Figure 24b), suggesting that immersion freezing is not effective when deposition nucleation is working. The immersion nucleation is limited not only due to its low nucleation rate but also because deposition nucleation was initiated earlier and thus consumed a large portion of dust particles with a fewer amount left for immersing into droplets (Figure 25a & Figure 26a).
In contrast, IM has more dust particles available for immersion in droplets (Figure 25c &
Figure 26c), although the number of ice nucleated is still less than DE. Also, the earlier liquid formation and the longer liquid lifetime in IM comparing with DE and CTL (Figure 24b & c) indicate that the early ice formation by deposition nucleation in DE and CTL delays the liquid formation and shortens the liquid cloud’s lifetime. Both ice growth and immersion freezing compete for liquid. Consequently, when deposition nucleation nucleates ice in advance, the liquid formation would be harder and later, and the liquid layer lifetime would be shorter because more liquid is consumed by the ice WBF growth in advance. As a result, deposition nucleation has a crucial influence on the liquid cloud formation and persistence, as well as the phase inversion structure. Thus, how many dust particles are in the air plays a key role by engaging in deposition nucleation in this case.
.4.2.1.2 Immersion due to activation or collection
How dust particles get into liquid influences not only the rate of immersion freezing but also the amount of remaining in the air. In our microphysical scheme, dust can get
activation process requires that the dust particles have a certain degree of hygroscopicity κ (based on the Köhler theory) or can acquire water by surface adsorption (Sorjamaa and Laaksonen 2007). To know how dust particles go into droplets primarily and how this affects ice nucleation subsequently, sensitivity tests of dust immersion process by turning off the collision between dust and droplets (NOCOL), and raising κ of dust from 0.001 to 0.1125 (K0.11) are conducted (Table 4). The higher κ represents a condition of
“polluted” dust (dust mixed internally with soluble material). The adsorption activation process tends to be relatively weak for dust lager than about 2 μm in radius (roughly the size for efficient ice nucleation) as judged from its higher Köhler-curve critical supersaturation comparing to that for κ = 0.001 above this size (Figure 27); therefore, this mechanism is ignored in this study.
First, we want to know whether collision or activation is the dominant process. From the profiles of dust in cloud liquid (Figure 28) and the time series of average dust in liquid in domain 3 (Figure 29), NOCOL has the least dust in liquid, while K0.11 has the same order of dust in liquid as CTL, implying that collision is dominant in dust immersion process and κ has little effect on the number of activated particles.
Next, the effect of dust in liquid on ice nucleation is investigated. From the time series of average IWP in domain 3 (Figure 30a), IWP is similar to CTL in both NOCOL and K0.11, which indicates that the amount of dust in liquid has only little effect on ice nucleation and implies two things. First, immersion freezing is too small to create significant ice nucleation difference although CTL and K0.11 have more dust in liquid than NOCOL about 2 orders. Second, the effect of immersed dust on ice nucleation takes time to evolve since immersion freezing can happen only after the formation of cloud drops, which then take time to collide with dust. Nevertheless, deposition nucleation has already happened earlier and decreased the available dust for immersion, together with
the small immersion freezing rate, leading to a rather small effect of the dust immersion process on ice nucleation.
4.2.2 The WBF efficiency and liquid persistence
Sustaining liquid is the other key part of phase inversion in ASC. After the first ice nucleation (see §.4.2.1.1), the depositional growth of ice would occur, which would consume water vapor and hinder the generation of the liquid layer afterward. Fortunately, the environment is suitable for updrafts (Figure 31) and helps to form liquid afterward (see §2.3) and the amount of dust to serve as IN is not very high. After liquid formation, the WBF growth of ice would consume liquid. Therefore, the strength of the WBF process affects the persistence of liquid, which would be discussed in this section.
.4.2.2.1 WBF characteristic time
The intensity of the WBF process can be evaluated by the WBF characteristic time τ that contained in the following equation (Morrison and Gettelman 2008):
dqi
dt = ∫ Crni(Si− 1)dr =qvΓ−qsi
pτ , ( 3 )
where dqi
dt is the depositional growth rate of ice, C is an environment parameter associated with heat conductance and vapor diffusivity, r is the radius of ice particles, ni is the number concentration of ice particles, Si is the ice saturation ratio, qv is the in-cloud water vapor mixing ratio, qsi is the ice-saturation mixing ratio, and Γp is a correction accounting for the drop surface heating due to latent heat release (Morrison and Gettelman 2008). This formula means that the depositional growth of ice is proportional to the water vapor difference between the in-cloud environment and that
τ is inversely
proportional to the summation of r and ni, which is the first moment of ice. The shorter the τ is, the faster the cloud liquid evaporates to supply water vapor for ice growth, which represents a stronger ice WBF growth.
In CTL, the profiles of τ (Figure 32a) and ice number concentration (Figure 32b) show two things. One is that τ is more or less layered in the cloud deck, being mostly longer than 1 day at the upper levels and shorter than 1 day below. As the drop size does not differ much, the longer τ tends to be associated with a lower number of ice particles.
Indeed, the results show more ice in the lower levels and revealed the phase inversion structure. The other is that the mixed-phase layer has rather long τ (generally longer than 6 hours, also can be seen in Figure 33), mainly because relatively few ice particles (around 500 m-3) are present in this area. In the mixed-phase layer, IN in ice can be removed by gravitational sedimentation (with fall speed about 30 cm s-1 in Figure 17a) to maintain low number concentrations of dust and ice, which leads to a weak WBF process. Such removal of IN is generally not considered in the empirical nucleation approach but is explicitly treated in this study. Thus, τ at the upper part of the cloud is longer than the lifetime of liquid (about 3.5 hours as indicated in Figure 15b), which means that the ice WBF growth will not use up all the liquid. The persistent droplets have time to capture more dust particles by Brownian diffusion and gravitational collection, and further weakens the nucleation ability of dust due to the lower immersion freezing rate and the loss of effective dust in the air. Also, lower number concentration means lower competition, such that ice can grow larger and settle faster gravitationally. All these help to sustain the liquid layer. In summary, the low concentration of ice particles in the mixed- phase layer results in a weak WBF process and assists the persistence of liquid in CTL.
Therefore, the number of dust particles is crucial to liquid persistence by regulating the number of nucleated ice particles.
.4.2.2.2 Sensitivity of dust number concentration
To know how dust number concentration N0 affects the liquid persistence and the phase inversion structure, sensitivity tests of changing dust number concentration are designed. Figure 34 and Figure 35 show that when N0 is increased by 10 times (N10), there is essentially no liquid left and the cloud is all ice phase. When N0 is reduced by 10 times (N0.1), the amount of ice significantly reduces while that of liquid becomes ampler as reflected in the time series of average IWP and LWP in domain 3 (Figure 36).
When N0 is further reduced by 100 times compared to CTL (N0.01), ice still can be nucleated but the amount is too low such that the cloud condensates are mostly water (Figure 34d, Figure 35d, & Figure 36).
N0 influences the amount of nucleated ice. From the profiles of the ice number concentration (Figure 38), ice particles can be more than 1000 m-3 in the N10 run, while reduces to about 50 to 250 m-3 in N0.1. As discussed in §.4.2.2.1, the number of nucleated ice particles strongly affects the WBF process and liquid persistence. From Figure 37, one can see that τ is mainly shorter than 6 hours in N10, while longer than 1 day in N0.1 and N0.01. Figure 39 shows that the predominant value of τ becomes larger as N0
reduces, being 1 to 3 hours in N10 and more than 1 day in N0.1. The characteristic time of 1 hour in N10 is much shorter than the liquid-cloud lifetime such that the liquid is hard to maintain under the strong WBF process; whereas of 1 day in N0.1 and N0.01 is much longer than the lifetime of the cloud so that the liquid can persist and maintain the phase inversion structure under sustained frontal vertical lifting.
Figure 40 and Figure 41 show the liquid mass fraction and cross-section area ratio profiles averaged within 5x5 grids centered at Barrow for N0.1 and N0.01 runs. One can
see that the liquid-dominant layer becomes thicker when N0 is reduced. Too few dust particles result in a nearly all liquid cloud such that phase inversion can hardly be observed. Therefore, N0 affects the amount of ice and liquid and changes the phase inversion structure. If the environment has too many or too few dust particles, the phase inversion structure cannot be found. Only with just about the right amount of dust can phase inversion be formed.
Chapter 5 Discussion and Conclusion
This study simulates the ASC during 2008 Mar 04-05 using the WRF model with prognostic IN and detailed ice nucleation scheme. According to the model results, we propose a microphysics mechanism for phase inversion in ASC (Figure 42). In a deposition-nucleation-preferred environment, ice distribution is not only affected by temperature and humidity but also by dust number concentration. In the mixed-phase layer, ice gravitational sedimentation removes dust particles and maintains a low ice number concentration, leading to a weak WBF process. Cloud droplets thus persist for a long time, and their capturing dust particles by collision can prevent dust from nucleating efficiently by deposition nucleation. As a result, ASC has a self-regulating microphysical cycle to create a vertical inversion in effective IN which helps to maintain the phase inversion structure.
Deposition nucleation, rather than immersion freezing as suggested by previous studies (de Boer et al. 2011; Prenni et al. 2009), is the main nucleation process in this case. Furthermore, de Boer et al. (2011) indicated that the ASC formed with liquid appearing first and then following by ice, which is a prerequisite for immersion freezing.
Yet, our simulations show that ice clouds appeared first, which can occur only with effective deposition nucleation. These discrepancies imply three issues.
Firstly, because of the limitation of the single point observation, whether liquid first formed locally or was formed later but advected into the observation site from other places is not sure. Secondly, the environments of different cases may favor different nucleation processes to lead to different conclusions. If immersion freezing is dominant (when cloud temperature is somewhat higher than that of the present case (cf. Figure 1) or when WBF is too strong so that the in-cloud water vapor becomes significantly lower
than water saturation), the process of freezing itself can reduce the liquid in addition to the WBF process; therefore, a persistent liquid supplement from cloud dynamics is still required to maintain phase inversion. If the environment favors deposition nucleation, the trap of dust in cloud droplets tends to reduce the chance of ice formation and thus can maintain phase inversion by itself. The role of cloud droplets is different in these two situations, even though both involved the presence of dust in liquid.
Thirdly, deposition nucleation may be overestimated in the assumption of externally mixed dust. Whether dust particles are internally or externally mixed in MERRA-2 is unknown, and we assumed them to be externally mixed in the CTL run. Dust particles in the Arctic are mainly from the Sahara desert or eastern China (Breider et al. 2014; Tanaka and Chiba 2006) and may be coated with soluble components during the long transportation from the source to the Arctic. In the case studied in Tsai et al. (2015), 80%
in mass and 40% in number of dust particles from the Loess Plateau and Gobi Deserts are polluted during the three-day transportation from the pollution source towards the Pacific Ocean. In this studied case, according to a backward trajectory analysis (Figure 43), dust particles are likely transported to domain 1 from the dessert source in eastern China a week before Mar 04, which provides enough time for them to be internally mixed. If dust particles are dirty and internally mixed, they will have larger κ and size, the number of CN will be reduced, and the ability of deposition nucleation will further be weakened as the solute component absorbs water and forms a solution coating on dust. Such internally mixed dust particles become more efficient CN but ineffective IN, and they can immerse into droplets more easily by activation. The larger κ is tested in K0.11; however, K0.11 may not be representative of the internally mixed dust situation because the change in κ is not associated with a change in the size of dust and the number of CN in this sensitivity test. Furthermore, it is assumed that deposition nucleation is not affected by the large κ.
Therefore, the effect of internally mixed dust on ASC and phase inversion requires further research.
Apart from the chemical components of dust, other uncertainties exist in the model.
One uncertainty is from the reanalysis meteorology field from FNL. The water vapor in FNL is much less than what the in situ observation shows (Figure 6), and this may lead to an underprediction of LWP and the thickness and persistence of the liquid-dominant layer, resulting in a less significant phase inversion structure in the results. Another uncertainty is that ice particle shape variation is not considered in the model. The assumption of spherical ice particles may cause not only an underestimation of ice growth by vapor deposition (Chen and Tsai 2016) but may also underestimate the radar reflectivity (Okamoto et al. 2010). Other uncertainties may come from the lack of some microphysics processes in the model, including adsorption activation of dust or soot into cloud drops or drop freezing by contacting with IN. The adsorption can increase the probability for the largely insoluble dust to become CN without too much supersaturation (Figure 27), which in effect decreases available IN and prevents such dust particles to nucleate by deposition nucleation. Classical contact freezing needs a high number concentration of IN more than 400 cm-3 to be efficient (Cotton and Field 2002); therefore, not including this process seems to be acceptable. However, Fan et al. (2009) suggested that droplet evaporation may enhance freezing through contact freezing inside out, which could be important to ice nucleation in ASC. Not including this process may underestimate the amount of ice in the water-undersaturated environment, which could happen under strong WBF conditions. Nevertheless, the contact nucleation process is highly uncertain due to a lack of laboratory studies. These details may be worthy of future investigation.
initial and boundary conditions for dust. The aerosol data in MERRA-2 is assimilated by observation data from satellites that provide aerosol optical depth only, and the vertical structure is retrieved from the Goddard Earth Observing System version 5 (GEOS-5) that may be uncertain without the correction from observation (Randles et al. 2016). In this study, the aerosol vertical structure may be critical to ASC glaciation and the phase inversion structure. The number concentration of dust particles must be within an order of magnitude above or below those provided by MERRA-2 to produce the phase inversion structure. This may be an indication that the MERRA-2 dust data are of good quality and suitable for simulating other ASC cases.
Since the chance to observe phase inversion in ASC is slightly less than 50% (Qiu et al. 2015), one may wonder if such a probability is associated with the variation of IN species and concentration in the Arctic. When the atmosphere is lack of dust, which seems to be likely in the Arctic region due to its far distance from the major deserts, the role of soot might be more important due to the closer vicinity to the major source of black carbon emission from Russia (Breider et al. 2014). IN species seems to play an important role in ASC, and not including realistic IN species cannot ensure the correctness of model results. Lastly, this study based on one single case to conclude the importance of dust in the ASC phase inversion. Future work may extend the model simulation to other cases that have different synoptic weather patterns for further confirmation of our proposed mechanism.
REFERENCE
Bigg, E. K., 1953: The supercooling of water. Proceedings of the Physical Society. Section B, 66, 688.
Bosilovich, M., R. Lucchesi, and M. Suarez, 2015: MERRA-2: File specification.
Breider, T. J., L. J. Mickley, D. J. Jacob, Q. Wang, J. A. Fisher, R. Y. W. Chang, and B.
Alexander, 2014: Annual distributions and sources of Arctic aerosol components, aerosol optical depth, and aerosol absorption. Journal of Geophysical Research:
Atmospheres, 119, 4107-4124.
Brooks, S. D., K. Suter, and L. Olivarez, 2014: Effects of chemical aging on the ice nucleation activity of soot and polycyclic aromatic hydrocarbon aerosols. The Journal of Physical Chemistry A, 118, 10036-10047.
Chen, J.-P., 1994: Theory of deliquescence and modified Köhler curves. Journal of the atmospheric sciences, 51, 3505-3516.
Chen, J.-P., and T.-C. Tsai, 2016: Triple-moment modal parameterization for the adaptive growth habit of pristine ice crystals. Journal of the Atmospheric Sciences, 73, 2105- 2122.
Chen, J.-P., A. Hazra, and Z. Levin, 2008: Parameterizing ice nucleation rates using contact angle and activation energy derived from laboratory data. Atmospheric Chemistry and Physics, 8, 7431-7449.
Cheng, C.-T., W.-C. Wang, and J.-P. Chen, 2010: Simulation of the effects of increasing cloud condensation nuclei on mixed-phase clouds and precipitation of a front system.
Atmospheric Research, 96, 461-476.
Cotton, R., and P. Field, 2002: Ice nucleation characteristics of an isolated wave cloud.
Quarterly Journal of the Royal Meteorological Society: A journal of the atmospheric sciences, applied meteorology and physical oceanography, 128, 2417-2437.
Curry, J. A., J. L. Schramm, W. B. Rossow, and D. Randall, 1996: Overview of Arctic cloud and radiation characteristics. Journal of Climate, 9, 1731-1764.
de Boer, G., T. Hashino, and G. J. Tripoli, 2010: Ice nucleation through immersion freezing in mixed-phase stratiform clouds: Theory and numerical simulations.
Atmospheric Research, 96, 315-324.
de Boer, G., H. Morrison, M. Shupe, and R. Hildner, 2011: Evidence of liquid dependent ice nucleation in high‐latitude stratiform clouds from surface remote sensors.
Geophysical Research Letters, 38.
DeMott, P. J., 1990: An exploratory study of ice nucleation by soot aerosols. Journal of applied meteorology, 29, 1072-1079.
Diehl, K., and S. Wurzler, 2004: Heterogeneous drop freezing in the immersion mode:
Model calculations considering soluble and insoluble particles in the drops. Journal of the atmospheric sciences, 61, 2063-2072.
Dusek, U., and Coauthors, 2010: Enhanced organic mass fraction and decreased hygroscopicity of cloud condensation nuclei (CCN) during new particle formation events. Geophysical Research Letters, 37.
Fan, J., M. Ovtchinnikov, J. M. Comstock, S. A. McFarlane, and A. Khain, 2009: Ice formation in Arctic mixed‐phase clouds: Insights from a 3‐D cloud‐resolving model with size‐resolved aerosol and cloud microphysics. Journal of Geophysical Research: Atmospheres, 114.
Herich, H., and Coauthors, 2009: Water uptake of clay and desert dust aerosol particles at sub-and supersaturated water vapor conditions. Physical Chemistry Chemical Physics, 11, 7804-7809.
Hoose, C., J. E. Kristjánsson, J.-P. Chen, and A. Hazra, 2010: A classical-theory-based parameterization of heterogeneous ice nucleation by mineral dust, soot, and biological particles in a global climate model. Journal of the Atmospheric Sciences, 67, 2483-2503.
Hung, H.-M., K.-C. Wang, and J.-P. Chen, 2015: Adsorption of nitrogen and water vapor by insoluble particles and the implication on cloud condensation nuclei activity.
Journal of Aerosol Science, 86, 24-31.
Konovalov, I. B., and Coauthors, 2018: Estimation of black carbon emissions from Siberian fires using satellite observations of absorption and extinction optical depths.
Atmospheric Chemistry and Physics, 18, 14889-14924.
Lin, Y. C., 2015: Numerical Simulation of Dust-Cloud Interactions Using Regional Models, Department of Atmospheric Sciences, National Taiwan University, 1-218 pp.
Liu, J., S. Fan, L. W. Horowitz, and H. Levy, 2011: Evaluation of factors controlling long‐ range transport of black carbon to the Arctic. Journal of Geophysical Research:
Atmospheres, 116.
Lupi, L., and V. Molinero, 2014: Does hydrophilicity of carbon particles improve their ice nucleation ability? The Journal of Physical Chemistry A, 118, 7330-7337.
Meyers, M. P., P. J. DeMott, and W. R. Cotton, 1992: New primary ice-nucleation parameterizations in an explicit cloud model. Journal of Applied Meteorology, 31, 708-721.
Morrison, H., and A. Gettelman, 2008: A new two-moment bulk stratiform cloud microphysics scheme in the Community Atmosphere Model, version 3 (CAM3).
Part I: Description and numerical tests. Journal of Climate, 21, 3642-3659.
development of trailing stratiform precipitation in a simulated squall line:
Comparison of one-and two-moment schemes. Monthly weather review, 137, 991- 1007.
Morrison, H., G. de Boer, G. Feingold, J. Harrington, M. D. Shupe, and K. Sulia, 2012:
Resilience of persistent Arctic mixed-phase clouds. Nature Geoscience, 5, 11.
Okamoto, H., K. Sato, and Y. Hagihara, 2010: Global analysis of ice microphysics from CloudSat and CALIPSO: Incorporation of specular reflection in lidar signals.
Journal of Geophysical Research: Atmospheres, 115.
Paukert, M., and C. Hoose, 2014: Modeling immersion freezing with aerosol‐dependent prognostic ice nuclei in Arctic mixed‐phase clouds. Journal of Geophysical Research: Atmospheres, 119, 9073-9092.
Peng, J., and Coauthors, 2017: Ageing and hygroscopicity variation of black carbon particles in Beijing measured by a quasi-atmospheric aerosol evolution study (QUALITY) chamber. Atmospheric Chemistry and Physics, 17, 10333.
Petters, M., and S. Kreidenweis, 2007: A single parameter representation of hygroscopic growth and cloud condensation nucleus activity.
Prenni, A. J., P. J. Demott, D. C. Rogers, S. M. Kreidenweis, G. M. Mcfarquhar, G. Zhang, and M. R. Poellot, 2009: Ice nuclei characteristics from M-PACE and their relation to ice formation in clouds. Tellus B: Chemical and Physical Meteorology, 61, 436- 448.
Prenni, A. J., and Coauthors, 2007: Can ice-nucleating aerosols affect Arctic seasonal climate? Bulletin of the American Meteorological Society, 88, 541-550.
Pruppacher, H. R., and J. D. Klett, 1980: Microphysics of clouds and precipitation. Nature, 284, 88-88.
Qiu, S., X. Dong, B. Xi, and J. L. Li, 2015: Characterizing Arctic mixed‐phase cloud
structure and its relationship with humidity and temperature inversion using ARM NSA observations. Journal of Geophysical Research: Atmospheres, 120, 7737-7746.
Randles, C., and Coauthors, 2016: Technical Report Series on Global Modeling and Data Assimilation.
Sedlar, J., M. D. Shupe, and M. Tjernström, 2012: On the relationship between thermodynamic structure and cloud top, and its climate significance in the Arctic.
Journal of Climate, 25, 2374-2393.
Shupe, M. D., and J. M. Intrieri, 2004: Cloud radiative forcing of the Arctic surface: The influence of cloud properties, surface albedo, and solar zenith angle. Journal of Climate, 17, 616-628.
Shupe, M. D., S. Y. Matrosov, and T. Uttal, 2006: Arctic mixed-phase cloud properties derived from surface-based sensors at SHEBA. Journal of the atmospheric sciences, 63, 697-711.
Shupe, M. D., and Coauthors, 2008: A focus on mixed-phase clouds: The status of ground- based observational methods. Bulletin of the American Meteorological Society, 89, 1549-1562.
Solomon, A., M. D. Shupe, P. Persson, and H. Morrison, 2011: Moisture and dynamical interactions maintaining decoupled Arctic mixed-phase stratocumulus in the presence of a humidity inversion. Atmospheric Chemistry & Physics Discussions, 11.
Sorjamaa, R., and A. Laaksonen, 2007: The effect of H 2 O adsorption on cloud-drop activation of insoluble particles: a theoretical framework.
Tanaka, T. Y., and M. Chiba, 2006: A numerical study of the contributions of dust source regions to the global dust budget. Global and Planetary Change, 52, 88-104.
investigation of the coagulation mixing between dust and hygroscopic aerosol particles and its impacts. Journal of Geophysical Research: Atmospheres, 120, 4213- 4233.
Whitby, K. T., 1978: The physical characteristics of sulfur aerosols. Sulfur in the Atmosphere, Elsevier, 135-159.