國立臺灣大學公共衛生學院環境衛生研究所 博士論文
Institute of Environmental Health College of Public Health
National Taiwan University Doctoral Dissertation
發光二極體做為室內照明光源對視網膜影響之大鼠研究 Light Emitting Diode(LED) lighting as domestic light
source and retina injury in rat models
商育滿 Yu-Man Shang
指導教授:王根樹 博士 楊長豪 博士 Advisor: Gen-Shuh Wang, Ph.D.
Chang-Hao Yang, MD. Ph.D.
中華民國 106 年 2 月 February, 2017
Light Emitting Diode (LED) lighting as domestic light source and retina injury in rat models
A dissertation prepared by Yu-Man Shang
Submitted to
The Institute of Environmental Health College of Public Health
In partial fulfillment of the requirements for the degree of Doctor of Philosophy in the subject of Environmental Health
National Taiwan University Taipei, Taiwan
February, 2017
Dedication
This thesis is the rich accumulation of sweat from hard work, tears from obstruction, and inevitable sleepless nights which every graduate student endures. But more importantly, it is the memories of all accomplishments and the joy of finding my true courage toward an ultimate goal on this journey. It is for you, ones that I love, that I dedicate this piece of my life.
Thank you, Mom, Dad in heaven, Miles, Dr. Cheng, Tim, Zoe, and all my dear friends along the way.
Acknowledgements
I am blessed to have many great mentors who guide my way through the journey of this research.
Dr. Gen-Shuh Wang who is my advisor deserves the deepest appreciation for finishing this study. He paves every step of my path to success throughout the courses of my doctoral study.
He gives me the freedom to create a vision, offers his wise advices when I am troubled, and brings laughs to the room when I am depressed. He is always generous in time for my requests during his extremely tight schedule. He has faith in me, and that empowers me to do anything which might seem impossible to others from the beginning. I would like to express my tremendous appreciation and gratitude to him for his help and steadfast encouragement in all my professional endeavors.
I also deeply thank Dr. Chang-Hao Yang for his prodigious knowledge in ophthalmology and his guidance to my experiments. Thank him for the technical training and resource sharing as well as the amity throughout the years. He strengthens my passion of pursuing a scientific career with rigorous practices.
Deep appreciation is also given to Dr. David H. Sliney who guides me the way to conquer the toughest challenges and introduces me to many professional conferences and committees. He demonstrates the contagious enthusiasm of a noble scholar and earns my highest respect for all his compassion and decency.
Countless gratitude is also given to Dr. Li-Ling Lee who provides tremendous resources and advices from many aspects. She brightens up my days when the light is out. For all the greetings and encouragements during my tough times, thank her for the unrequited supports.
Many thanks are also given to the other members of my dissertation committee: Dr. Dan- Pai Feng, Dr. Luke Long-Kuang Lin, Dr. Pau-Chung Chen, Dr. Yaw-Huei Hwang, Dr. Chin- Pao Cheng, and Dr. Tzu-Chau Chang. I have benefited remarkably form their professional comments and valuable suggestions.
Finally, I would like to thank all the members from Dr. Yang’s retinal research lab and Dr.
Lee’s LED research lab, especially for the countless discussions and technical assistances from Ms. Zi-Yun Weng, Mr. Eric Wang, Mr. Bo-Lin Feng, Mr. Kevin Lin and many others.
I am forever indebted to you all.
中文摘要
照明是生活的基本需求,人工光源也由照亮空間的基本要求,延伸至人因工程 所 關 注 的 健 康 與 舒 適 考 量 。 近 來 各 界 積 極 推 動 節 能 照 明 , 發 光 二 極 體 (Light Emitting Diode, LED) 照明以環保節能的優勢深獲期許,其中室內照明以白光 LED 做為替代光源頗具潛力與代表性。而 LED 屬固態發光 (Solid State Lighting, SSL) 的 一種,是由半導體材料所製成的發光元件,不同材料與製程可發出不同的波長,視 覺系統藉此感受到不同顏色的光。LED 的發光特性與光學表現適合應用於指示性的
用途,當轉型發展成為一般照明,目前符合經濟效益且成為主流的白光 LED,大多
為藍色晶片搭配黃色螢光粉的 (phosphate-conversion, PC) 的型態,而其光譜有一大
區間落於400 nm – 550 nm,屬於視網膜藍光危害區,且其中尖銳的藍光波峰所呈現
的單點強度,可能對視網膜產生傷害而未被人眼察覺,長期低劑量的暴露也可能對 黃斑部產生累積性的負面效應而不自覺。因此 LED 照明如何呈現最適合生理機轉 的光學表現,有待醫學及公衛體系的專業研究並加以定義。
本研究之目的在探討以白光 LED 為室內照明光源時,其所含不同波長光線對
於視網膜的潛在影響。有別於前人研究多以短時間(數秒至數天)的方式進行,本
研究針對白光 LED 作為室內照明光源之波長與頻譜分佈進行長期低暴露分析,透
過大鼠動物實驗,以視網膜電波圖 (electroretinogram , ERG) 檢查視網膜功能上所受 的衝擊,同時以多種組織切片觀察感光細胞形貌上的改變,以及透過生化分析觀察 細胞受到氧化壓力而引發的凋亡和壞死狀況,探討視網膜光傷害的機轉,研析白光 LED 照明對使用者視網膜生理結構的影響。為達成此研究目的,整體研究架構以二 階段實驗方式進行。
第一階段以藍光 LED (460 nm) 以及全頻譜的白光 LED (CCT 6500) 搭配相對應 的螢光燈管 (CFL, CCT 6500) 和黃光 (CFL, CCT 2700) 對大鼠進行照光暴露實驗,
以證實在參數相同的暴露環境中,LED 比 CFL 更容易誘發視網膜的光傷害。接著
第二段實驗以三種不同波段的LED 光源,包括藍光( 460 nm)、綠光 (530 nm)及
紅光 (620 nm) 進行比對,透過更深入的生化分析工具,觀察 LED 所誘發的視網膜
感光細胞在不同光源的暴露下產生的光化學危害 (photochemical injury) ,細胞結構 變化是由氧化壓力所引發,且呈現波長的劑量效應關係。相同暴露參數下,波長越
短造成的傷害越強,因而推論在大鼠實驗中,做為室內照明的白光 LED 光源中,
藍光對視網膜的危害貢獻最多。
以環境衛生的角度,本研究結果提醒以 LED 做為室內照明時,必須特別留意
頻譜中藍光的比重分佈。同時也提供予相關產業於產品研發時挹注健康的考量因子,
並呼籲使用者注意暴露風險與防範措施 。然而以風險評估的觀點而言,此動物實驗 結果並無法直接定義人類的使用風險,尚須經過適當的評估或甚至進一步的人體暴 露分析才能得到具體結論,未來應有更多學者延續此主題的研究。
關鍵詞:視力;視網膜;光傷害;照明;氧化壓力;發光二極體;藍光危害
Abstract
The rapid development of white light-emitting diode (LED) lighting has raised serious retinal hazard concerns. LED delivers higher levels of blue light to the retina compared to conventional domestic light sources. However, the majority of the published retinal blue light injury studies are either in anesthetized animals or in vitro with high exposure intensity for acute injury assessment. The significance of the blue component in LED lighting contributing to the injury needs further study in a free-running animal model with chronic exposure setting.
This study intends to assess the potential adverse effects from exposure to the domestic LED lights with different wavelengths. Two sets of LED-induced retinal neuronal cell damage in the Sprague-Dawley rat models through functional, histological, and biochemical measurements were completed. In the first part of study, blue LED (460 nm) and full-spectrum white LED (CCT 6500) coupled with matching compact fluorescent lamps (CFL) were used for exposure treatments. The results suggested that the LED white light has a higher chance to induce retinal photochemical injury (RPI) than does the conventional CFL white light. The results raise questions related to adverse effects on the retina from chronic LED light exposure compared to current lamp sources that have less blue light. To further assess the risk, LED induced RPI with wavelength dependency and its mechanism were focused on the second part of study.
Although there has been a wealth of studies describing the RPI associated with wavelength dependency previously, the experimental settings were focused on high intensity light exposure over a short period of time (a few seconds to 3 days) for acute or subacute toxicity assessments. The tested animals were anesthetized or forced to stare into the lights in most of the cases, and the light sources varied due to contemporary technology availability. Thus, in the second part of study, blue (460 nm), green (530 nm), and red (620 nm) LEDs were investigated to measure how specific bands were responsible for retinal phototoxic effects under the same irradiance level at 102 μW/cm2. Both functional and histopathological results indicated blue light-induced RPI. The oxidative stress and iron-related molecular markers suggested that blue LED exposure increased retinal toxicity compared with longer wavelength LEDs. Biochemical assays on lipid,
LED light-induced retinal injury could be due to oxidative stress through iron overload. Several biomarkers confirmed the greater risk of LED blue-light exposure in awake, task-oriented rod-dominant animals.
Based on the study results, it is concluded that LED light exposure may induce RPI through oxidative stress with a wavelength-dependent effect. More importantly, the long- term effects of exposure to low doses of domestic lighting may lead to serious retinal degenerative diseases. Several functional, morphological, and biochemical measurements were applied to characterize the exposure results associated with this injury. The wavelength-dependent effect should be considered carefully when switching to LED domestic lighting applications. However, the exact mechanism underlying these effects will be the subject of ongoing investigation with more analytical methods. The interpretation from the animal study to human applications should also be carefully considered based on the risk assessment perspective.
Keywords: LED, light damage, retina, eye, retinal light injury, blue light, oxidative stress
Table of Contents
Dedication ... i
Acknowledgements ... ii
中文摘要 ... iii
Abstract ... v
Table of Contents ... vii
List of Figures ... ix
List of Tables ... x
Abbreviations ... xi
1 INTRODUCTION... 1
1.1 Background ... 1
1.1.1 Light affects daily living through vision ... 1
1.1.2 Artificial light sources ... 1
1.1.3 Energy saving lighting ... 3
1.1.4 Learning from the history ... 3
1.2 Objectives ... 4
1.2.1 Direct outcome ... 5
1.2.2 Indirect influence ... 6
2 LITERATURE REVIEW ... 7
2.1 Light ... 7
2.1.1 Light Source ... 7
2.1.1.1 Light Properties ... 7
2.1.2 Light Measurement ... 8
2.1.2.1 Color Temperature ... 8
2.1.2.2 Intensity ... 11
2.1.3 Solid State Lighting (SSL) ... 14
2.1.3.1 Solid State Light Segments ... 14
2.1.3.2 LED Light Characteristics ... 14
2.1.3.3 LED Light for Lighting ... 16
2.1.3.4 White Light LED Performance Diversification ... 20
2.2 Retinal Physiopathology... 22
2.2.1 Retina React with Light ... 22
2.2.2 Retina Light Injury ... 24
2.2.3 Action Spectrum of Retinal Light Injury ... 26
2.2.4 Progress of Photoreceptor Light Induced Injury ... 27
2.2.5 Animal Model for Retinal Light Injury ... 28
2.3 Potential retinal injury induced by chronic exposure to LED light ... 30
2.3.1 Data Collection and Selection ... 30
2.3.2 Retinal Light Injury vs. LED Lighting ... 31
2.3.3 Retinal Light Injury Mechanisms ... 32
2.3.4 Principal of the domestic lighting exposure ... 33
3 RESEARCH DESIGN AND METHODS ... 34
3.1 Hypotheses of photochemical injury ... 34
3.2 Animal handling and light exposure plan ... 35
3.2.1 Animals and rearing conditions ... 35
3.2.2.1 For the comparison of CFL vs. LED ... 37
3.2.2.2 For the comparison of RGB LEDs ... 39
3.2.3 Light exposure ... 40
3.2.3.1 For the comparison of CFL vs. LED ... 40
3.2.3.2 For the comparison of RGB LEDs ... 41
3.3 Sample pretreatment ... 42
3.4 Analytical Methods ... 43
3.4.1 Electroretinography (ERG) ... 43
3.4.2 Hematoxylin and eosin (H&E staining) ... 45
3.4.3 Transmission electron microscopy (TEM) analysis ... 46
3.4.4 Terminal deoxynucleotidyl transferase dUTP nick end labeling (TUNEL) ... 48
3.4.5 Immunohistochemistry (IHC) ... 48
3.4.6 Free radical assay (reactive oxidative species, ROS) ... 49
3.4.7 Western blotting (WB) ... 49
3.4.8 Hydrogen peroxide (H2O2) assay ... 50
3.4.9 Total iron and ferric (Fe3+) assay ... 51
3.5 Statistical analysis ... 51
4 RESULTS AND DISCUSSION ... 52
4.1 White LED at domestic lighting level to induce retinal injury ... 52
4.1.1 Electrophysiological response shows photoreceptor cell function loss ... 52
4.1.2 Retinal histology–H&E staining showing layer damages ... 54
4.1.3 Apoptosis Detection - TUNEL staining detects nuclear apoptosis ... 56
4.1.4 TEM demonstrations on the cellular injury ... 58
4.1.5 Immunohistochemistry (IHC) staining results indicating retinal light injury ... 60
4.1.6 Oxidative Stress -- superoxide anion O2-. shows the injury ... 62
4.2 Mechanism of LED induced retinal injury and its wavelength dependency ... 64
4.2.1 Functional and morphological alterations ... 64
4.2.2 RPI oxidative stress markers expression ... 70
4.2.3 Iron metabolism and superoxide products ... 73
4.3 Discussion ... 78
4.3.1 Retinal light injury susceptibility between human and experimental animals ... 78
4.3.2 Oxidative stress induced injury ... 79
4.3.3 Low-intensity chronic exposure ... 79
4.3.4 LED-induced RPI is wavelength-dependent ... 80
4.3.5 Oxidative stress and photon absorption-stimulated RPI ... 80
4.3.6 Iron-related RPI oxidative pathway ... 82
4.3.7 Wavelength (hue) discrimination and specie differences ... 82
4.3.8 Environmental health perspectives ... 83
5 CONCLUSION ... 85
5.1 LED lighting induces retinal light injury ... 85
5.2 Blue light makes the most contribution to retinal light injury ... 86
5.3 The way ahead ... 86
6 REFERENCES ... 89
7 APPENDIX ... 95
List of Figures
Figure 1 Artificial light source branches ... 2
Figure 2 Illuminance recommendations fluctuations since 1930 5, 6 ... 4
Figure 3 Study Objectives ... 5
Figure 4 Electromagnetic radiation ranges ... 8
Figure 5 Example of LED color temperature correlation ... 9
Figure 6 CIE 1931 chromaticity diagram 8 ... 11
Figure 7 (A) LED in details and (B) illustration of LED electron convert to photons .... 15
Figure 8 Light and heat emission direction (A) incandescent lamp; (B) LED chip 9 .... 15
Figure 9 White light LED converting methods 11, 12 ... 17
Figure 10 Spectral representations of white light using LEDs 4 ... 18
Figure 11 LED spectral power distribution in different color temperature models 4 ... 19
Figure 12 Spectrum distribution for three domestic light sources 4 ... 21
Figure 13 Light path within the retina layers 15 ... 23
Figure 14 Light absorption and transmittance in the eye 4, 18, 19 ... 24
Figure 15 Action spectrum of retinal light damage 17 ... 27
Figure 16 Scheme of the photoreceptor light induced injury progress... 28
Figure 17 Sprague-Dawley (SD) rats acute and chronic retinal light injury 27 ... 29
Figure 18 Literature relation map... 31
Figure 19 Timeframe of the experimental design ... 36
Figure 20 Light source spectral power distribution (SPD) curves ... 38
Figure 21 Custom made LED light strip... 39
Figure 22 LED light source spectral power distribution (SPD) curves ... 40
Figure 23 Diagram of light exposure setting ... 42
Figure 24 (A) Eye enucleation and (B) retina tissue removal ... 43
Figure 25 ERG operation ... 44
Figure 26 Diagram of retina response components to ERG stimulation 15 ... 45
Figure 27 Specimen of a retina slice ... 47
Figure 28 TEM observation instrument (JEOL JEM-1400) ... 47
Figure 29 ERG responses after light exposure ... 53
Figure 30 Retinal light injury after 9 d or 28 d of exposure analyzed by H&E staining 55 Figure 31 Light-induced retinal cell apoptosis tested by TUNEL labeling ... 57
Figure 32 Retinal cellular injury studied by TEM ... 59
Figure 33 Retinal light injury labeling after 9 d of exposure by IHC ... 61
Figure 34 A reactive oxygen species assay after 3 d and 9 d of light exposure ... 63
Figure 35 Electroretinography (ERG) responses... 66
Figure 36 Histological analysis ... 67
Figure 37 Retinal cellular injury studied by transmission electron microscopy (TEM) . 68 Figure 38 Molecular apoptotic marker detection ... 69
Figure 39 Retinal light injury molecular labeling by immunohistochemistry (IHC) ... 71
Figure 40 Western blot (WB) assay of anti-oxidant enzymes ... 72
Figure 41 Western blot (WB) assay of iron metabolism markers ... 75
Figure 42 Iron metabolism and superoxide products ... 76
Figure 43 Light source registration at California energy commission ... 84
List of Tables
Table 1 The photometric quantities ... 13 Table 2 photometric and radiometric units ... 13 Table 3 Exposure groups allocation ... 37
Abbreviations 1. age-related macular degeneration (AMD) 2. analysis of variance (ANOVA)
3. American National Standards Institute (ANSI)
4. Association for Research in Vision and Ophthalmology (ARVO) 5. Certification Body Testing Laboratory (CBTL)
6. correlated color temperature (CCT) 7. ceruloplasmin (CP)
8. chemiluminescence (CL)
9. compact fluorescent lamp (CFL)
10. Commission Internationale de l´Eclairage (International Commission on Illumination, CIE)
11. distilled water (DW) 12. electromagnetic (EM) 13. electroretinography (ERG) 14. ferric (Fe3+)
15. ferritin (Ft) 16. ferroportin (Fpn) 17. ferrous (Fe2+)
18. full width at half maximum (FWHM) 19. ganglion cell layer (GCL)
20. glutathione peroxidase (GPx1)
21. hematoxylin and eosin (H&E) staining 22. hemeoxygenase-1 (HO-1)
23. hydrogen peroxide (H2O2) 24. hydroperoxyl radical (HO2) 25. Kelvin (K)
26. hydroxyl radicals (OH.)
27. Institutional Animal Care and Use Committee (IACUC) 28. immunohistochemical (IHC)
29. inner nuclear layer (INL) 30. light-emitting diode (LED) 31. lipid electron donors (LH) 32. lipid hydroperoxide (LO2.) 33. lipid radical (L.)
34. manganese superoxide dismutase (MnSOD) 35. organic light-emitting diodes (OLED) 36. outer nuclear layer (ONL)
37. outer segment (OS) 38. oxygen (O2)
39. personal protective equipment (PPE) 40. phosphate buffered saline (PBS) 41. phosphate-conversion (PC) 42. photoreceptor inner segment (PIS) 43. polymer light-emitting diodes (PLED) 44. photoreceptor outer segment (POS)
48. rod outer segment (ROS) membranes 49. red, green, and blue (RGB)
50. retinal photochemical injury (RPI) 51. retinal pigment epithelium (RPE)
52. scientific committee on emerging and newly identified health risks (SCENIHR) 53. spectral power distribution (SPD)
54. Sprague–Dawley (SD) rats 55. superoxide anion (O2-.) 56. superoxide dismutase (SOD2) 57. solid-state lighting (SSL)
58. terminal deoxynucleotidyl transferase dUTP nick end labeling (TUNEL) 59. transferrin (Tf)
60. transferrin receptor (TrfR)
61. transmission electron microscopy (TEM) 62. ultraviolet (UV)
63. western blotting (WB)
1 INTRODUCTION
1.1 Background
1.1.1 Light affects daily living through vision
It is estimated that over 80% of the information processed in the human brain is directly or indirectly interpreted by the visual system. Because of the nature of print and near-work function involved, the task of reading requires particular greater accuracy 1. To perform this function, the light source is necessary and essential to ocular system. The complex interactions within the ocular system provide the ability to interpret photic stimulus into visual information. When light enters the eye, and reaches the retina, the visual perception is initiated by transforming the radiant energy into visual transduction signals. This transformation also creates toxic potential and the eyes have developed several protective mechanisms defending light-induced injury.
However, the injury may still occur under certain conditions which has been intensively reported in clinical and basic science literature 2.
1.1.2 Artificial light sources
The burning or heated light source (incandescence) has been essentially used for many centuries. Some flame-operated lamps (namely kerosene, carbide and gas lamps) and candles are still practical to some situations. Those lamps were generated through chemical reaction to heat materials. The emitted spectrum is continuous with low correlated color temperature (CCT) due to the limited irradiating component and poor luminous efficacy 3. According to a 2012 report by European Commission-scientific committee on emerging and newly
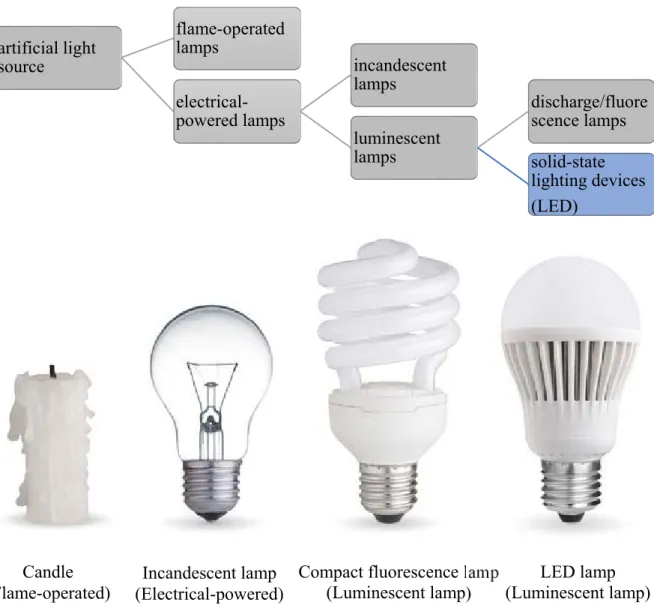
people who do not have access to electrical grid and being forced to rely on flame-operated lamps in everyday life. Alternatively, artificial light can also be generated without lighting up a fire (luminescence). Incandescent and luminescent lamps are two artificial lighting technologies in use today. The end category can be further divided into discharge / fluorescence lamps and solid state lighting (SSL) devices, respectively, as shown in Figure 1.
Figure 1 Artificial light source branches
Pictures from the web source: http://54.204.81.18/news/stories/311024-brandpost-the-evolution-is-here- moving-beyond-log-centric-siem
artificial light source
flame-operated lamps
electrical- powered lamps
incandescent lamps
luminescent lamps
discharge/fluore scence lamps solid-state lighting devices (LED)
Candle
(Flame-operated) Incandescent lamp (Electrical-powered)
Compact fluorescence lamp
(Luminescent lamp) LED lamp (Luminescent lamp)
1.1.3 Energy saving lighting
Among a wide variety of artificial lighting selections, the most recognized branch of SSL, light-emitting diodes (LED), is promoted by the energy conservation trend globally. With the announcement of LED for indoor lighting since 2009, the technology improvement in all aspects surged rapidly. However, LEDs emit higher levels of blue light compared to conventional light sources.
This is also the first time that humans have experienced such extensive blue- light exposure in the history 4. From an environmental health perspective, retinal light injury and the potential risks for chronic exposure from using LEDs as a domestic light source require assessment before further development of this important, energy-saving technology.
1.1.4 Learning from the history
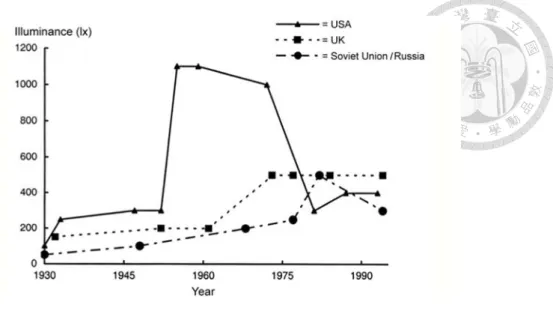
Learning from the history (see Figure 2 and text explain in Appendix), oscillations which are solely social-economical driven on the illuminance recommendations for several decades. The health factor was not even the concern in some periods of time. However, researchers are now able to evaluate the full scope of new lighting developments with the knowledge and awareness available. Therefore, it is necessary to include the health concern along with the excitement of LED lighting for general applications.
Figure 2 Illuminance recommendations fluctuations since 1930 5, 6
1.2 Objectives
As shown in Figure 3, the objective of this study is to investigate the ocular safety (majorly retina) of white light LED to be used as a constant domestic light source in a pathophysiological perspective. The core is to develop a scientific assessment report for further expansion. There is an urgent need for a better evaluation of potential light toxicity, depending on the different artificial light sources available, and upon chronic exposure of different populations to define clear guidelines for manufacturers and associated regulation officials.
Figure 3 Study Objectives 1.2.1 Direct outcome
Adapting LED lighting era, the availability of new imaging technology and constant improving analytical instrumentation for ocular research expands the understanding of the light-induced injury. The first aim of this study is to identify the injury pattern and its mechanisms in order to define intervention suggestions for general users. Among many risk factors affecting the severity of this type of injury, cumulative effect and dose dependent relationship of light intensity, spectrum distribution, and exposure duration are the main objectives of this study.
LEDlightingtouse asdom esticlightsource anditsrisktothe retina
DirectOutcom e Ocular Safety
IndirectInfluence Industry development
General Public
Dose ‐ Response Relationship
Industrial Application Governmental Regulation
Lighting Characteristics Photobiology Safety
• Spectrum / Wavelength
• Consistency
• Certification
• Labeling
• PPE advisory
• Retina Injury
• Dose Dependent
• Cumulative Effect
• Syndrome Recognition
• Purchase Precaution
• Post‐Use Treatment
*PPE:personalprotectiveequipment
1.2.2 Indirect influence
It is also a further hope to bring continuous influences to other sectors in the path of LED lighting development. This study is expected to explain scientific findings for manufactures to design better LED lighting products that minimize the risk to retina function. It may further urge a need for regulation updates on the photobiology safety concern. Some critical health-related lighting characteristics including CCT, spectrum distribution, and consistency should be properly certificated and labeled. Additionally, personal protective equipment (PPE) should be created and advised for inevitable occupational exposure situations.
2 LITERATURE REVIEW 2.1 Light
2.1.1 Light Source
Light exposure is necessary for the visual sensory operation and also essential for entraining the circadian system. However, light exposure can have both positive and negative effects on human health. Some impacts that can be recognized instantly after exposure and some prolonged after many years 5. 2.1.1.1 Light Properties
As shown in Figure 4, light is a part of electromagnetic (EM) radiation in the range from 400 nm to 780 nm or some say 700 nm (1 nm equals to 10-9 m) that is visible to human eye. Similar to EM radiation, light is emitted by quantum state transition when excess energy is to be released in this specific wavelength range. Nature light sources occurs by heat, inelastic collisions and nuclear reactions involving atomic/electronic de-excitation activities 5, 7.
According to Boyce 5 and Held 7, examples include: “(1) the glowing appearance of fires, flames and other sources such as volcanic hot material, where thermal radiation is released; (2) the photochemical light generation of animals such as the glow-worm; (3) the Nordic light (aurora borealis) when sprinklings of elementary particles are trapped by the earth’s magnetic field and hit the outer atmosphere; (4) the bright sensation of the electric discharge through the air in lightning, and last but not least (5) the light emitted by the sun, which emerges from the hot plasma induced by hydrogen to helium fusion.”
Figure 4 Electromagnetic radiation ranges
Picture from the web source: https://publiclab.org/wiki/revisions/sample-curriculum-all-about-light
2.1.2 Light Measurement 2.1.2.1 Color Temperature
Color temperature is the most important characteristic that describes how
“cool” (bluish) or how “warm” (yellowish) of a light defined by CCT. The CCT metric, given in Kelvin (K), relates the appearance of a light to the color of a theoretical black body heated to certain temperatures. As temperature rises, the black body becomes red, orange, yellow, white, and finally blue 3. Additionally, K characterizes the color of the emitted light, not the color of illuminated objects.
The CCT metric theorizes a complex spectral power distribution (SPD) to a particular amount. However, this conversion may produce discrepancy between
the other appearing pinkish. Thus, American National Standards Institute (ANSI) further references Duv to quantify the chromaticity distance of equal CCT.
ANSI has also set Duv tolerances for LED white lights 8.
White LED light with any specific CCTs can now be produced for interior and exterior lightings (see Figure 5). Moreover, higher-CCT LEDs work more efficiently than lower-CCT ones due to quantum efficiency differences. Hence, some advance LED products created with dynamic CCT adjustment feature to increase control flexibility.
Figure 5 Example of LED color temperature correlation
Picture from the web source: http://www.ledacademy.net/1-2-led-basic-parametres/
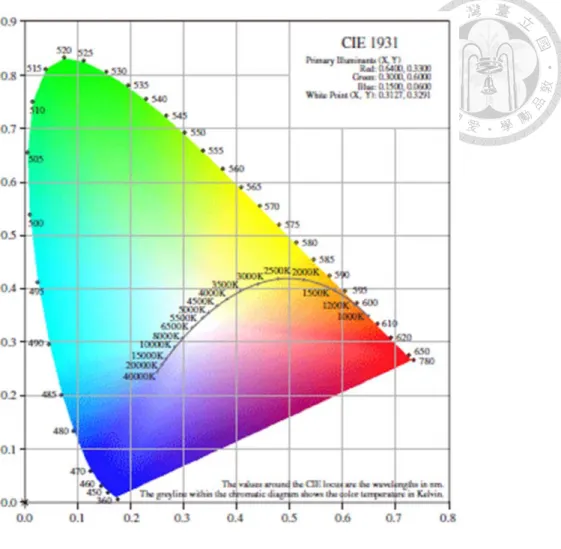
Furthermore, chromaticity coordinates can also characterize the color of the light emitted by a light source. In this system, the spectral emission of a black body is defined by famous Planck’s radiation law (see Figure 6) and is a function of its temperature only.
As shown in Figure 6, the values x, y, and z are known as the CIE chromaticity coordinates. (International Commission on Illumination - also known as the CIE from its French title, the Commission Internationale de l´Eclairage). As x + y + z = 1, only x and y coordinates are required to define the chromaticity of a color. When a color can be represented by two coordinates, all colors can be represented on a two-dimensional surface. All pure colors with single wavelength should lie on the outer curved border (or so called spectrum locus). According to CIE definition, the straight line joining the ends of the spectrum locus is the purple boundary and is the locus of the most saturated purples obtainable. At the center of the diagram, there is a point called the equal energy point. That is the point where a colorless surface will be located. Close to the equal energy point is a curve called the Planckian locus. This curve passes through the chromaticity coordinates of objects that operate as a black body, i.e.
the spectral power distribution of the light source is determined solely by its temperature.
Figure 6 CIE 1931 chromaticity diagram 8 2.1.2.2 Intensity
Explained in the book of human factors in lighting 5, human visual system does not response constantly at all wavelengths in the range 380 nm - 780 nm (some say 400 nm - 700 nm). Thus, besides the electromagnetic spectrum quantified by radiometric, the spectral sensitivity of human visual system should be measured as well. The spectral sensitivity measurement is equivalent to visual effect that principled in perception of brightness. Any wavelength within the visible range (380 nm -780 nm) can be perceived in both brightness and color.
Therefore, both wavelength and radiance should be considered and measured to
with higher radiance will be perceived brighter. When both the wavelength and radiance are different, the two fields will have different brightness and color. In this situation, changing the radiance can adjust the brightness; altering the wavelength can control the color of the light.
The relationship between the amount of light incident on a surface and the amount of light reflected from the same surface should be recognized. The total light output of a light source in all directions can be quantified by luminous flux.
Moreover, the luminous flux emitted in a given direction can be measured by luminous intensity. In other words, luminous intensity is the luminous flux emitted per unit solid angle, in a specified direction. The unit of luminous intensity is the candela (cd), which is equivalent to a lumen per steradian.
Luminous intensity is usually used to quantify the distribution of light from a luminaire.
The luminous flux falling on unit area of a surface is called the illuminance (lm/m2 or lux), which is the primary unit this study will adapt for light measurement. The luminous intensity emitted per unit-projected area of a source in a given direction is the luminance (cd/m2). The illuminance incident on a surface is the most widely used electric lighting design criterion. The luminance of a surface is correlate to its brightness. Table 1 summarizes some of the important photometric quantities, and Table 2 lists some of the photometric and radiometric measurement units that commonly used.
Table 1 The photometric quantities
Measure Definition Unit
Luminous flux That quantity of radiant flux which expresses its capacity to produce visual sensation.
Lumens (lm)
Luminous intensity The luminous flux emitted in a very narrow cone containing the given
direction divided by the solid angle of the cone.
Candela (cd)
Illuminance The luminous flux/unit area at a point on a surface.
Lumen/ meter2 (lux)
Luminance The luminous flux emitted in a given direction divided by the product of the projected area of the source element perpendicular to the direction and the solid angle containing that direction,
Candela/ meter2 (nit)
Table 2 photometric and radiometric units
Radiometry Photometry
Quantity Units Quantity Units
Radiant Energy J Luminous Energy lm s
Radiant flux W Luminous Flux lm
Irradiance W/m2 or mW/cm2 Illuminance lm/m2 Radiant Intensity W/sr Luminous Intensity lm/sr
Radiance W/(m2 sr) Luminance lm/(m2 sr)
2.1.3 Solid State Lighting (SSL) 2.1.3.1 Solid State Light Segments
Solid-state lighting (SSL) includes light converted by semiconductor light- emitting diode (LED), organic light-emitting diode (OLED), and polymer light- emitting diode (PLED) contrast to electrical filaments, plasma (used in arc lamps / fluorescent lamps), or gas. The concept of SSL comes from the solid-state electroluminescence, which differ from incandescent bulbs (use thermal radiation) and fluorescent tubes. SSL produces visible light with reduced heat generation and parasitic energy loss, compare to incandescent lamps. Among three SSL branches, LED is the most popular one in the current market.
Following the same principle of fluorescent lamps, white LED lights are generated by photoluminescence approach.
SSL is largely promoted for many traffic related applications (namely traffic lights, vehicle lights, street and parking lot lights), building exteriors, and expanding to indoor lightings in the past decade.
2.1.3.2 LED Light Characteristics
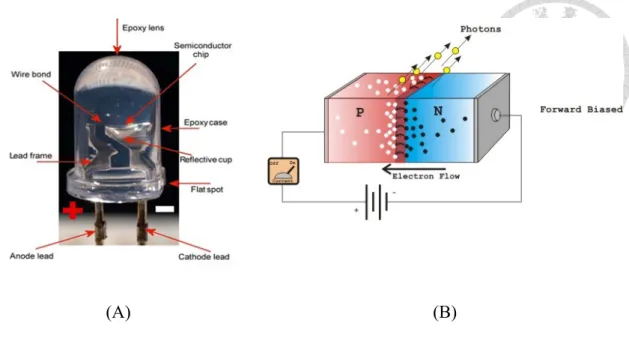
A LED (see Figure 7A) is principally monochromatic and the emitting wavelength determines its conversion efficiency. The value of the energy gap between the conduction and valence bands determines the dominant wavelength emitted by the semi-conductor junction (see Figure 7B). Additionally, the junction temperature controls the full width at half maximum (FWHM) value on the emitted spectral line. The LED was made and commercialized in red first, and a variety of colors can be created in today’s technology 4.
Figure 7 (A) LED in details and (B) illustration of LED electron convert to photons
Pictures from the web source: http://www.imagesco.com/articles/photovoltaic/photovoltaic-pg4.html
Besides the light intensity, the spectral distribution and unwanted heat transformation are other aspects dominating the lighting industry development.
As illustrated in Figure 8A and 8B, the directions (angle) of light emission may result in very different illumination characteristics and efficacy.
(A) (B)
Figure 8 Light and heat emission direction (A) incandescent lamp; (B) LED chip 9
(A) (B)
2.1.3.3 LED Light for Lighting
The rising of LED in architecture and varies of indoor lighting applications raises the concern of LED lighting quality 9. LED lighting has already leading the industry by its advantages of energy efficiency, durability, versatility, and color control. LED lighting is forecasted to take 46% of general illumination lumen-hour sales by 2030, contributing 3.4 quads of energy savings annually 10.
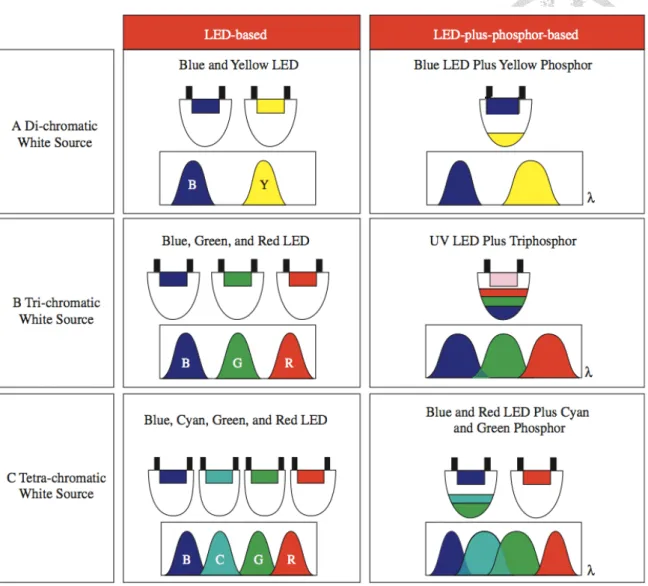
Creating “high power efficient white LED” is the key issue for LEDs to deeply penetrate the general lighting market. As shown in Figure 9, there are three color matching methods on either LED-based or LED-phosphor-based to generate white light listed below; each of these methods offers different advantages and drawbacks 4, 9.
1. Di-chromatic white source: combine diode emitting at short wavelength λ1 (blue) with a phosphor emitting or the other diode at a larger wavelength λ2 (yellow).
2. Tri-chromatic white source: combine red, green, and blue (RGB) three diodes; or use a diode, emitting in the near ultraviolet (UV), coupled with one or several phosphors.
3. Tetra-chromatic white source: use three diodes (at least) emitting at different visible wavelength which then combine themselves to produce white light;
or combination of diodes and phosphors to produce white light.
Figure 9 White light LED converting methods 11, 12
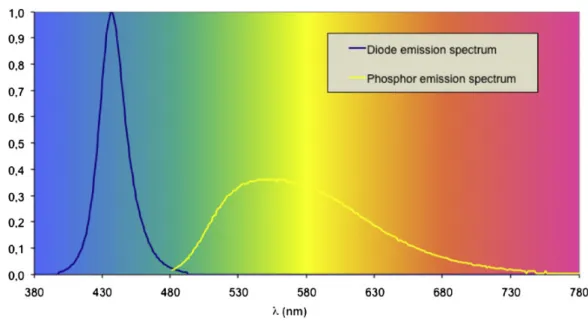
However, the first method (LED-phosphor-based) is totally dominating the white LED market promoted by its good luminous efficiency, overall optical performance, and cost effective concern. A diode generating a short wavelength is covered with a layer of phosphor, which absorbs a few short wavelength photons to convert them into longer wavelength photons. As shown in Figure 10, two complementary-wavelength-photons simultaneously reach the human retina creating a white light sensation, and to be perceived as a beam of white light 4, 9.
Figure 10 Spectral representations of white light using LEDs 4
For white LED mass-production (CCT above 5500 K), blue emitting diodes based on InGaN or GaN crystals and combined with a yellow phosphor (YAG:
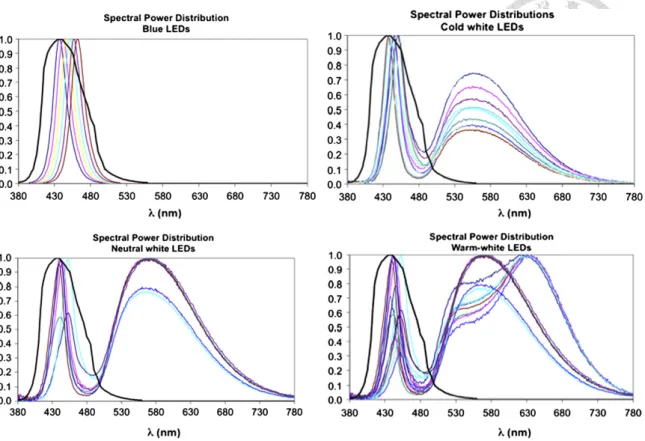
Ce or similar) are generally applied. An additional layer of phosphor that emitting red light is included for “warm-white” (CCT near 3200 K) LED mass- production. However, this added layer will significantly reduce LED luminous efficacy. More importantly as shown in Figure 11, regardless the CCT value (or the color of LED white light), the blue light element is always heavily overlapping the black curve representing the blue light hazard.
Figure 11 LED spectral power distribution in different color temperature models 4
The second method in Figure 9 is similar to fluorescent lamp production. For mass-production purpose, a short wavelength diode emitting near ultraviolet light combined with one or multiple layers of phosphor converting the UV radiations into visible white light. This approach can produce high quality white light with good color rendering. However, it is basically away from the emission of “blue light” which is excluded from this research.
The third approach in Figure 9, additive multiple color creates white light with desired CCT. More than three sources are normally applied for more color shades obtaining or reaching an accurate color point. Some unique colors (cyan, amber or red orange) can be added to further improve the color rendering for special lighting requirements with higher cost.
concerns, and it is the primary mass-production practice in the current market.
Therefore, it is the major LED white light manufacture technique that will be discussed in this risk assessment.
2.1.3.4 White Light LED Performance Diversification
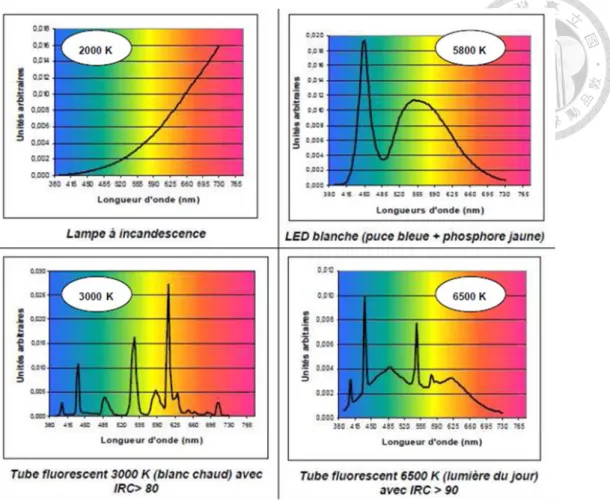
Monochromatic LED light is generated by an individual chip that emits a narrow range of light. By combining multiple spectral components produced by LED chip directly or through phosphor conversion as techniques mentioned above, LED lamps and luminaires deliver white light in different CCTs to the human eye. As illustrated in Figure 12, incandescent lamps (upper left) have a broad spectral distribution, and fluorescent lamps (lower left and right) base on a particular set of phosphors to present specific emission characteristics. The exact color temperature (CCT) can be adjusted by controlling the deposition of fluorescent powder. Although they also cover the full spectrum, the irregular spectral distributions are demonstrated by their serrated curves. Differently, the spectrum of the LED light shows a big blue peak along with a larger yellow peak (upper right).
Figure 12 Spectrum distribution for three domestic light sources 4
Theoretically, mixed LED light source means higher efficiency, longer life, and dynamic color control. In fact, they are generally have less color consistency, require complicated mixing optical system, and therefore raising the production cost 13. The phosphor conversion LED (PC-LED) have a better overall performance than mixed LEDs in terms of efficacy for general lighting applications. Furthermore, each product should be evaluated individually considering the performance variations resulting from the materials, components, and production procedures applied, regardless the manufacturer or technology offered.
2.2 Retinal Physiopathology 2.2.1 Retina React with Light
There are 10 layers in the retina 2, 14, 15, listing from the light path as follows:
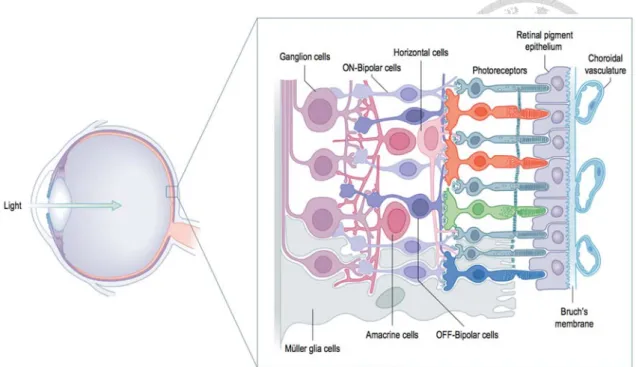
internal limiting membrane, nerve fiber layer, ganglion cell layer, inner plexiform layer, inner nuclear layer (INL), outer plexiform layer, outer nuclear layer (ONL), external limiting membrane, photoreceptor (rod and cone) layer, retina pigment epithelium (RPE). “Photoreceptor cells are differentiated postmitotic retinal neurons uniquely adapted for the efficient capture of photons and for the initiation of visual transduction” 16 (see Figure 13). In order to perform these functions, photoreceptors are being maintained in an oxygen rich environment and interact with high levels of incident light. The rod outer segment (ROS) membranes also contain high levels of polyunsaturated fatty acids, which stand a high potential for cell injury. “Yet, normally, most visual cells survive into the seventh decade and beyond” 17. The constant renewal of ROS, disk displacement and phagocytosis activities in the RPE layer may help ROS membrane turnover every nine to ten days 15 . “Photoreceptors also have the ability to adapt electrophysiologically to a wide range of incident light and metabolically to long-term environmental light conditions” 15. Additionally, repair mechanisms may also greatly prevent cell death. The delicate balance between the light interaction and overload-self-protecting mechanism determines the photoreceptor’s survival or irreversible damage.
Figure 13 Light path within the retina layers 15
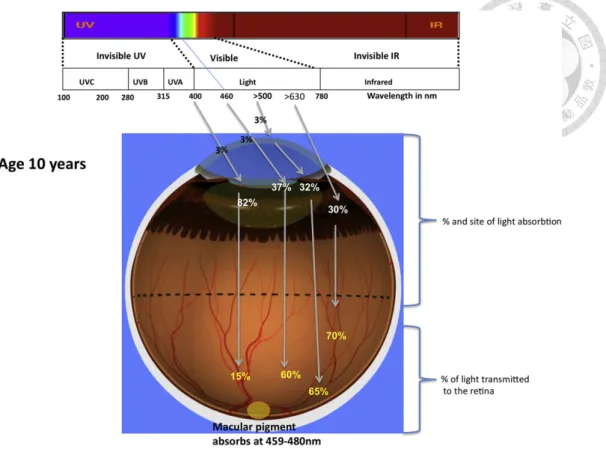
Moreover, specific wavelength has its different light absorption and transmittance rates for each tissue. Demonstrating in Figure 14 4, While the retinal transmission extends from 400 to 1200 nm, the retinal absorption peaks between 400 and 600 nm, which is the PC-LED white light dominated region.
Although the outer ocular tissues (such as cornea and lens) absorb majority of the toxic UV lights, it is another research subject and therefore is excluded from this report.
Figure 14 Light absorption and transmittance in the eye 4, 18, 19 2.2.2 Retina Light Injury
The retinal light injury induced by environmental light exposure was first described in 1966 20. Many associated investigations have been added to researcher’s understanding of its pathological process since. The initial intention of this type of study was to determine and define the injury, and it has expanded to more recent mechanism oriented pathological analyses. The light interacts with visual system through different mechanisms. Some of the ocular tissues or pigments are designed to absorb photons to reduce retinal exposure as a self- defense function. Moreover, some other ocular structures can increase oxidative stress and lead to retinal injuries through photochemical and photodynamic effects. Three mechanisms have been categorized: photothermal-,
radiant energy, a photon, from light to the retinal tissue” 2. When the intense light is converted into heat, the pigmented tissue (mostly melanin in the RPE and choroid) raises its temperature and causes photocoagulation.
(2). Photomechanical injury: the tissue damage is caused by mechanical compressive or tensile forces that generated by rapid introduction of energy into RPE melanosomes. Is occurred when extremely high retinal irradiances (typically laser beam) cause tissue heating and expansion that triggers instant retina alteration and bleeding.
(3). Photochemical injury: the tissue damage is caused by free radicals that generated from light exposure. This type of injury associates with both long- duration and short-wavelength light exposure 22, 23. When the retinal intrinsic protective mechanism is overdoing by defending the light insult, the retinal injury may occur.
Noell et al. suggested this hypothesis in 1966, after learning that the albino rat retinas were irreversibly injured by continuous exposure to ambient light.
This finding motivated extensive studies, further elucidating this mechanism different from mechanical and thermal retinal injury. This also is the most common type of retinal light injury with two classes 16, 24. According to Kremers and his colleagues’ research in 1988, these two classes of retinal injury have been shown in both rodent and primate models 24.
(a) Class I injury is characterized as exposure to white light (irradiance below 1 mW/cm2) for hours to weeks. Despite there are some debates on the initial site of injury from low-level light exposure, it is generally believed the initial injury site
(b) Class II injury is characterized as exposure to relatively high irradiance white light (above 10 mW/cm2). The initial injury site at the RPE with action spectrum peaking at shorter wavelengths.
2.2.3 Action Spectrum of Retinal Light Injury
It is well recognized that retinal light injury is determined by the exposure duration and light intensity reaches the retina (retinal irradiance). The wavelength dependency is also convinced with action spectra in its pathological process. As shown in Figure 15, the action spectrum of retinal light injury ranges from 400 nm to 580 nm and peaked around 480 nm to 500 nm. This action spectrum closely overlapping the PC white light LED emitting range and signifying a warning for ONL injury.
As mentioned previously, LED is becoming the primary light sources for many lighting applications. White LEDs make retina exposure to violet, indigo and blue light at much higher levels than in conventional light sources. This is the first time in history that human will be exposed to such substantial bright light regardless day or night. Moreover, photochemical injuries usually progressively induce photoreceptor loss long after the initial exposures.
Therefore, when evaluating all the knowledges and risks on blue-light hazard, its cumulative effect should also be carefully considered for this unavoidable chronic exposure.
Figure 15 Action spectrum of retinal light damage 17
2.2.4 Progress of Photoreceptor Light Induced Injury
As demonstrating on Figure 16, a typical development of retinal injury by light exposure is shown schematically 25. As first explained by Kuwabara and Gornss in a 1968 publication, only the tip of photoreceptor shows vacuoles at stage 1. At stage 2, outer segment is tortuous and swollen. Myelin membranes are separated from each other and form vesicular and tubular structures. The pathological changes can be found at the synaptic end of photoreceptic cells.
Pigment epithelium also shows clear increase in myeloid bodies. At stage 3, damaged outer segment is isolated from inner segment and becomes large round or pear-shaped body filled with tubular material, followed by cellular
Müllei’s cell at stage 5.
Figure 16 Scheme of the photoreceptor light induced injury progress
Diagram concept modified from (Kuwabara and Gornss) 25
2.2.5 Animal Model for Retinal Light Injury
Animal models is frequently used for light-induced retinal degeneration and mechanisms analysis. Rodent retina is a good alternative, if primate is not available for light induced retina degeneration study. To test the light induced retina injury in rodent species became the most convenient model due to its accessibility, capacity to induce photoreceptor-specific cell death, oxidative stress recognition, blood-retina barrier breakdown, and other inflammation marker identification 26.
Cell bodyPhotoreceptor sensory cilium Nucleus Inner segment Outer segment RPE GCL
INL
ONL
RPE CH
Normal 1 2 3 4 5
Injury Stage
exposure associated (acute); the second type of the injury is induced by less- bright-cyclic light exposure (chronic). Despite both types can lead to serious retinal degeneration, their injury mechanisms and phenotypes can be very different. Giving the credit to professor Mandal 27, Figure 17A shows the typical retinal injury by acute light exposure in a Sprague Dawley (SD) rat. The photoreceptor cell death can easily be observed (white arrows) juxtaposing by those normal-appearing cells (yellow arrow). On the other hand, the chronic light injured retina appears to be “normal” morphologically as shown in Figure 17B. Its ONL is thinning gradually without regional differences. The gentle ONL thinning process could protect the retina from massive retina destruction 27. This is a strategical self-defense mechanism so called “retina remodeling”, which should be observed closely and interpreted systematically.
Figure 17 Sprague-Dawley (SD) rats acute and chronic retinal light injury 27
(A) (B)
2.3 Potential retinal injury induced by chronic exposure to LED light 2.3.1 Data Collection and Selection
Increased use of LED applications may increase irreversible retinal injury.
This study was designed to systematically review the reports of retinal injury induced by LEDs, and identified 26 articles from 1707 published studies that associated with retinal light injury between 1966 and 2016. As shown in Figure 18, it presented a well-diversified research path and some with very limited light source descriptions. In this reviewing process, the type of light source prioritized the data screening. The majority of the included studies elucidated LED blue light hazard and confirmed the mechanism and retinal health effects. The results inform a systematic approach of research findings that greater control of blue light exposure from domestic LED lighting is required. This may be of particular concern for aging populations with pre-existing vision impairment.
Figure 18 Literature relation map 2.3.2 Retinal Light Injury vs. LED Lighting
Retinal light injury was studied intensively after Noell 20 first described the retinal injury caused by environmental fluorescent light exposure and numerous studies have reported that high-intensity blue light causes acute retinal injury 28,
29. However, few studies have focused on retinal injury caused by exposure to relatively low-intensity blue light under chronic exposure conditions 30.
The most popular LED lighting product, a phosphate-conversion (PC) LED, is a LED chip that emits blue light passing through a yellow phosphor-coating layer to generate the ultimate white light 31. Although the white light generated from LEDs appears normal to human vision, a strong peak of blue light ranging from 460 to 500 nm is also emitted within the white light spectrum and corresponds to a known spectrum for retinal hazards 4. Because LED (or solid- state) lighting sources are designed to emit all energy within the wavelength range of human vision, it is the most energy-efficient commercially manufactured light; however, many current “white-light” LED designs emit much more blue light than conventional lamps, which has a number of health implications, including disruption of circadian rhythms 32.
Moreover, the composition of the white-light spectrum differs among LED products, and their light qualities change over time. Although it is robust in the beginning, a PC-LED progressively releases more short-wavelengths (blue light) when LED lumen depreciation occurs because of phosphor degradation. The quality of the light deteriorates after the lights pass the 70% lumen maintenance
blue light exposure than other domestic lighting sources. Considering that cumulative exposure to blue light has been argued to accelerate aging of the retina and may play an etiological role in age-related macular degeneration (AMD) 4, domestic lighting with high blue light requires further examination to determine its potential retinal effects.
2.3.3 Retinal Light Injury Mechanisms
Photochemical retinal injury resulting from a cumulative effect is caused by free radicals generated from retinal tissue through continuous light exposure 23. When exposure surpasses the protective capability, unfavorable free radicals and reactive oxygen species may form 16, 34. This enhances the oxygenated products and provides conditions favorable for photodynamic damage of photoreceptors and other retinal tissues 35. However, susceptibility to retinal photochemical injury (RPI) is multifactorial 17, and wavelengths certainly play an important role36. According to Planck’s relation (E = h/λ, where E = energy, h = the Planck constant, and λ = wavelength), a photon corresponding to blue light is more energetic 17 than photons of longer wavelengths, such as green or red light.
Furthermore, blue light has the greatest potential to induce PRI, which has been reconfirmed both by in vitro 37-44 and in vivo studies 45-50.
Blue light could induce the formation of reactive oxygen species (ROS) in RPE mitochondria that leads to retinal apoptosis has been reported by cell culture studies 38, 41, 43, 44, 51-54 and animal models 46, 49, 55, 56. The initial injuries involve a series of processes, including signaling molecules released from outer retinal cells, oxidatively damaged biomolecules 57, dysfunction and death of
iron concentration in the retina 59, 60. The iron regulatory genes that favor increased iron uptake were altered after photic injury. The unbalanced iron may further accelerate oxidative stress in a cycle of cellular self-destruction 61. Moreover, the injury possibly corresponds to a retinal remodeling process following the light injury 62, 63. However, the wavelength-dependent effect and its influences on white LED light-induced retinal degenerations remain unknown.
Some epidemiological studies have suggested that short-wavelength light exposure is a predisposing cause for AMD 16. Animal models have also been used to determine that excessive exposure to blue light is a critical factor in photochemical retinal injury targeting photoreceptors and the retinal pigment epithelium (RPE) 64.
2.3.4 Principal of the domestic lighting exposure
Although there has been a wealth of studies describing the RPI and some of them even discussed the wavelength dependency, the experimental settings were focused on high intensity light exposure over a short period of time (a few seconds to 3 days) for acute or subacute toxicity assessments. The tested animals were anesthetized or forced to stare into the lights in most of the cases, and the light sources varied due to contemporary technology availability.
Therefore, a study focusing on subchronic risk assessment is needed. The animals in the experiments were allowed to move freely in the cage during the exposure. The light sources were critically designed to meet the updated industrial development. The exposure conditions were also created to simulate the domestic lighting environments in the most possible way. To investigate how specific wavelengths in LED domestic lighting were responsible for retinal
3 RESEARCH DESIGN AND METHODS
3.1 Hypotheses of photochemical injury
The ability of light to cause injury to the retina has been shown both clinically and experimentally. It is now well established that prolonged light exposure can lead to photoreceptor cell injury by non-thermal mechanisms. It is also clear that light injury involves a complex series of events which depend upon the duration and intensity of light, its wavelength and the characteristics and distribution of absorbing chromophores within the retina. Although light injury results in visual cell death in a number of animal models, the initial events may differ.
While neurosensory retina and RPE are protected from light-induced exposure by the absorption profile of the surrounding ocular structures, including the cornea, crystalline lens, and macular pigments, as well as the ability of the retinal photoreceptors to regenerate its outer segments, photic injury is still possible. The principles of photomechanical, photothermal, and photochemical injury to the retina provide a framework for understanding and photic injury to the retina. However, this study mainly focuses on the class I photochemical injury (described previously on 2.2.3) to reflect the white light LED as reading light source features.
3.2 Animal handling and light exposure plan 3.2.1 Animals and rearing conditions
3.2.1.1 For the comparison of CFL vs. LED
In total, 120 adult male Sprague–Dawley rats were purchased from BioLasco Taiwan Co., Ltd at 8 weeks of age and stored in a dark environment for 14 days to clear the light exposure effect from their previous rearing environment. Twelve normal rats served as controls without exposure, and the other 108 rats received programmed light exposure, as shown in Figure 19. The groups were randomly allocated during the experiment and/or when assessing the outcome. The animals would be excluded from the analysis if animals were died during the experiments. The temperature of the exposure environment (both the room and individual cages) was maintained at 22-23°C with humidity between 50% and 70%. All animals received food and water ad libitum. The use of rats in this study conformed to the ARVO statement for the Use of Animals in Ophthalmic and Vision Research and Laboratory Animal Resource Committee guidelines at National Taiwan University. This study received the animal use approval (affidavit of approval of animal use protocol #20110568) from National Taiwan University College of Medicine and College of Public Health Institutional Animal Care and Use Committee (IACUC). The animals were treated humanely and with regard to the alleviation of suffering.
Figure 19 Timeframe of the experimental design
ROS: Reactive oxygen species. ERG: Electroretinography. H&E: hematoxylin and eosin staining.
TEM: Transmission electron microscopy. IHC: Immunohistochemistry. TUNEL: Terminal deoxynucleotidyl transferase dUTP nick end labeling stain.
ERG ROS
ERG H&E
ERG H&E ERG
ROS H&E TEM IHC TUNEL
3 days
14 days in darkness 14 days
in darkness Darkness
Stage
Recovery Stage
28 days in cyclic light 12h dark/ 12h light
Light Exposure
Stage
9 days
1 2 3 4 5 6 7 8 9 10 11 12 13 14 15 16 17 18 19 20 21 22 23 24 25 26 27 28
28 + 14 days 28 days
n = 3 in each group n = 8 in each group n = 8 in each group n = 8 in each group