國立台灣大學生命科學院生態學與演化生物學研究所 博士論文
Institute of Ecology and Evolutionary Biology College of Life Science
National Taiwan University Doctoral Dissertation
東亞特有種苦苣苔親緣地理、花發育及花對稱性基因自然選汰
Phylogeography, flower development and selection on floral symmetry gene in East Asia endemic Conandron ramondioides
辛冠霆 Kuan-Ting Hsin
指導教授:王俊能 博士
Advisor:Chun-Neng Wang, Ph.D.
中華民國 108 年 7 月 July 2019
致謝
本論文的完成首先要感謝指導老師-王俊能老師。感謝老師提供完善的實驗空間與研究的指 導。讓我能逐步拼湊出苦苣苔的研究故事。感謝口試委員黃士穎老師、廖培鈞老師、謝宗欣 老師與江友中老師,撥冗審閱論文,並提供許多寶貴的建議。
特別感謝英國愛丁堡植物園 Dr. Michael Möller,在研究期間大力幫忙與許多的討論。在獲取 研究材料方面,感謝日本 國立科學博物館 Dr. Goro Kokubugata 提供日本的樣本以及福建職 業林學院 何國生教授與福建將樂隴西山保護區
科員 董小譽先生協助採集中國樣本。 感謝靜宜大學 楊國禎老師提供台灣分布苦苣苔族群資 訊。實驗工作能順利進行感謝黃玲瓏老師、陳香君老師、胡哲明老師、郭浩志博士、潘昭君 博士、黃雅倫博士、蔡孟穎博士、曾妤馨博士、洪麗分博士、郭立園博士、黃秉宏、張仁 育、張詠嬋、徐卉汝、馬弘文、洪育翎、楊承瑞。 尤其感謝郭浩志博士,他對於苦苣苔親緣 地理研究提供了精闢見解與意見,使得該研究能順利完成。
感謝實驗室歷屆的成員,在生活與實驗的幫助。Dr. Kanae Nishii、吳俊賢學長、呂易璁學 長、黃秉宏、張仁育、張詠嬋、洪子桓、徐卉汝、馬弘文、洪育翎、馬弘文。感謝各位,因 為有你們讓我的博士研讀生涯更多采多姿。
最終,感謝我的太太與父母,給予我無限的包容與支持。
摘要
研究歷史事件如何影響現今物種分布模式與分子調控機制如何控制發育過程是生物學上重要 的研究議題。在本論文中,苦苣苔(Conandron ramondioides) 被用來研究這兩個議題。理由 有三。第一,自第四紀以來,東中國海海床曾因冰期循環造成海平面下降形成陸橋而多次連 結亞洲陸塊與鄰近島嶼。現今零散且間斷分布的苦苣苔族群(包含日本、東南中國、台灣與西 表島)是否曾經透過東中國海陸橋傳播是第一個研究目標。第二,花對稱性基因在兩側對稱花 侷限表現於背側。花對稱性基因在輻射對稱花的苦苣苔花部表現是否有所改變為第二個研究 議題。第三,多條花對稱性調控基因(GCYCs)在同屬於 Asiatic Trichosporeae 族的苦苣苔與兩 側對稱花物種(如角桐草、石吊蘭)中被分離。Asiatic Trichosporeae 族物種保留多條花對稱性 調控基因的可能機制與多樣的花對稱性調控基因表現模式的關連是第三個研究議題。
重建多基因座親緣樹顯示現今零散且間斷分布的苦苣苔族群形成三個與地理區域相符合的分 群,分別為本州-四國群、東南中國群與台灣-西表島群。三群間並沒有群間共享單套型且各 群間缺乏基因交流顯示即使東中國海陸橋有多次連結亞洲陸塊與鄰近島嶼,苦苣苔族群仍無 法跨越東中國海陸橋進行基因交流。結果顯示東中國海陸橋對苦苣苔是無法跨越的障礙(過濾 屏障)。第二,檢視苦苣苔花部發育過程發現苦苣苔的雄蕊輪與花瓣輪自花原基分化後維持等 速生長直到開花且花對稱性調控基因(GCYCs)不表現於苦苣苔的雄蕊輪與花瓣輪。因此推論 苦苣苔發育為輻射對稱花是透過失去花對稱性調控基因在背側表現而達成。第三,由重建的 Asiatic Trichosporeae GCYCs 親緣樹發現 GCYCs 基因形成 GCYC1C 與 GCYC1D 兩群。分析 天擇訊號(ω)在重複事件發生前後的改變,結果顯示 ω 由重複事件發生前的 0.2819 上升至發 生後的 0.3985,呈現由遺傳限制釋放的訊號(relaxation)。由於 Asiatic Trichosporeae 族中兩側 對稱花或是輻射對稱花物種的 GCYCs 基因都呈現多樣的表現模式。我們推論在 Asiatic Trichosporeae 族中 GCYCs 重複事件發生後的 GCYC1C 與 GCYC1D 拷貝由遺傳限制釋放創造
了 ” 演化的彈性窗戶(evolutionary window of flexibility)” 使得多條 GCYC1C 與 GCYC1D 拷貝 能被保留且各自獲得在花部多樣的基因表現。
關鍵字: 苦苣苔、傳播廊道、過濾屏障、花對稱性、反轉、突變種、GCYC、重複事件、遺傳 限制釋放
Abstract
Studying how historical events shaping current species distribution pattern and molecular regulatory mechanism in controlling developmental process are important issues in biology. In this dissertation, Conandron ramondioides was used to study these two issues. The reasons are 1. East China Sea (ECS) seafloor connected Asia continent and adjacent islands repeatedly due to sea level lowering during glacial period since Quaternary. First, whether current scatter and disjunct distributed C.
ramondioides populations (distributed in Honshu, Shikoku, Kyushu, Southeast China, Taiwan and Iriomote) disperse through ECS landbridge in the past? Second, floral symmetry determining gene expressed in dorsal region in zygomorphic flower species. Whether floral symmetry determining genes alter their expression pattern in C. ramondioides, which have actinomorphic flower? Third, multiple floral symmetry determining genes (GCYCs) were isolated from Asiatic Trichosporeae species, including actinomorphic flower species (e.g. C. ramondioides) and zygomorphic flower species (e.g. Hemiboea bicornuta and Lysionotus pauciflorus). To trace what kind of selection force in maintaining multiple GCYCs and find association between divergent expression pattern of
duplicated GCYCs in both actinomorphic and zygomorphic flower species in Asiatic Trichosporeae species are the third research aim in this dissertation.
First, reconstructed multiloci phylogeny showed that current scatter and disjunct distributed C.
ramondioides populations form three geographical corresponding groups, including Honshu-
Shikoku, Southeast China and Taiwan-Iriomote group. Lack of shared haplotypes and restricted gene flow among groups suggested migration of C. ramondioides populations through ECS landbridge is unlikely. My results suggested ECS landbridge serves as filter instead of dispersal corridor for C.
ramondioides populations. Second, RT-PCR results showed there is no GCYCs expression in flower in C. ramondioides. Thus, loss of dorsal region specific floral symmetry determining genes (GCYCs)
IV
expression in C. ramondioides has evolved to switch zygomorphy to actinomorphy. Third, GCYCs isolated from Asiatic Trichosporeae species with divergent expression pattern in flower formed GCYC1 clade, comprising GCYC1C subclade and GCYC1D subclade. Relaxation from selection right after the GCYC1 duplication (ω pre-duplication = 0.2819, ω post-duplication = 0.3985) was detected among GCYC1C and GCYC1D. Expression pattern of GCYC genes of selected
zygomorphic flower species (Hemiboea bicornuta and Lysionotus pauciflorus) exhibits dorsal restricted and copy specific pattern (GCYC1C for H. bicornuta and GCYC1D for L. pauciflorus).
Together with previously published data, it appeared that GCYC1C and GCYC1D copies diversified their expression in a distinct species-specific pattern. I propose that the selection relaxation after the GCYC1 duplication created an "evolutionary window of flexibility" in which multiple copies were retained with randomly diverged roles for dorsal-specific expressions in association with floral symmetry changes.
Key words: Conandron ramondioides, dispersal corridor, filter, floral symmetry, reversal, peloria, GCYC, duplication, relaxation.
VI
Content
摘要... I Abstract ... III List of Figures ...VII List of Tables ... IX
Chapter 1 General introduction ... 1
1.1 Discovery and taxonomic treatment of Conandron ramondioides ... 2
1.2 Population biology and geographic distribution ... 2
1.3 Reversal to actinomorphy of Conandron in Gesneriaceae ... 3
1.4 GCYC gene evolution in Gesneriaceae ... 5
1.5 Objectives of this study ... 6
Chapter 2 East China Sea continental shelf served as a filter in shaping lineage divergence of East Asia relic understory herb: inference from multi-loci phylogeography and ecological niche modeling of Conandron ramondioides (Gesneriaceae) ... 7
Abstract ... 8
Introduction ... 10
Material and methods ... 13
Results ... 22
Discussion ... 31
Supporting information ... 51
Chapter 3 Expression shifts of floral symmetry genes correlate to flower actinomorphy in East Asia endemic Conandron ramondioides (Gesneriaceae) ... 60
Abstract ... 61
Introduction ... 62
VI
Material and methods ... 66
Results ... 70
Discussion ... 73
Supporting files ... 84
Chapter 4 Gene duplication and relaxation from selective constraints of GCYC genes correlated with various floral symmetry patterns in Asiatic Gesneriaceae tribe Trichosporeae ... 87
Abstract ... 88
Introduction ... 89
Materials and Methods ... 95
Results ... 102
Discussion ... 106
Supporting files ... 125
Chapter 5 General discussion, future work ... 139
Reference ... 145
VII
List of Figures
Fig. 2-1 Map showing sample locations of C. ramondioides. ... 39 Fig. 2-2 Statistical parsimony network of the 6 loci haplotypes of C. ramondioides from
Honshu, Shikoku, Taiwan, Iriomote and Southeast-China. ... 40 Fig. 2-3 Phylogeny of sampled C. ramondioides populations reconstructed by *BEAST2... 41 Fig. 2-4 Lineage divergent time inferred from multi population IMa2 analysis within C.
ramondioies... 42 Fig. 2-5 Population divergence within C. ramondioies inferred from pairwise IMa2 analysis. .. 43 Fig. 2-6 The effective population size change over time of C. ramondioides groups. ... 44 Fig. 2-7 Modeled climatically suitable areas of Conandron groups in East Asia during Last Glacial Maximum and present. ... 45 Fig. 3-1 The flower of C. ramondioides from early to late stage. ... 77 Fig. 3-2 The SEM photos of morphological development process of Conandron ramondioides flowers... 78 Fig. 3-3 Alignments of protein sequences of CrCYC, CrRAD and CrDIV genes with homologs from Antirrhinum majus (CYC, RAD and DIV) and Bournea leiophylla (BlCYC1, BlCYC2, BlRAD, BlDIV1 and BlDIV2). ... 79 Fig. 3-4 Neighbour‑joining trees of CYC‑like, RAD‑like and DIV‑like genes. ... 81 Fig. 3-5 Gene‑specific reverse transcriptase polymerase chain reaction (RT‑PCR) analysis of CrCYC, CrRAD and CrDIV genes from C. ramondioides buds and dissected flower tissues. ... 83 Fig. 4-1 Flower morphology and developmental stages of Conandron ramondioides, Hemiboea bicornuta, and Lysionotus pauciflorus. ... 115 Fig. 4-2 Branch models used in PAML analyses. ... 116
VIII
Fig. 4-3 Genealogy and duplication events of GCYC in Gesneriaceae. ... 118 Fig. 4-4 Expression pattern of GCYC in floral parts of Conandron ramondioides, Hemiboea bicornuta, and Lysionotus pauciflorus. ... 119 Fig. 4-5 GCYC1 phylogenetic tree with summarized GCYC1C and GCYC1D expression pattern in tribe Trichosporeae species. ... 120 Fig. 4-6 Reconstructed ECE-CYC2 evolution emphasizing shifts of GCYC expression pattern after gene duplication in correlation to floral symmetry transitions among selected Asiatic Trichosporeae species. ... 121 Fig. 5-1 Corolla lobe-length and tube-length plot of investigated Conandron individuals. ... 144
IX
List of Tables
Table 2-1. Collection sites, haplotype number (No. seq), haplotype diversity (Hd), nucleotide diversity (π), haplotype distribution and neutrality tests of the 21 Conandron populations
sampled in East Asia. ... 46 Table 2-2. Pairwise FST estimates from 3 loci among Conandron groups ... 48 Table 2-3. Hierarchical analysis of molecular variance (AMOVA) of Conandron obtained from sequences of three loci respectively. ... 49 Table 2-4. McDonald-Kreitman tests of CrCYC1C haplotypes by using three Gesneriaceae species as outgroups. ... 50 Table 2-5. Neutrality tests of 4 molecular markers estimated from China populations. ... 50 Table 4-1 Parameter estimates under branch and branch-site models of GCYC1C and GCYC1D in tribe Trichosporeae. ... 123
Chapter 1
General introduction
1.1 Discovery and taxonomic treatment of Conandron ramondioides
Conandron ramondioides (Gesneriaceae) belongs to monotypic genus Conandron Siebold &
Zuccarini, which is endemic in East Asia. Conandron ramondioides was first described by Siebold and Zuccarini in 1843 based on a specimen from “Japan proper”. They named this species as Conandron ramondioides because of its flower similar to Ramondia (now is Ramonda) and possessing a cone-shaped anther (Siebold & Zuccarini, 1843). Later on,
Masamune distinguished Taiwanese specimen from those in Japan due to leaf variations in 1939 and named as C. ramondioides var. taiwanensis (Masamune, 1939). In addition, Masamune also suggested plants from Iriomote should be named as var. ryukuensis (Masamune, 1939). Since then, treatment of var. taiwanensis and var. ryukuensis was at debate among botanists until Kokubugata and Peng (2004). Kokubugata and Peng (2004) found the lobe-length to tube-length ratio measuring from specimen formed geographical corresponding groups. One is Japan proper group, the other is Taiwan-Iriomote group. According to their finding, they treated Conandron from Japan proper and Taiwan (with plants from Iriomote) into two varieties, var. ramondioides (distributed in Japan proper) and var. taiwanensis (distributed in Taiwan and Iriomote)
(Kokubugata and Peng, 2004). Plants distributed in Southeast China (distributed in Fujien, Anhui and Zhejiang province) were described by Wang et al. in 1998 and named as Conandron
ramondioides. However, Kokubugata and Peng (2004) attributed Southeast China distributed Conandron ramondioides to var. taiwanensis due to description of their lobe-length to tube- length ratio close to that measuring from Taiwan and Iriomote specimen. After Kokubugata and Peng (2004), the relationship of infraspecific taxa of Conandron at molecular level remains unknown for almost two decades.
1.2 Population biology and geographic distribution
Conandron grows in dense shaded habit along creeks, on moisture cliffs under remote primitive forest at low to middle elevation. Populations observed in the field are isolated, scattered and of
small size on the moisture rocks. This might be because of the strict habitat requirement of moisture and cold of this species.
Flowering season of Conandron starts at April and ends at July. Seeds are dispersed through water streams after capsule dehiscing, restricting the long distance dispersal of seeds (Xiao et al., 2011). In addition, major pollinator of Conandron is bumble bee (Ma, 2017), whose foraging distance is restricted (ca. 267 meter) (Wolf & Mortiz, 2008). Restricted foraging distance of bumble bee suggests limited pollen dispersal distance of Conandron. To sum up, dispersal ability of Conandron either through pollen or seed is restricted.
Considering its biological features (herb, surviving understory in remote forest, limited seed and pollen dispersal ability and strict habitat requirement), distribution of Conandron should be limited in East Asia. However, specimen records indicated Conandron distributes in Japan (including Honshu, Shikoku and Kyushu), Southeast China (Fujien, Anhui and Zhejiang province), Taiwan and Southern Ryukyu (Iriomote), exhibiting “broad and disjunct distribution pattern” in East Asia, apparently against “limited distribution in East Asia” expectation. Thus, it will be interesting to figure out what historical mechanism (or event) in shaping distribution pattern of Conandron nowadays.
1.3 Reversal to actinomorphy of Conandron in Gesneriaceae
Conandron exhibits actinomorphic flower at anthesis in Gesneriaceae. This character (actinomorphic flower) making taxonomist assigned Conandron and other actinomorphic flower species (e.g. Ramonda, Tengia and Bournea) into tribe Ramondeae (Wang et al., 1992) in zygomorphic flower dominant Gesneriaceae, and considered this tribe also to be the most primitive in subfamily Cyrtandroideae (now Didymocarpoideae, see [Weber et al., 2013]), therefore, regarding actinomorphic taxa to represent a single ancestral lineage in Gesneriaceae.
Burtt (1970), based on the predominance of zygomorphic species and the scattered distribution of actinomorphic species in the taxonomic system, stated that taxa with actinomorphic flowers were probably reversal from the zygomorphic state and could not be regarded as ancestral. This was supported by molecular phylogenetic studies that indicated the family has a high number of species with reversals to actinomorphy (Smith et al., 2004; Moeller et al., 2009; Moeller et al., 2011; Wang et al., 2010).
In angiosperm, establishment of zygomorphic flower is through regulation of CYCLOIDEA (CYC) and its homologues. Function of CYC is first revealed from Antirrhinum majus studies (Luo et al., 1999; Corley et al., 2005). Establishment of zygomorphy of A. majus is due to dorsal region restricted CYC expression in flower (Luo et al., 1999). Zygomorphy was lost in A.
majus, when CYC gene was mutated (Luo et al., 1999; Corley et al., 2005). In Gesneriaceae, CYC homologues, GCYC, showed dorsal region restricted pattern in zygomorphic flower species (Du and Wang, 2008; Gao et al., 2008; Song et al., 2009). Dorsal region restricted GCYC expression pattern in Gesneriaceae suggests conserved role of CYC regulation pathway in establishment of zygomorphy. If so, the establishment of actinomorphy in Gesneriaceae may be due to loss of dorsal region specific GCYC expression in flower tissue, like A. majus mutant.
However, previous studies suggested at least two types of GCYC expression change in association with establishment of actinomorphic flower in Gesneriaceae (Pang et al., 2010;
Zhou et al., 2008). One is through expansion of GCYC expression in whole flower, like whole flower expressed TsCYC1C and TsCYC1D in Tengia (Pang et al., 2010). The second type is through transiently expressed GCYC gene in flower, such as transiently dorsal region expressed BlCYC1 in Bournea (Zhou et al., 2008). Phylogeny showed that Tengia, Bournea and
Conandron evolved independently in tribe Trichosporeae. Whether establishment of
actinomorphic flower of Conandron similar to expression pattern in Tengia or Bournea or third type of expression pattern is worth for studying.
1.4 GCYC gene evolution in Gesneriaceae
Multiple reversal to actinomorphy events were identified in zygomorphy predominant
Gesneriaceae (Smith et al., 2006; Wang et al., 2010). In these reversal to actinomorphy species, diverse GCYC gene expression patterns were identified. For example, GCYC genes were not expressed in floral tissue in Conandron, but GCYC genes expressed in whole floral tissue in Tengia. In addition, diverse GCYC expression pattern can also be detected in zygomorphic flower speces, like Opithandra dinghushanensis. In O. dinghushanensis, four GCYC genes were isolated. These four GCYC genes exhibited diverse expression pattern in flower tissue.
OpdCYC1C expressed in whole flower, OpdCYC1D expressed in dorsal region, OpdCYC2A expressed in dorsal petal and dorsal staminode, while OpdCYC2B were not expressed in floral tissue in O. dinghushanensis (Song et al., 2009). To conclude, both zygomorphic and
actinomorphic flower species displayed diverse GCYC expression pattern and possessed multiple GCYC genes in Gesneriaceae. However, mechanism in maintaining multiple GCYC genes and association with diverse GCYC genes expression pattern is not clear yet.
One study tend to explain mechanism in maintaining multiple GCYC copies through statistic method, like Paml. In Smith et al. (2006), they aimed to examine selection acting on duplicated Coronanthereae GCYC genes from actinomorphic flower species. Coronanthereae is a New world distributed tribe. To achieve their goal, they assigned duplicated Coronanthereae GCYC genes from actinomorphic flower species as foreground and the rest as background in their alternative model. Lack of statistic support after comparing alternative and null model (null model assumes equal ω for all branches in the phylogeny) makes the conclusion ambiguous.
They concluded that either GCYC genes loss of function at DNA level or relaxed selection of GCYC genes of actinomorphic flower species in Coronanthereae (Smith et al., 2006). Since then, most studies focus on association between GCYC gene expression and floral symmetry
establishment in Gesneriaceae (Du and Wang, 2008; Pang et al., 2010; Song et al., 2009; Yang et al., 2015; Zhou et al., 2008), ignoring mechanism in association with multiple GCYC genes and diverse GCYC expression pattern.
I try to know what is the possible selection in association with multiple GCYC genes and diverse GCYC expression in Gesneriaceae, especially in tribe Trichosporeae. Trichosporeae possess five reversal to actinomorphy species, including Bournea, Conandron, Tengia, Thamnocharis and Ramonda. Studying selection in maintaining multiple GCYC genes and association with diverse GCYC expression pattern in Trichsporeae is beneficial. The first reason is the known expression pattern and GCYC genes were studied in this tribe. The second reason is this tribe possess most reversal to actinomorphy events in Gesneriaceae. The third reason is availability of materials. Mapping GCYC expression pattern obtained from actinomorphic and zygomorphic flower species on Trichosporeae phylogeny and analyzing selection pressure change before- and after- duplication of GCYC genes may help to achieve my goal.
1.5 Objectives of this study
Therefore the main goals of this thesis are:
1. Reconstruct evolutionary history of disjunct distributed Conandron populations and suggest the possible historical mechanism in association with this distribution pattern.
2. Uncover the developmental process of actinomorphic flower establishment in Conandron and its relation to flower symmetry regulatory gene GCYC expression pattern.
3. Reconstruct GCYC phylogeny to identify duplication events and evaluate selection pressure of Trichosporeae GCYC genes in relation to multiple reversal to actinomorphic flower events.
Chapter 2
East China Sea continental shelf served as a filter in shaping lineage divergence
of East Asia relic understory herb: inference from multi-loci phylogeography and
ecological niche modeling of Conandron ramondioides (Gesneriaceae)
Abstract
East China Sea (ECS) has been proposed an important landbridge during the Quatarnary at the glacial maximum that facilitate the migration of temperate plant species between Chinese mainland and islands including Japan, Ryukyu islands and Taiwan. A contrasting view suggests that ECS lanbridge may serve as a filter to promote diversification which prevent dispersal of certain species but allowed pre-adapted species to cross the landbrige. Here, we investigated whether ECS acts as dispersal corridor or filter for the disjunct distributions of Conandron ramondioides in Southeast China, Japan, Taiwan and Iriomote island (southern Ryukyu) by reconstructing the evolutionary and population demography history of these populations. 5 nuclear (ITS, 4 low copy markers: CrCYC1, AGT intron1, GroES intron 1 and LFY intron 1) and 2 chloroplast markers (trnh-psbA, trnL-F)were obtained from 21 populations covering the entire distribution of C. ramondioides to explore genetic diversity, structure and population differentiation on these segregation sides of ECS. Time-calibrated multiloci phylogeny were used to infer the historical process of the lineage diversification. A
coalescent-based isolation-with-migration (IM) model was used to estimate population demographic parameters among diversified Conandron lineages. Also, population size change through time of Conandron lineages were reconstructed by Extended Bayesian Skyline Plots (EBSP) to evaluate effect of climatic change on size of Conandron populations in the past. Potential habitat ranges on ECS landbridge of Conandron lineages were modeled by using ecological niche modeling (ENM) which serve as evidence for any Conandron lineages migrating through ECS landbridge. We found nuclear marker CYCLOIDEA (CrCYC1) apparently deviated from neutral evolution based on McDonald-Kreitman test and ITS apparently evolved non-concerted because different copies remained, so they were not analyzed further. In addition, significant Tajima’D and Fu’s Fs results suggest cpDNA obtained from Southeast China populations deviate from neutral evolution. Thus, the cpDNA was not analyzed further. Two diversification events were identified from our Multilocus phylogeny revealed that the Japan main proper populations diverged first from other populations
relatively ancient at 1.14 MYA (95%HPD: 0.82-3.86), following a recently further divergence separated Taiwan and Southern Ryukyu from Chinese populations at around 0.75 MYA (95%HPD:
0.45-1.3). The multi population and pairwise IM analysis showed that the gene flow among these lineages were restricted since their diversification. Moreover, population dynamics of these Conandron lineages reconstructed by EBSP showed there were no evident post divergence population growth as revealed by their constant population size or mildly increasing trends since their divergence. ENM modeling at glacial maximum indicated the potential habitats of Japan main proper population extended across the ECS landbridge, while that of Chinese populations were restricted, but their ranges were never overlaped. This suggests disjunct populations of Conandron were less likely to meet each other after their divergence during the LGM, suggesting ECS acts as a filter for their dispersal. This can also be revealed by the poor seed dispersal ability of Conandron for example the lacking of long hair for wind dispersal as that in other Trichosporeae species it belongs to in Gesneriaceae).
Key words: East China Sea, landbridge, filter, dispersal corridor, gene flow, low copy nuclear marker, Conandron
Introduction
The high temperate plant diversity and endemism of East Asia has been attributed to the influence of repeated glacial and interglacial cycles since Quaternary (Harrison et al., 2001; Manchester et al., 2009; Wu and Wu, 1996). Unlike north Europe and north American, no extensive glaciations occurred in East Asia since Quaternary (Zheng et al., 2003; Shi, 2006), which may allow long-term persistence and diversification of temperate plant species in East Asia. For now, the temperate plant species distributed in middle evevation of mainland China (in central, east and south China), Korea Peninsula, main Japan islands, and middle elevation of Taiwan, forming scatter distribution pattern around East China Sea (ECS) (Wu and Wu, 1996). Based on sediments data, current isolated Asia continent and adjacnt islands were repeated connected to and separated from each other several times during glacial and inter-glacial period respectively since Quaternary (Ota, 1998).
In East Asia, East China Sea (ECS) land bridge served as potential corridor during the last glacial maximum (LGM) for plants to migrate between East China, Japan, Okinawa and Taiwan islands.
ECS is not very deep as about three quarter of the sea is below an average of 200 meter deep thus it emerged as continental shelves to connect these islands to Chinese mainland during Late Coenozoic glaciation cycles (Sun & Liu, 2000; Harrison et al. 2001). According to reconstructed paleo-
vegetation map, temperate forests extended across the ECS land bridge to connect populations in East China, Korea and Japan. On the other hand, this continental shelf also extend to Taiwan and south Okinawa (Ryukyu archipelago) because the sea level along the land bridges in connecting them is even shallower in less than 60 meter depth (Ota 1998).
Therefore, unlike the present day isolated islands and East Asia continent, during glacial periods, lower sea level may connect not only East China and Japan, but also link Taiwan and south Okinawa into a giant continuous temperate forest belt. We thus would like to investigate the impact of glacial
cycles on isolation and reconnection of East Asia islands have diverged species currently disjunct in these species in full segregation or still maintained certain levels of post-divergence gene flow.
However, accumulating studies suggested ECS landbridge may serve as filter in selectively preventing or facilitating the migration of certain plant species (Cox and Moore, 2007). That is probabily due to East Asia habouring diverse niche (diverse vegetation zones and complex microhabitat-rich topography) which allowing species to adapt to their local environments. Once local adaptation occurrred, only species can endure palaeo-climate on ECS landbridge can migrate through ECS landbridge.
The inference of ECS landbridge serving as filter comes from studies of several understory herb, shrub or epiphyte of temperate forest (e.g. Platycrater arguta, Kirengeshoma palmata, Dendrobium moniliforme, Ligularia hodgsonii). Summarizing from studies, populations possessed mainland and adjacent island unique haplotypes across ECS landbridge, lack of post divergence gene flow and restricted potential suitable habitat in mainland and adjacent islands are evidence for "filter"
hypothesis (Qi et al., 2014; Qiu et al., 2009; Wang et al., 2013; Ye et al., 2017). In contrast, studies of template trees, like Quercus vairabilis, Cercidiphyllum japonicum and Kalopanax septemlobus, exhibiting lack of genetic breaks between mainland and adjacent island populations (Chen et al., 2012; Qi et al., 2012; Sakaguchi et al., 2012). From previous studies, genetic admmixture found between mainland and adjacent island populations and broad potential suitable habitat on ECS landbridge are regarded as support of dispersal corridor hypothesis. Whether shared haplotypes, gene flow observed between mainland and adjacent island and range of potential suitable habitat on ECS landbridge are three critical indicators to distinguish between dispersal corridor and filter hypothesis.
Conandron ramondioides, an East Asia relic temperate understorey herb with disjunct distributions in East China, Taiwan, southern Okinawa (var. taiwanensis), Japan (var. ramondioides). Conandron survives in the moisture environment in the remote primitive forest in East Asia (Xiao & Wang,
2007). Unlike Lysionotus pauciflorus, a Gesneriaceae species distributed in major landmass in East Asia (Japan, Taiwan and southeast China) similar to Conandron, whose seeds has hair-like
appendage allowing long distance dispersal across sea in East Asia (Kokubugata et al., 2011), seeds of Conandron lacking such hair-like appendage making oversea dispersal of Conandron is unlikely.
In fact, Conandron is been regarded as a low dispersal ability species due to its seeds mainly disperse by stream after capsule dehiscing (Xiao et al., 2011). These two biological features may hint oversea disperse of Conandron is unlikely. Considering its biological features, like short generation time, seeds lack of hair-like appendage, sensitive to environmental change, we assumed that exposed ECS continental shelf during glacial period could probably serve as “filter” shaping evolutionary history of Conandron populations in East Asia.
We applied an integrative approach by using phylogeographic and modeling potential suitable habitat range to verify whether ECS landbridge servering as “filter” of Conandron or not. Our specific aims were to (i) reveal genetic relationships of disjunct distributed in mainland and adjacent island Conandron populations, approximate divergence time and gene flow among identified
lineages; (ii) estimate effective population size chang through time of identified lineages of Conandron; and (iii) simulate potential suitable habitat range of Conandron at present and during Last Glacial maximum (LGM).
Material and methods
Sample collection and genomic DNA extraction
We sampled nine populations of var. ramondioides and twelve populations of var. taiwanensis (197 individuals in total) almost covering its distribution range in East Asia (Figure 2-1). The detailed sample codes and collection localities are listed in (Table 2-1). Leaf samples collected in the field and dried in silica gel then grid into powder by homogenizer. DNA extraction following CTAB procedure (Doyle & Doyle, 1987). The DNA concentration was determined for each sample using the Nanodrop RNA/DNA Calculator (Thermo, Taipei, Taiwan).
Amplification of cpDNA markers, CrCYC1 and ITS
To evaluate divergence process of C. ramondioides populations across East Asia, two cpDNA markers (including trnL-F and trnH-psbA) and two nuclear markers (including CrCYC1 and ITS), were amplified from all collected individuals by Sanger sequencing. The primer pairs used for amplifying trnL-trnF region was based on Taberlet et al.(1991), and the forward primer forward
‘trnH’ (CGC GCA TGG TGG ATT CAC AAT CC) and reverse primer ‘psbA’ (GTTATGCATGAA CGT AAT GCT C) were used to amply the trnH-psbA region (Tate and Simpson, 2003). The PCR reaction was made up to total volume 25 μl, containing 13μl of 2x Ampliqon master mix Red (Ampliqon, Denmark), 0.25μl each primer at 2μM, 10.5μl ddH2O and 1μl template at 20 ng/μl. The PCR profile for cpDNA markers amplification was 35 cycles of 30s at 94℃, 30 s at 56℃, and 1min at 72℃ with final extension for 5 minutes at 72℃, after an initial denaturing for 3 min at 94℃ for both trnL-trnF, and trnH-psbA. For nuclear markers, CrCYC1 sequences were amplified using forward primer ‘SPF’ (5'-AGCAAGACATGCTTTCTG G-3') and reverse primer ‘SPR’ (5'-
GACATTGGATTCAATATGGTG-3') (Xiao and Wang, 2007), while the forward primer ‘ITS 5P’
(5’-GGA AGG AGA AGT CGT AAC AAG G-3’) and reverse primer ‘ITS 8P’ (5’-CAC GCT TCT CCA GAC TAC A-3’), were used for amplifying ITS region (Möller and Cronk, 1997). The PCR
profile was 35 cycles of 30s at 94℃, 30 s at 58℃, and 50s at 72℃ with final extension for 10
minutes at 72℃, after an initial denaturing for 3 min at 94℃ for CrCYC1 and ITS amplification. The PCR reaction was made up to total volume 25 μl, containing 13μl of 2x Ampliqon master mix Red (Ampliqon, Denmark), 0.25μl each primer at 2μM, 10.5μl ddH2O and 1μl template at 20 ng/μl. All PCR products were examined by 1.0% (w/v) agarose gel electrophoresis and then the band with right size was sent for sequencing. The PCR products were then sequenced by ABI 3700 automatic sequencer. All sequences were examined by Sequence Scanner v1.0 first and then aligned for further analysis. To examine within individual homogeneity of ITS, we amplified nine individuals (three from Japan, three from Southeast China and three from Taiwan) using ITS primer pairs with proofreading KAPA HiFi PCR kit (Massachusetts, USA). Cloning procedure of these nine PCR products was carried out using pGEM-T Easy Vector kit (Promega, USA), following the
manufacturer’s protocols. Finally, five to six clones of each PCR product were sequenced.
Reconstruct haplotypes of CrCYC1 and ITS
Aligned CrCYC1 and ITS sequences were trimmed and the chromatograms of these two loci
inspected by eye for double peaks, indicative of heterozygous sites. To reconstruct haplotypes from CrCYC1 and ITS sequences with multiple heterozygous sites, we used the Bayesian statistical method in PHASE 2.1.1 (Stephens et al. 2001; Stephens & Scheet 2005) for this purpose. PHASE was applied to reconstruct haplotypes from Japan, Taiwan-Iriomote and South-east China sequences respectively, using models that allow intragenic recombination. The analysis was performed
with10000 iterations (10 iterations per sample) following a burn-in of 1000 iterations. Haplotypes inferred by PHASE with a posterior probability of ≥0.6 were accepted (see Garrick et al. 2010).
Single copy nuclear intron marker selection and amplification
To reconstruct phylogeny of closely related taxa or intra species level, single copy nuclear intron
markers are more preferable than commonly used non coding cpDNA marker due to their high genetic variability (Krak et al., 2012). Therefore, to resolve phylogeny and infer population
divergence process of C. ramondioides, we developed specific single copy nuclear intron markers for C. ramondioides in this study. First, three (including AGT intron 1, GroES intron 1 and LFY intron 1) out of eleven potential single copy markers were chosen for amplicon library preparation due to these three markers generating single band on gel electrophoresis. Next, amplicon library preparation of these three loci was conducted following the 16S metagenomic sequencing library preparation guide which is provided by Illumina technology (San Diego, California, USA). Then, amplicon library were sequenced on the Illumina MiSeq sequencing system. Paired-end Illumina reads (2× 300 bp) were imported into CLC Bio Genomics workbench 7.0.4 (QIAGEN Bioinformatics) and then merged to get overlapping pairs. Finally, only reads with over 100 counts were kept for further analysis.
Genetic structure of populations and geographical structure analysis
Sequence of all six (including AGT intron 1, GroES intron 1 and LFY intron 1, CrCYC1, ITS and concatenated cpDNA) markers were aligned with MUSCLE algorithm (Edgar, 2004) implementing in MEGA 6 (Tamura et al., 2013) and manually edited using BioEdit v. 7.2.5 (Hall, 1999). For each marker, we estimated nucleotide diversity (π) and haplotype diversity (Hd) were calculated using DnaSP vers. 5.0 (Librado & Rozas, 2009) for each population, for each region and for whole dataset. When estimating genetic diversity of populations locating at both side across ECS, we assigned Honshu and Shikoku populations as “North group”, while Taiwan, Iriomote and SE-China populations as “South group” (see Table 2-1).
East China Sea is thought to be a barrier to gene flow for shrub or herbs (Qi et al., 2014; Wang et al., 2013; Ye et al., 2017), thus Conandron populations distributed in Main Japan (Honshu and Shikoku), Taiwan and south-east China were classified into geographical corresponding groups for examining
genetic structure. Iriomote populations were assigned to Taiwan group for its close geographical distance to Taiwan. Analysis of molecular variance (AMOVA) of our genetic data was performed using program Arlequin ver 3.5 (Excoffier & Lischer, 2010). F-statistics were calculated to estimate the proportion of genetic variability found among populations (Fst), among population within groups (Fsc) and among groups (Fct) of our datasets. If ECS served as a barrier, we expected highest
genetic variation should be attributed to among group level. The significance level of all estimated fixation indices was tested with 10000 permutations (Excoffier et al., 1992).
To reconstruct the relationship among haplotypes, for each marker (including AGT intron 1, GroES intron 1 and LFY intron 1, CrCYC1, ITS and concatenated cpDNA), we constructed statistical parsimony network with 95% connection limit using R package “Haplotypes”. Indels were coded using simple indel coding method, which treated indels with different start and/or end positions are separate characters (Simmons and Ochoterona, 2000).
Infer lineage divergence of C. ramodioides populations from nuclear markers
To reconstruct divergence order of Conandron populations from our three nuclear loci, we integrate all genetic information into a locus partitioned *BEAST mutli-locus species tree analysis
implemented in the BEAST v2.4.7 software platform (Bouckaert et al., 2014; Heled & Drummond, 2009). Each sequence was assigned into group by collection site and each collection site was used as an operational taxonomic unit (OTU) in all species tree analyses. Substitution model of each locus was determined in Jmodeltest v2.1.3 (Posada, 2008) and we set HKY model for LFY and GroES1 dataset, HKY+G for AGT intron 1 dataset. Due to low rate variation expected among lineages at intraspecific level, strict clock model was applied for all three loci (Brown & Yang, 2011). For clock rate prior, we set a mean and initial value of 0.0037 per substitutions/site/million year and a standard deviation of 2.55 (95% interquartile range of 0.012 to 0.0027) under a lognormal prior distribution of LFY dataset (See supporting file 1). For the other two loci, substitution rate were estimated with a mean value and initial value of 0.0037 per substitutions/site/million year with more broadly
distributed lognormal prior distributions (AGT intron 1 and GroES intron 1: 95% interquartile range of 0.187 to 0.000074) to cover a wide substitution rate range of these two loci to show uncertainty.
For species tree priors, we used a Yule tree prior and a piecewise linear and constant root population size model. MCMC chains were performed for 50 million generations (sampling every 5,000
generations and discarding the first 10% as burn-in). Three independent MCMC chains were performed under these settings and each log files and species tree files were combined into a single log file and a single species tree file using the logCombiner program in BEAST v2.4.7. Convergence level of these three MCMC chains were checked in the program Tracer v1.6.0 (Rambaut et al., 2014).
Adopting topology identified from multi-loci species tree: [(Honshu + Shikoku populations), (Taiwan-Iriomote populations, SE-China populations)], we then further examined the population divergence process with focusing on gene flow by IM model which implementing in IMa2 (Hey, 2010a). An Infinite site model was adopted for each of the 3 nuclear markers analyzed. Truncated uniform distribution priors of all six parameters of IMa2 were set following the author’s
recommendations (Hey, 2010a). The upper bound of scaled lineage splitting time (with the flag -t), scaled effective population size of the extant and ancestral population (-q) and scaled migration rate among populations (-m) were set according to the theta estimated from Taiwan-Iriomote group, which had highest theta among 3 Conandron groups. The geometric mean of Watterson’s (1975) theta per sequence over three markers was 3.2. We set higher upper bound values than estimates of these parameters and they were –t7, -q17 and –m1 for splitting time, effective population size and migration rate respectively. The mutation rate per locus was set to 3.7×10-9 × 393 bp for LFY marker, and mutation rate of LFY was used as reference for the other two loci to rescale the IMa2 parameters from the analysis.
In addition, we also applied IM models, with same upper bound settings mentioned above, to
pairwise dataset of the three Conandron groups. Divergence time estimated from pairwise analysis can reveal splitting order (Hey, 2010b), therefore the results can confirm the divergence order inferred from *BEAST2. Finally, 40 Metropolis-coupling MCMC chains with heating parameter (- ha0.96, -hb0.85) were set for all four group and pairwise group pairs with 105 iteration discarded as burn-in followed by 106 iterations for sampling (100 iterations per sample). Three independent runs were performed for accessing convergence. In addition, likelihood ratio tests (LRT) were computed to determine significant level of post splitting gene flow between groups, following Nielsen &
Wakeley (2001).
Population demographical history
Two statistics-Tajima’s D (Tajima, 1983) and Fu’s Fs (Fu, 1997) were used to assess whether molecular markers isolated from Conandron conformed to expectation of neutrality theory or departed from neutrality theory due to bottleneck or expansion for each location using DnaSP5.0 (Librado and Rozas, 2009). The examination of deviation from neutrality by both Tajima’s D and Fu’s Fs statistics was based on 1000 coalescent simulations using DnaSP. Expectations of these two statistics are nearly zero or zero in a constant-size population, significant negative values indicate a sudden expansion in population size, while significant positive values mean processes such as a population subdivision or recent population bottlenecks. As a transcription factor, selection could affect CrCYC1 at codon level. Therefore, CrCYC1 dataset was subjected to further examination of deviation of neutral evolution by McDonald-Kreitman test (McDonald & Kreitman, 1991) using McDonald– Kreitman test on line web interface (Egea et al., 2008).
Second, we estimated effective population size change over time of Conandron by assessing whether Conandron has experienced population size expansion or decline as predicted by the hypothesis that the emergences of ECS continental shelf served as corridor or filter during cold periods. Analyses were conducted with the extended Bayesian skyline plot (EBSP) implemented in BEAST v2.4.7,
which uses coalescent based models to estimate posterior probabilities of effective population size over time (Heled & Drummond, 2008). Analyses focused on the groups identified by nrDNA multi loci phylogeny respectively. For nrDNA dataset, C. ramondioides were assigned into Honshu- Shikoku group (HS), Taiwan-Iriomote group (TI) and SE-China group (C) respectively. Substitution models for each dataset and molecular clock prior were set as in the *BEAST analysis. We
reconstructed population size change over time under the ‘coalescent: constant size’ tree prior for each group respectively in three EBSP runs. Each run consisted of 50 million generations with sampling every 5000 steps of which first 10% were discarded as burn-in. We combined individual data from three log files into a single log file and the corresponding three gene trees into a single gene tree file using the logCombiner program in BEAST v2.4.7. Skyline plots were constructed in EXCEL. Then, Bayes factors were used to judge whether EBSP results of each group showing statistical support or not. To do this, we extract counts of population size change and counts of no population size change from sum (indicators.alltrees) in the combined log file of each group. The BF over 3 were be regarded as a signal of significant population size change over time.
Ecological niche modeling
To infer potential suitable habitat change of Conandron at Last glacial maximum (LGM) and present, we modeled the potential suitable distribution range of C. ramondioides using maximum entropy methods (Elith et al. 2006; Phillips et al. 2006) in the program MAXENT version 3.3.3.
Available specimen occurrence data were acquired from GBIF (http://www.gbif.org/) and 19 BIOCLIM variables, including current and Last Glacial maximum, from the WorldClim data set (Hijmans et al. 2005) were used at 2.5m spatial resolution (~5 km).
Many of the BIOCLIM variables are highly correlated and applying all BIOCLIM variables in the modeling will inflate the variance of regression parameters and hence potentially leads to the wrong identification of relevant predictors in a statistical model (Dormann et al., 2013). Thus, to prevent
collinearity, variance inflation factors (VIF) analysis was performed to exclude highly correlated variables (VIF>5) before modeling. VIF calculates variance-inflation and generalizes variance- inflation factors for linear and generalized linear models. BIOCLIM variables, including Mean Diurnal Range, Isothermality, Mean Temperature of Wettest Quarter, Mean Temperature of Driest Quarter, Annual Precipitation, Precipitation of Driest Month and Precipitation Seasonality were kept for ecological modeling after VIF analysis. All chosen BIOCLIM variable layers were first clipped into proper area in the ArcGIS v10.3.
Our nr phylogeny suggested current disjunctively distributed C. ramondioides populations can be assigned into three geographical corresponding groups including Honshu-Shikoku (HS), Taiwan- Iriomote (TI) and SE-China (C). To examine whether these three groups showed niche
differentiation, we performed pairwise niche identity test among these groups by using ENMtools (Warren et al., 2010). The niche identity test aims to examine whether the pairwise suitability scores generating from MAXENT of each group showed significant ecological differences (Warren et al., 2010). To achieve this goal, we first generated potential suitability map of each group in MAXENT respectively and then performed niche identity test together with corresponding occurrence data of each group (See supporting file 2). By comparing the actual data to the null distribution, we can tell whether potential suitability map between groups showed statistically significant different or not.
To model potential suitability habitat of each group at LGM and present, all chosen BIOCLIM variables and occurrence data (HS: 202 occurrence, TI: 35occurrence, C: 8 occurrence) were used.
We first modeled potential suitability habitat of each group at present respectively with MAXENT ver. 3.3.3 (Phillips et al., 2006) using all chosen BIOCLIM variables and occurrence data of each group. Then, we projected modeled present suitability onto present and LGM climatic layers at the same resolution to generate continuous potential suitable distribution map of each group at LGM and current respectively.
Next, we try to identify suitable habitats and non-suitable habitats of these three C. ramondioides groups. To do this, we have to transform our continuous map to binary map by setting thresholds. In Liu et al, (2013) suggested that maximum sum of sensitivity and specificity should be regarded as best threshold method for presence-only ecological niche modeling. However, this threshold may be biased due to measure specificity which is based on absence data (Merow et al., 2013) that is
unknown in this analysis. Therefore, we chosen two commonly used thresholds that only consider presence data to determine potential suitable habitats and non-suitable habitats of C. ramondioides, including 10 percentile training presence threshold and minimum training presence threshold (Norris, 2014; Stephanie et al., 2013).
Results
Genetic diversity of Conandron populations
For the nrDNA markers, we obtained 208 AGT intron 1 sequences, 270 GroES intron 1 sequences and 192 LFY intron 1 sequences from our ampliqon library respectively (reads of AGT intron 1 ranging from 102 reads to 1524 reads, reads of GroES intron 1 ranging from 524 reads to 3383 reads and reads of LFY intron 1 ranging from 102 reads to 3011 reads). For CrCYC1 and ITS, we obtained 368 and 364 sequences after haplotype reconstruction by using PHASE. In total, 50 of 208 sequences of AGT intron 1 (24%), and 138 of 272 GroES intron 1 sequences (50.6%), 66 of 190 LFY intron 1 sequences (34.7%), 182 of 368 CrCYC1 (49.4%) and 158 of 364 ITS (43.4%) were heterozygotes.
The aligned lengths of 208 AGT intron 1 sequences ranged from 471 to 474 bp, 270 GroES intron 1 sequences ranged from 421 to 435 bp and 190 LFY intron 1 sequences ranged from 393 to 397 bp, which yielded 37, 43 and 28 haplotypes, respectively (See Table 2-1 for Haplotype distribution). For CrCYC1 and ITS, the aligned length are 798 bp and 734 bp respectively. Nucleotide diversity (π) was 7×10⁻³ at species level (ranging from 0 to 6.67×10⁻³ at population level) measuring from AGT intron 1 dataset, 9.25×10⁻³ (ranging from 0 to 13×10-3 at population level) from GroES intron 1 dataset and 7.4×10⁻³ (ranging from 0 to 6.63×10⁻³ at population level) from LFY1 dataset in Table 2-1. For CrCYC1 and ITS, nucleotide diversity of these two markers were 12.76×10⁻³ (ranging from 0 to 8.15×10⁻³ at population level) and 3.44×10⁻³ (ranging from 0 to 7.52×10⁻³ at population level) at species level respectively. Haplotype diversity (Hd) was 0.927 at species level in AGT intron 1 (ranging from 0 to 0.933 at population level), 0.916 at species level in GroES intron 1 (ranging from 0 to 0.933 at population level) and 0.908 at species level in LFY intron 1(ranging from 0.000 to 1.000) (Table 2-1). For CrCYC1 and ITS, haplotype diversity was 0.951 (ranging from 0 to 0.933 at population level) and 0.864 (ranging from 0 to 0.889 at population level) at species level
respectively. Comparing genetic diversity indices (Hd and π) calculated from these five nrDNA markers of C. ramondioides populations aside ECS, genetic diversity indices from AGT intron 1
dataset showing North are somewhat lower than South (North: Hd = 0.736; π = 4.64×10⁻³ vs. South:
Hd = 0.9; π = 5.64×10⁻³). Genetic diversity indices from GroES showing North are higher than South (North: Hd = 0.925; π = 13×10-3 vs. South: Hd = 0.818; π = 4.71×10⁻³), while genetic diversity indices from LFY intron 1 dataset showing nearly same level between North and South (North: Hd = 0.823; π = 6.63×10⁻³ vs. South: Hd = 0.818; π = 6.15×10⁻³). For CrCYC1, genetic diversity indices estimated from North group are lower than that estimated from South group (North: Hd = 0.897; π = 4.7×10⁻³ vs. South: Hd = 0.937; π = 10.32×10⁻³). Last, genetic diversity indices estimated from ITS showing North are somewhat lower than that in South (North: Hd = 0.802; π = 4.43×10⁻³ vs. South:
Hd = 0.839; π = 3.43×10⁻³) (Table 2-1).
As for the cpDNA, the aligned lengths of 197 cpDNA (trnL-F + trnH-psbA) sequences ranged from 978 to 985 bp. Among these sequences, we identified 19 haplotypes from these sequences. High levels of haplotype and nucleotide diversity were found at the species level (Hd = 0.954; π = 6.58×10⁻³), and were also found at regional level (Honshu+Shikoku : Hd = 0.633; π = 2.49×10⁻³, Iriomote : Hd = 0.752; π = 1.42×10⁻³, Taiwan : Hd = 0.865; π = 3.81×10⁻³, SE-China: Hd = 0.821; π
= 6.34×10⁻³) (Table 2-1). Genetic diversity indices (Hd and π) obtained from south populations are somewhat higher than those from north populations (North: Hd = 0.633; π = 2.49×10⁻³ vs South: Hd
= 0.894; π = 3.95×10⁻³).
Population structure of C. ramondioides
First, we reconstructed haplotype network from 6 loci to reveal the relationship among haplotypes and also help us to assign grouping of C. ramondioides populations. Our haplotype networks reconstructed from three nuclear markers showed that C. ramondioides in East Asia formed two clear groups corresponding to geographical region: Taiwan+Iriomote and Southeast China (Fig. 2-2a, 2-2b and 2-2c). In contrast, Honshu and Shikoku haplotypes formed multiple lineages linking to hypothetical haplotypes in each nuclear marker. In CrCYC1 haplotype network, CrCYC1 sequences
formed three distinct clade corresponding to geographical regions: Honshu + Shikoku, Southeast China and Taiwan+Iriomote (Fig. 2-2d). Unlike previous mentioned haplotype networks, multiple haplotypes connected to one broadly distributed ITS haplotype, which is situated in the center in ITS haplotype network (Fig. 2-2e). As can be seen in the unrooted nrDNA haplotype networks, the Taiwan+Iriomote and Southeast China haplotypes were separated from each other by 2 to three steps, and the Honshu and Shikoku haplotypes by 3 to 7 steps (Fig. 2-2a, 2-2b and 2-2c).
Specifically, the among group mutational steps identified from CrCYC1 haplotypes were 6 steps to 10 steps (Fig. 2-2d). The haplotype network pattern of these three nrDNA markers showed one common pattern that is no shared haplotypes among HS, C and TI groups of these three nuclear markers. In cpDNA haplotype network, HS and C + TI haplotypes were separated from each other by three steps. In addition, a SE-China and Taiwan shared cpDNA haplotype were identified and situated in the center of cpDNA haplotype network with multiple lineages connecting to it, forming a star like topology.
Significant genetic differentiation was obtained from our assigned “3group” dataset (Honshu + Shikoku group, Taiwan + Iriomote group and Southeast China group) of all four markers (Table 2- 2). Pairwise comparisons of “3group” yielded highly significant Fst values for all markers (Table 2- 2, 0.571 to 0.748 for AGT intron 1, 0.298 to 0.513 for GroES intron 1, 0.472 to 0.848 for LFY intron 1, and 0.269 to 0.32 for cpDNA, all significant at P < 0.0001). Hierarchical AMOVA for C.
ramondioides revealed high levels of genetic variations attributing to “Among groups” in two out of four markers (Table 2-3). For three nrDNA dataset, highest proportion of total genetic variation was attributed to “Among groups” (39.61% for AGT intron 1; 47.81% for LFY) with significant ΦCT values (ΦCT : 0.4 for AGT intorn 1; ΦCT : 0.478 for LFY).
Significant MK test suggests GCYC1 deviate from neutral hypothesis
MK test was applied to evaluate whether CrCYC1 gene deviate from neutral hypothesis by
comparing the ratio of numbers of nonsynonymous (Pn) and synonymous (Ps) polymorphic sites within C. ramondioides and the ratio of numbers of nonsynonymous (Dn) and synonymous divergence sites (Ds) between outgroup sequence (C. umbellifera) and C. ramondioides. If Pn/Ps equal to Dn/Ds or does not differed from each other significantly, then suggested CrCYC1 does not deviate from neutral hypothesis. The McDonald– Kreitman test (MK test) results showed that the ratio of the number of nonsynonymous (N) to synonymous (S) polymorphic sites within C.
ramondioides (Pn/Ps= 20/5) was significantly higher than that of the number of nonsynonymous to synonymous fixed sites between C. ramondioides and C. umbellifera (Dn/Ds= 24/24, P=0.013) (Table 2-4). The higher within species Pn/Ps ratio than between species Dn/Ds ratio pattern was also observed when using Gcyc1 of H. bicornuta and O. benthamii as outgroup sequence respectively (Table 2-4). Significant MK tests results suggested CrCYC1 dataset deviate from neutral hypothesis and thus excluded in the further analysis.
Divergent ITS sequences suggests incomplete concerted evolution of Conandron ITS
Internal transcribed spacer (ITS) as one part of nuclear ribosomal DNA is one of the most sequenced molecular markers in reconstructing plant phylogeny due to rapid concerted evolution within and among nuclear ribosomal DNA component subunits, fast substitution rate and availability of universal primers (Baldwin et al., 1995; Alvarez & Wendel, 2003; Schoch et al., 2012; Li et al., 2011). Concerted evolution is a form of molecular process that lead to homogenization of different genes in a gene family (Liao, 1999). However, high intra individual polymorphism identified from different plant group, such as Lespedeza (Xu et al., 2017), Carapichea ipecacuanha (Queiroz et al., 2011), Pyrus (Zheng et al., 2008) and Mammillaria (Harpke, D. & Peterson, 2008), suggesting incomplete concerted evolution of ITS in plant is frequent.
To verify whether ITS amplified from Conandron evolving concerted or not, 8 Conandron
individuals (two from Honshu and Shikoku, three from Southeast China and three from Taiwan). We
obtained multiple haplotypes (ranging from three to six) from colony sequences (Supporting table 2- 2). In addition, these colony sequences showed divergent pattern in the haplotype network
(Supporting Fig 2-1). For example, haplotypes obtained from SF14 (light pink circle) formed six lineages on the haplotype network (Supporting Fig 2-1). High haplotype numbers and divergent pattern in haplotype network not only suggest high intra individual polymorphism of Conandron ITS, but also indicate incomplete concerted evolution of Conandron ITS. Therefore, we excluded ITS from our multi nuclear loci dataset to prevent ITS from blurring evolution signals of Conandron populations.
Significant Tajima’s D and Fu’s Fs suggest cpDNA amplified from Southeast China departure from neutral evolution
Neutral theory assumes small effective population size will be affected greatly than large effective population size. In diploid species, the effective population size of nrDNA is 4 times larger than cpDNA, which means effect of genetic drift should be 4 time faster in cpDNA than that in nrDNA.
However, our results against this expectation. In the haplotype networks, China haplotypes forms monophyletic group in our three single copy nuclear markers (Figure 2a, 2b, 2c), but not in cpDNA marker (Figure 2f). Therefore, we assume cpDNA from China may not evolve neutrally. To test this assumption, we performed Tajima’s D and Fu’s Fs to examine whether cpDNA from China deviate from neutrality or not. Besides, we also applied these two neutrality tests on nrDNA markers from China as comparison to cpDNA.
Our results showed that both neutrality tests results of cpDNA departure from neutrality with significant statistic support comparing to those from other three nrDNA markers (Table 2-5). The positive value derived from neutrality test suggest China population may experience diversifying selection. This may be one of the reasons why genetic drift can not cause China cpDNA to lose genetic variations.
Lineage divergence order and time within C. ramondioides revealed by nrDNA
We reconstructed species by integrating genetic informations from AGT intron 1, GroES intron 1and LFY intron 1 dataset. Species tree reconstructed using *BEAST2 recovered an nrDNA genealogy with five moderately to highly supported monophyletic lineages (posterior probability ≧ 0.75) representing Honshu lineage, Shikoku lineage, Taiwan lineage, Iriomote lineage and SE-China lineage. Supporting nr haplotype networks, Taiwan and Iriomote grouped together with highly support (posterior probability = 0.98) and this lineage was named as Taiwan-Iriomote lineage for further three group and pairwise IMa2 analysis. In addition, Taiwan-Iriomote lineage grouped with SE-China lineage with moderately support (posterior probability = 0.75), forming so called South group, while Honshu and Shikoku lineage grouped together with maximal support (posterior probability = 1), forming so called Honshu-Shikoku lineage (Fig. 2-3). Lineage splitting time between Honshu-shikoku and Southeast China + Taiwan-Iriomote was dated to 1.13 (95% CI: 0.26- 1.8) MYA, while divergence time between SE-China and Taiwan-Iriomote group was dated to 0.75 (95% CI: 0.37-1) MYA.
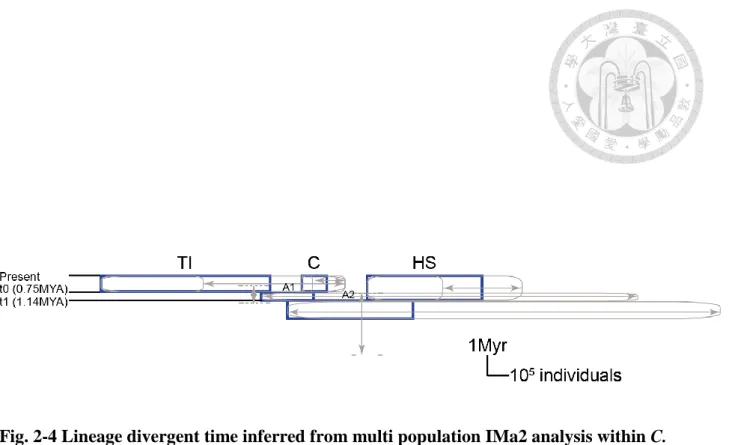
For multi population IMa2 analysis, we present summary statistic in Fig. 2-4 and marginal posterior density distribution in (Fig. S1). The mean estimates for times of split indicated divergence between SE-China lineage (C) and Taiwan-Iriomote lineage (TI) (t0), between the common ancestor (A) for C, TI and Honshu + Shikoku (HS) lineage (t1) at 0.75 MYA (95%HPD: 0.45-1.3) and 1.14 MYA (95%HPD: 0.82-3.86), respectively. However, the confidence interval of t1 was relatively broad for which flat marginal distribution was obtained (see Fig. S1a). 1 out of 8 migration (2Nm) parameters had non zero peaks: between common ancestor of C and TI to HS (See Fig S1d). No LRT was significant among these 8 migration parameters. No significant results were obtained for the rest 14 LRTs (Table S3). Effective population size for the extant lineages had mean estimates for HS group (547070 individuals), for TI lineage (810240 individuals) and for C group (122784 individuals). For
effective population size of ancestral populations, flat and broad marginal posterior density distributions were obtained, suggesting little information of these parameters (See Fig. S1b).
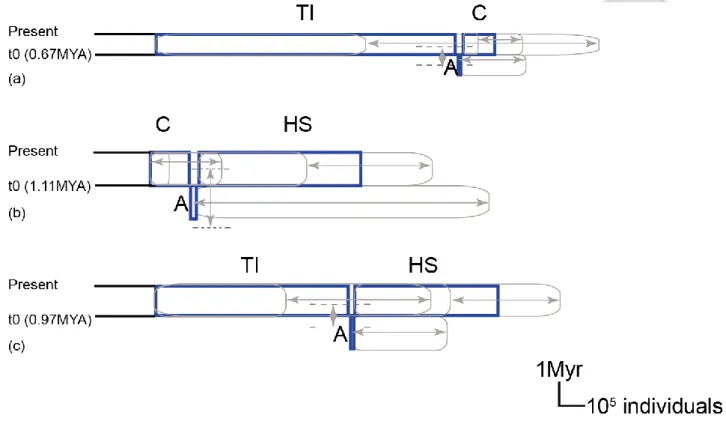
For the pairwise IMa2 analysis, we present summary statistics in Fig. 2-5 and marginal posterior density distribution in Fig. S2. The mean estimates of splitting time obtained from pairwise IMa2 analysis suggesting the lineage divergence order was consistent with the results from nrDNA-based
*BEAST2 and multi population IMa2 analysis; thus SE-China and Taiwan-Iriomote lineage diverged most recently at 0.67 MYA (95%HPD: 0.28-0.7 MYA), following TI diverged from HS at 0.97 MYA (95%HPD: 0.61-1.44 MYA), C diverged from HS at 1.11 MYA (95%HPD: 0.53-2.48 MYA), respectively. Consistent with multi population IMa2 analysis, TI and C diverged most recently following divergence between TI, C and HS (Fig. S2a). Effective population size obtained from pairwise IMa2 analyses indicating TI had highest effective population size, following HS and the last is C (Fig. S2b to S2d). These estimates from pairwise IMa2 analyses consistent with those obtained from multi population IMa2 analysis. Like multi population analyses, pairwise IMa2 analyses gave broad and flat marginal posterior density distribution of ancestral population which suggesting few information about these parameters estimating from the dataset. In addition, no significant LRT obtained between group pairs (Fig. S2e to S2g).
Demographic history
Neutrality tests of Tajima's D revealed non-significant negative values in many individual
populations for all nuclear markers and cpDNA marker in Taiwan (Table 2-1). In addition, neutrality tests of Tajima’s D showed non-significant positive values in many individual populations and regional data set and pooled northern groups in Japan. Similar results were also been seen for most SE-China populations. However, significant negative Fu’s Fs values (P<0.05, bold number in Table 2-1) in pooled Taiwan data set, pooled Taiwan + Iriomote data set and at species level were found (Table 2-1). Fu's Fs is considered to be more sensitive in detecting population expansion and
suggesting possible past population growth, but the expansion may have been restricted to Taiwan and Iriomote that resulted in the non-significant Fu's Fs values for most populations and regions. On the other hand, population contraction may have been restricted to individual population in Japan for non-significant positive Fu's Fs values for most populations and regions (pooled Japan and SE- China, Table 2-1). Non-significant or small negative or positive values of Tajima's D and Fu's Fs were found in many individual populations suggesting stable population size in C. ramondioides populations.
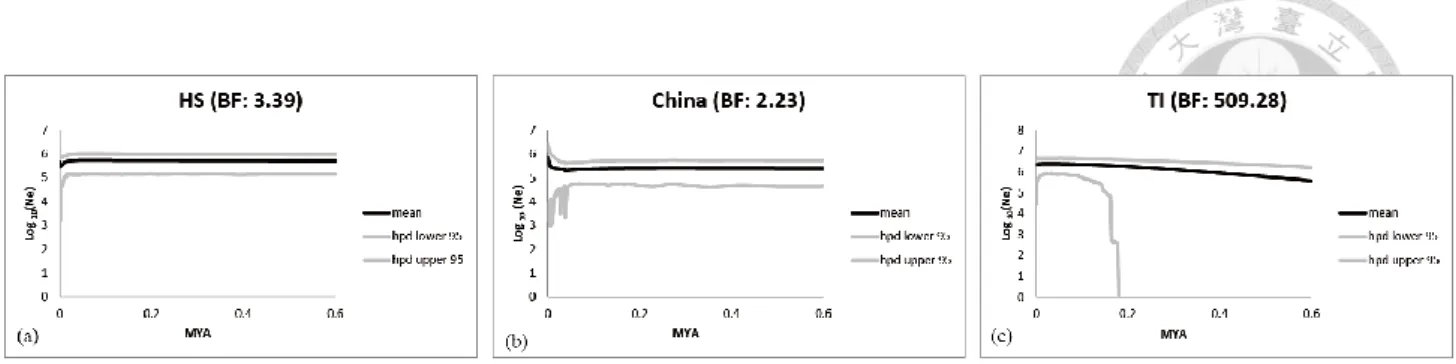
In our EBSP, narrow credible intervals with recent population size decline and over threshold BF value (BF = 3.39) suggested HS group remained long time constant population size and experienced recent population size decline (Fig. 2-6a). For China group, the flat credible intervals and low BF (BF = 2.23) showed that China group also remain constant population size through time (Fig. 2-6b).
For the TI group, gradual increasing credible interval trend since 0.2 MYA coupling with extremely high BF (BF = 509.28) suggested TI group experienced moderate population size increase since 0.2 MYA (Fig. 2-6c). To sum up, EBSP suggested C. ramondioides groups either remain constant population size over time (like Honshu-Shikoku group and Southeast China group in Fig. 2-6a and 2- 6b) or experienced moderate population size change (like increasing trend observed in TI group in Fig. 2-6c).
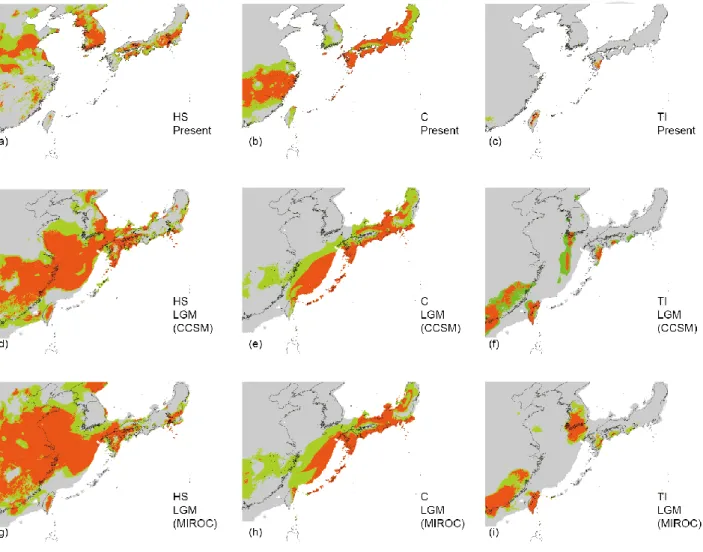
Present and LGM ecological niche models
The AUC value for the current potential distribution of Honshu + Shikoku group (HS) was 0.866, Southeast China group (C) was 0.872 and Taiwan + Iriomote group (TI) was 0.848 suggesting a moderate predictive model simulation of each group. Top two bioclimatic variable contributed to Maxent simulations of these three groups were BIO3 (Isothermality) and BIO9 (Mean Temperature of Driest Quarter) for HS lineage, BIO12 (Annual Precipitation) and BIO14 (Precipitation of Driest Month) for C and BIO8 (Mean Temperature of Wettest Quarter) and BIO12 (Annual Precipitation)
for TI. MAXENT distributions based on the two different LGM climatic models yielded nearly consistent results in each group. For HS group, both CCSM and MIROC model predictions showed predicted suitable habitats have been distributed in China and Taiwan over a larger area than present (Fig. 2-7a, 2-7d and 2-7g). Notably, the predicted HS group suitable habitats occupied large
proportion of exposed ECS continental shelf during LGM (Fig. 2-7d and 2-7g). For C group, both CCSM and MIROC model predictions suggested that an obvious predicted habitat loss in SE-China during LGM than present (Fig. 2-7b, 2-7e and 2-7h). Also, a broad predicted suitable habitats of C group distributing in ECS continental shelf during LGM was identified (Fig. 2-7e and 2-7h). Last, for TI group, both CCSM and MIROC model indicated that predicted suitable habitats of TI group was restricted in Southeast China, Taiwan and south Kyushu during LGM (Fig. 2-7c, 2-7f and 2-7i).
Unlike predicted habitat range of HS and C group, there is no predicted suitable habitats across ECS continental shelf was identified in TI group during LGM (Fig. 2-7f and 2-7i).