國立台灣大學工學院化學工程研究所 碩士論文
Graduate Institute of Chemical Engineering College of Engineering
National Taiwan University Master Thesis
溫合條件下液相氫化應用於糠醇轉化至四氫糠醇 Liquid-phase Hydrogenation of Furfuryl Alcohol to
Tetrahydrofurfuryl Alcohol under Mild Conditions
鄭偉安 Rusdy Zulfan
指導教授:吳嘉文 博士
Advisor : Kevin Chia-Wen Wu, Ph.D
中華民國 104 年 11 月 November, 2015
Abstract
Nowadays, energy and environmental issues become more intense and prevalent to be discussed in most occasions. Uncontrolled utility of fossil fuel without any awareness to environmental impacts, certainly endangers our modern civilization. Lignocellulosic- derived biomass is claimed by scientists as green-based-energy alternative to replace the fossil fuel soon or later.
Further processes need to be performed to make chemicals-derived-lignocellulosic ready to be utilized, and hydrogenation is one of them. Tetrahydrofurfuryl alcohol (THFA) is one of hydrogenation’s products originated from furfuryl alcohol (FFA) which has been regarded as ―green‖ solvent in agriculture sector and precursor for another useful chemicals. Hydrogenation usually is performed under high pressure (above 10 bar) and above 100°C. Author initiated to carry on liquid-phase hydrogenation under open system and 30˚C using NaBH4 as hydrogen-generator. Gas- phase hydrogenation had also been performed under certain condition, and its optimum results were used to compare to previous optimum results. Commercial catalyst rhodium embedded on carbon was chosen to carry hydrogenation.
System using NaBH4 could achieve 100% conversion of FFA and 79% yield towards THFA at 30˚C for 2 hours reaction. System using H2 gas could convert 94% of FFA and 93% yield towards THFA at 50°C for 11 hours reaction. Despite of selectivity factor, NaBH4 system still achieved high yield, and not forget to mention room temperature reaction, and simple apparatus preparation became value-added. Hydrogenation using NaBH4 could become one option to be considered.
Keywords :FFA, THFA, hydrogenation, NaBH4, H2
I
Table of Contents
1. Introduction ...1
1.1. Cellulose ...3
1.2. Hemicelluloses ...3
1.3. Lignin ...4
1.4 Furfural ...5
1.5 Hydrogenation...6
1.6 Hydrogen storage / Hydrogen-generating agent ...7
1.6.1. Hydrogen-generator in complex metal ...7
1.6.2. Hydrogen-generator in chemical hydrides ...7
1.7. Furfuryl Alcohol (FFA) ...8
2. Paper Survey ...9
2.1. Tetrahydrofurfuryl alcohol (THFA) ...9
2.2 Sodium borohydride (NaBH4) as hydrogen-generator ...11
2.3 Hydrogenation using NaBH4 as hydrogen-generator ...13
3. Objective ...14
4. Experimental ...15
4.1 Chemicals and materials ...15
4.2 Equipments ...15
4.3 Hydrogenation of furfuryl alcohol ...16
4.3.1 Hydrogenation using sodium borohydride (NaBH4) ...16
II
4.3.2 Hydrogenation using H2 gas ...16
4.4 Characterization of material ...16
4.4.1 Principles of SEM-EDS ...17
4.4.2 Principles of XPS...18
4.4.3 Principles of TEM ...18
4.4.4 N2 adsorption-desorption isotherm (BET method) ...19
4.5 Gas chromatography ...20
4.6 Characterization of products ...22
5. Results and Discussions ...23
6. Conclusions ...36
7. Future Prospects ...37
References ...38
Supporting Informations ...42
III
Table of Figures
Figure 1 Schematic pretreatment of lignocellulosic material ...2
Figure 2 Structure of cellulose ...3
Figure 3 Structure of hemicelluloses ...4
Figure 4 Structure of lignin ...4
Figure 5 Schematic of reductive upgrading pathway for biomass derived xylose ...5
Figure 6 Furfural platform for biofuels ...6
Figure 7 X-ray emission ...17
Figure 8 Schematic diagram of gas chromatograph ...20
Figure 9 Furfuryl alcohol calibration curve ...22
Figure 10 Tetrahydro furfuryl alcohol calibration curve ...22
Figure 11 N2 adsorption-desorption isotherm of Rh/C ...23
Figure 12 XPS spectra of Rh/C ...24
Figure 13 TEM image of Rh/C ...24
Figure 14 EDS elemental mapping ...25
Figure 15 Screening metal for FFA hydrogenation to THFA (NaBH4 method) ...26
Figure 16 The effect of FFA/Rh molar ratio on THFA production (NaBH4 method) ....27
Figure 17 The effect of different NaBH4 amount on THFA production ...29
Figure 18 Six protonated FFA molecular structures ...30
Figure 19 The effect of different H2SO4 amount on THFA production (NaBH4 method). ...30
Figure 20 The yield of THFA over time (NaBH4 method) ...31
Figure 21 The effect of Rh/FFA molar ratio on THFA production (H2 gas method) ...32
Figure 22 The effect of temperature on THFA production (H2 gas method) ...33
Figure 23 The yield of THFA over time (H2 gas method) ...33
IV
Figure 24 Cycled test for catalyst (H2 gas method) ...34
Figure 25 GC analysis raw data overlay 1 ...42
Figure 26 GC analysis raw data furfuryl alcohol (FFA) ...42
Figure 27 GC analysis raw data overlay 2 ...43
Figure 28 GC analysis raw data THFA ...43
Figure 29 GC analysis raw data 1.5-Pentanediol……….44
V
List of Tables
Table 1 Representative works from literature in the hydrogenation of furfural to
furfuryl alcohol ...8 Table 2 Different analytical techniques to quantify metal content ...25
1
1. Introduction
The quest of seeking alternative energy sources to replace fossil fuel began in the beginning 21st century. Economic factor is major driven, followed by environmental lately : (1) their finite supply, (2) increasing price and unexpected fluctuations, and (3) greenhouse gases emission and global warming. All these weaknesses were synthesized into huge massive interests on searching for alternative, renewable, sustainable, and economically viable fuel such as biofuel. 1st generation of biofuel (bioethanol) was produced from sugars, starches, and vegetables oil. Bioethanol can be either mixed with gasoline or used as a sole fuel using dedicated engines; moreover, it has higher heat of vaporization and provide octane number compared to gasoline. Ethanol is already blended with gasoline and supported by vehicle manufacturers have resulted in vehicles that can use up an 85% ethanol – 15% gasoline mixture. Gasoline can use bioethanol as an oxygenated fuel to increase its oxygen content, causing better hydrocarbon oxidation and diminishing greenhouse gases.[1]
High cost of raw materials, startch and sugar derived from sugar cane and maize, limited stock, and endanger food supply chain, couldn’t make this type of biofuels couldn’t sustain much longer. Second generation of biofuel replaced it soon after that, which used lignocellulosic-based materials as feedstock. This type of materials are cheap, abundant, and renewable which counter the first generation’s drawbacks.
Lignocellulosic are composed of cellulose, hemicelluloses, and lignin in an intricate structure, which is recalcitrant to decomposition.
One of the best strategies to convert such biomass into sugars is enzymatic saccharification due to its low energy requirement and less pollution caused; but, the major problem is the low accessibility of cellulose because of rigid association of cellulose with lignin. This leads to difficulties within the conversion process; therefore,
2
breaking down lignin seal in order to make cellulose more accessible to enzymatic hydrolysis for conversion is one main aim of pretreatment. In other words, pretreatment is the crucial and costly unit process in converting lignocellulosic materials into fuels.
A suitable pretreatment procedures involve (1) disrupting hydrogen bonds in crystalline cellulose, (2) breaking down cross-linked matrix of hemicelluloses and lignin, and finally, (3) raising the porosity and surface area of cellulose for subsequent enzymatic hydrolysis. There are several pretreatment methods including, physical pretreatment (grinding and milling, microwave and extrusion), chemical pretreatment (alkali, acid, organosolvent, ozonolysis, and ionic liquid), physicochemical pretreatment (steam explosion, liquid hot water, ammonia fiber explosion, wet oxidation and CO2
explosion) and biological pretreatment.[1]
Figure 1 Schematic pretreatment of lignocellulosic material[1]
3
1.1. Cellulose
Cellulose, the main constituent of lignocellulosic biomass, is a polysaccharide that consists of a linear chain of D-glucose linked by β-(1,4)-glycosidic bonds to each other. The cellulose strains are associated together to make cellulose fibrils. Cellulose fibers are linked by a number of intra- and intermolecular hydrogen bonds. Cellulose is insoluble in water and most organic solvents.
O
OH CH2OH
HO O
O O
HO
CH2OH OH
O
O
OH HO
CH2OH
O
n
Figure 2 Structure of cellulose[2]
1.2. Hemicelluloses
Hemicellulose, located in secondary cell walls, are heterogenous branched biopolymers containing pentoses (β-D-xylose, α-L-arabinose), hexoses (β-D-mannose, β-D-glucose, α-D-galactose) and/or uronic acids (α-D-glucuronic, α-D-4-O-methyl- galacturonic and α-D-galacturonic acids). They are relatively easy to hydrolyze because of their amorphous, and branched structure (with short lateral chain) as well as their lower molecular weight. In order to increase the digestability of cellulose, large amounts of hemicelluloses must be removed as they cover cellulose fibrils limiting their availability for the enzymatic hydrolysis. Hemicellulose are relatively sensitive to operation condition, therefore, parameters such as temperature and retention time must be controlled to avoid the formation of unwanted products such as furfurals and hydroxymethyl furfurals which later inhibit the fermentation process.[1]
4
O OH
HO O
O O
OH O
HOH2C
OH HO
O
O O
HO
O O HO
H3CO HOOC
OH
O O
HO
OH O
Figure 3 Structure of hemicelluloses[3]
1.3. Lignin
Lignin is an aromatic polymer synthesized from phenylpropanoid precursors.
The major chemical phenylpropane units of lignin consisting primarily of syringyl, guaiacyl and p-hydroxy phenol are linked together by a set of linkages to make a complicated matrix.[1]
Figure 4 Structure of lignin[4]
5
1.4 Furfural
Lignocellulose biomass contains cellulose, hemicellulose, and lignin. For the past decade, attention has been focused on utilization cellulose for biofuels compared to biofuels-derived hemicellulose. Glucose can be converted to hydroxymethylfurfural (HMF), and subsequently upgraded to dimethylfuran (DMeF). Furfural (FFR) was identified as one of promising chemicals for sustainable fuels and chemicals in 21st century proposed by Bozell et al.[5]Furfural is produced by the hydrolysis and dehydration of xylan contained lignocelluloses. Large amount of furfural production began at the beginning of 1922 in USA by Quaker Oats Company. As the consequence development of furfural industry, the price reached ~$1700 per ton in 2002,[6] and
~$2000 per ton by June 2011.[7] Its properties make this heteroaromatic aldehyde as selective extractant,[8] effective fungicide,[9] effective inhibiting the growth of wheat smut through killing the fungus.[8]
Lignocellulose Hemicellulose
Cellulose Lignin
+
+
O OH
OH OH
OH
Xylose
O O
Furfural
O
OH
Furfuryl Alcohol
O
OH
Tetrahydro Furfuryl Alcohol
O
Methyl Furan
Figure 5 Schematic of reductive upgrading pathway for biomass derived xylose[10]
6
1.5 Hydrogenation
Hydrogenation is chemical reaction that typically encountered in fuel processing. In order to compete with commercial fuel (e.g. gasoline), furanic biofuels is needed to go through this process to increase energy density and miscibility in hydrocarbon fuels. Hydrogenation chemistry for furfural, includes hydrogenation of – CHO side chain to –CH2OH or –CH3, hydrogenation of furan ring, and its opening to pentanols, pentane-diols, and alkanes.
Figure 6 Furfural platform for biofuels[11]
7
1.6 Hydrogen storage / Hydrogen-generating agent
[12]H2 gas is commonly used in hydrogenation, but in some occasions high pressure need to be avoided for safety issue. There are classes of compound that can generate hydrogen gas. The urgency of finding hydrogen generator in fuel cell research area boosted the popularity of these compounds on new application as hydrogen source.
1.6.1. Hydrogen-generator in complex metal
Complex metal hydrides (e.g. NaAlH4, LiAlH4, LiBH4) generally have the formula AxByHn, where A is an alkali metal cation and B is metal or metalloid to which the hydrogen atoms are covalently bonded. Certain binary metal hydrides such as MgH2
and AlH3 also have covalently bonded hydrogen atoms and are thus more similar to complex metal hydrides than intermetallic hydrides in hydrides are particularly promising due to their high theoretical gravimetric and volumetric hydrogen storage densities. However, they suffer from slow uptake and release kinetics, meaning that much of the stored hydrogen is not practically accessible due to the time it would take to release it.
1.6.2. Hydrogen-generator in chemical hydrides
Chemical hydrides (e.g. NaBH4, LiAlH4, NH3BH3) have high gravimetric hydrogen storage densities and release hydrogen by reaction by water. In effect, the hydrogen is stored both in the chemical hydride itself and the water. These reactions tend not to be easily reversible and the by-products must be extracted from the spent fuel mixture to be regenerated. However as the reactions can be controlled of parameters such as rate of water addition, pH, and the use of catalysts, chemical hydrides are particularly attractive for use in portable applications, where easy ―on-off‖
control is crucial.
8
1.7. Furfuryl Alcohol (FFA)
Furfuryl alcohol is product hydrogenation of –CHO side chain to –CH2OH from furfural. Furfuryl alcohol is known as intermediate to various hydrogenated chemicals.
Several last decade, researches focused on production of furfuryl alcohol from furfural using numerous metals as catalysts, such as copper, nickel, platinum, palladium, and platinum oxides.[13] Since the research quite advancing in catalyst field, furfuryl alcohol could be produced not only from furfural but also from molecule xylose. Marco A.
Fraga group have successfully did the production of furfuryl alcohol from xylose using dual catalysts composed Pt/SiO2 and sulfated ZrO2.[14]
Table 1 Representative works from literature in the hydrogenation of furfural to furfuryl alcohol[15]
YFFA(%)
9
2. Paper Survey
2.1. Tetrahydrofurfuryl alcohol (THFA)
Tetrahydrofurfuryl alcohol with a molecular formula of C5H10O2 is a transparent, mobile, high-boiling liquid with mild odor, and completely miscible with water. THFA is regarded as ―green solvent‖ because of its relatively benign nature and very low toxicity.[16] The industrial production of THFA is commercially manufactured by Koatsu Chemical Industries in Japan with annual production volume of ~30 t. Up till now, the potential applications of THFA are only limited for agricultural solvent, printing inks, industrial and electronics cleaners.[16]
First published article that could be traced on Web of Science about production of THFA was in 1989, performed by Antoine Gaset’s group. They attempted to synthesize THFA according to two procedures involving either furfural or furfuryl alcohol. Copper-supported catalysts were efficient for transforming furfural into furfuryl alcohol, but couldn’t obtain THFA. On the other hand, catalysts based upon metals from group VIII (Ni, Ru, Rh, Pd, Pt) could lead to the formation of THFA. Ni-supported catalysts was commonly used because its cheap, but the reaction was not selective. In their study, they compared activity, selectivity, and lifetime of different catalysts in hydrogenation of furfural and furfuryl alcohol.[17]
An interesting report was showed by Folami T. Ladipo’s group. This group presumed that the nature of heterogeneous catalysts in selectivity for desired products by concentrating on composition of catalysts and operating conditions of furfural hydrogenation appeared somehow limited. There is a current need for development of soluble catalysts that display high activity and product selectivity for furfural hydrogenation or hydrogenolysis. They synthesized ruthenium(II) bis(diimine)
10
complexes with different ligands using data conducted by Gadi Rothenberg’s group[18]
as standpoint. They could achieve both 99% yield of furfuryl alcohol from furfural and 99% yield of THFA from furfuryl alcohol by changing the ligands.[19]
Liquid-phase chemoselective hydrogenation of furfural was studied by Virginia Vetere’s group, employing Pt, Rh, and Ni in bimetallic systems. Bimetallic systems, containing amounts of tin, were obtained by means of controlled surface reactions between a monometallic catalyst and Sn(C4H9)4. Relationship between two metals employed activity and selectivity. All systems allowed obtaining furfuryl alcohol from furfural with high selectivity (99, 97, and 76% were achieved with Pt, Rh, and Ni catalysts, respectively). These bimetallic catalysts only achieved ~4% selectivity to THFA in hydrogenation of furfural.[20]
More detail information regarding hydrogenation of furfuryl alcohol to THFA was performed by Xiaochun Chen’s group. They performed liquid phase hydrogenation on a series of new special supported Ni catalyst QD3 using continous stirred autoclave.
Operating condition studied in the experiments was opted as the following range : temperature within 433-453 K, pressure within 3.0-4.0 MPa, catalyst loading 20g/L and stirring rate at 1000 rpm. They concluded temperature is most important factor to furfuryl alcohol conversion, catalyst loading affects THFA selectivity, hydrogen pressure has a relatively weak impact on furfuryl alcohol conversion and THFA selectivity. They claimed that under optimized condition, conversion above 99.9%, and selectivity of THFA higher than 98.3% could be achieved within 3.5h.[21]
11
Selective low-temperature hydrogenation of furfuryl alcohol to THFA could be achieved by hectorite-supported ruthenium nanoparticles. Metallic ruthenium nanoparticles intercalated in hectorite (particle size ~4 nm) under mild conditions, 40°C, 20 bar of H2 pressure could achieve 100% conversion, selectivity >99%).[22]
2.2 Sodium borohydride (NaBH
4) as hydrogen-generator
[12]Sodium borohydride can be classified as both a complex metal hydride and chemical hydride as it can release hydrogen by two methods : thermolysis, where the stored hydrogen is released by heating, and hydrolysis, where the stored hydrogen is released by reaction with water. The former is not attractive for portable applications since sodium borohydride is stable up to 400°C. The latter is particularly attractive for three major reasons. Firstly, hydrolysis of sodium borohydride is a spontaneous, exothermic (-210 kJ mol-1) process that can be easily accelerated by simple addition of metal catalyst. Secondly, as can be seen from equation 1, half of the hydrogen comes from the water, giving sodium borohydride a relatively high theoretical hydrogen storage capacity of 10.8 wt%. Finally, the hydrolysis reaction can produce pure hydrogen at temperature as low as 298K.
However, hydrogen generation by hydrolysis of sodium borohydride is not without problems. A major issue is the volume of water required. Equation 1 shows the stoichiometric chemical reaction, but in reality at least 4 molar equivalents of water are required for each mole of sodium borohydride in the reaction. This is for two reasons.
Firstly, as shown in Equation 2, sodium metaborate (NaBO2) is rapidly hydrated.
12
Secondly, the solubility of sodium borohydride in water is relatively low (55 g per 100 g at 25°C), requiring more water than that required by stoichiometry to ensure the sodium borohydride remains in solution (although sodium borohydride does have a considerably higher solubility than ammonia borane (33.6 g per 100 g at 25°C), and other hydrolysis materials such as aluminium and silicon which are insoluble). This is further compounded by the even lower solubility of sodium metaborate (28 g per 100 g of water at 25°C), which means that the concentration of sodium borohydride must be kept below 16 g per 100 g of water to ensure that sodium metaborate does not precipitate from the reaction mixture.
Sodium borohydride undergoes self-hydrolysis upon the addition of water, and thus typically stabilized by the addition of sodium hydroxide (the self-hydrolysis reaction rate drops to negligible above pH 13). The mechanism of self-hydrolysis has been described as follows :
Step 1 : NaBH4(s) Na+(aq) + BH4-(aq) Step 2 : BH4-(aq) + H+(aq) BH3(aq) + H2(g) Step 3 : BH3(aq) + 3H2O(l) B(OH)3(aq) + 3H2(g) Step 4 : B(OH)3(aq) + H2O(l) B(OH)4-(aq) + H+(aq) Step 5 : 4B(OH)4-(aq) + 2H+(aq) B4O72-(aq) + 9H2O(l)
The decrease in the amount of protons in basic media results in Step 2 of the self-hydrolysis being disfavored and the hydrogen generation process thus slowed. By increasing the amount of protons and thus accelerating Step 2, the addition of homogenous acid catalysts to aqueous sodium borohydride solutions results in an increase the rate of hydrolysis.
13
2.3 Hydrogenation using NaBH
4as hydrogen-generator
Catalyst Brown’s P-2 Ni, Caubere’s nickel complex reducing agent (NiCRA) and Ni2B-BER, are well known in hydrogenation of alkenes using nickel compounds.
For other systems, also NaBH4-CoCl2, FeCRA, LiH-VCl, and LaNi5H6 have been reported to be good hydrogenation systems. Takashi’s group have found system (sodium borohydride (NaBH4)/moist alumina in hexane) is excellent for the good selective reduction of aliphatic and aromatic carbonyl compounds to corresponding alcohols in high yield. They tested using different types of support, which styrene as test substrate and could achieve 90% of ethyl benzene. [23]
Ioannis’s group investigated that mesoporous titania-supported gold nanoparticles assemblies (Au/MTA) catalyze the activation of NaBH4, which act as transfer hydrogenation agents for the reduction of nitroarenes to the corresponding anilines in moderate high yields. Nitroalkanes are reduced to the corresponding diazo and hydrazo compounds. [24]
Stephen P. Thomas’s group performed simple and environmentally benign formal hydrogenation using highly abundant iron (III) salts and an inexpensive, bench stable, stoichiometric reductant, NaBH4, in ethanol, under ambient conditions. Also this reaction has been applied to the reduction of terminal alkenes up to 95% yield, and nitro-groups up to 95% yield. [25]
Poul Nielson’s group directly used the relatively inexpensive reagent RuCl3.xH2O as catalyst for the reduction of olefins in the presence of water.
Combination of cheap and readily available sodium borohydride and a catalytic amount of RuCl3.xH2O selectively reduces mono- and disubstituted olefins, whereas trisubstituted olefins, unless activated, and benzyl ethers remain inert. [26]
14
3. Objective
Until today, there are many researchers focusing on hydrogenation to THFA either from furfural or furfuryl alcohol. So far, there is no report on using sodium borohydride (NaBH4) as hydrogen-generator for this particular reactions. Using sodium borohydride open new alternative to avoid high pressure on its operation. Author also performed hydrogenation using H2 gas, later on both optimized conditions would be compared to each other. Sodium borohydride method would be restiricted at temperature under 100°C. Commercial catalyst rhodium embedded on carbon was used as catalyst in this furfuryl alcohol (FFA) hydrogenation.
15
4. Experimental
4.1 Chemicals and materials
Chemical Information
Furfuryl alcohol Sigma-Aldrich
Rhodium, 5wt% on carbon Alfa Aesar
N,N-Dimethylacetamide 99%+, Extra pure, ACROS Organics Sodium borohydride (NaBH4) Sigma-Aldrich
Sodium hydroxide (NaOH) Sigma-Aldrich
Magnesium sulfate anhydride (MgSO4) ACROS Organics Distilled-water
4.2 Equipments
Equipment Information
Hotplate Thermal scientific
Syringe pump kdScientific
Syringe Terumo
Sonicator DELTA ultrasonic cleaner
Glassware
Gas chromatography (GC)
YL Instrument 6500 GC system Column: capillary-acid
polyethylene glycol
Physisorption analyzer ASAP-2000
X-ray photoelectron spectroscopy (XPS) Thermo Scientific, Theta Probe Energy dispersive spectroscopy (EDS) Nova NanoSEM 230
Tunneling electron microscopy (TEM) JEOL JEM-1200EX II Transmission Electron Microscope
16
4.3 Hydrogenation of furfuryl alcohol
4.3.1 Hydrogenation using sodium borohydride (NaBH4)
Firstly, NaBH4 solution was prepared by mixing NaBH4(s) 0.5 mL aqueous solution pH 14 with 0.005 g NaBH4 (1 wt%). Typically, 0.0119 g of furfuryl alcohol (0.12145 mmol) and 0.005 g of catalyst (50:1 molar ratio) was added to 5 mL of N,N- dimethylacetamide (DMA) in 20 mL vial. Vial was kept under water bath at 30°C., and open system. Concentrated sulfuric acid 98% as much as 8 µL was added into the vial.
As prepared the syringe pump, the NaBH4 solution will be added dropwise into the vial with flow rate 0.25 mL/h.
4.3.2 Hydrogenation using H2 gas
Typically, 0.0119 g of furfuryl alcohol (0.12145 mmol) and 0.005 g of catalyst (50:1 molar ratio) was added to 5 mL of N,N-dimethylacetamide (DMA) in double-neck round-bottom flask capacity 25 mL. H2 gas flow was introduced to system with 100 cc/min. Also, needle was also inserted pass through the rubber stopper to make open system.
4.4 Characterization of material
The distribution of metal on carbon was analyzed using SEM/EDS. The metal state of rhodium was analyzed using XPS. Probing metal rhodium on carbon was characterized by TEM. Characterization of materials related on surface are was performed using physisorption analyzer.
17
4.4.1 Principles of SEM-EDS[27]
Incident beam targeted the sample creating secondary electrons, and it leaves holes in the shells where the secondary electrons used to be. These ―holes‖ are not in stable state, and to compensate this unstability, electrons from the outer shells will jump into inner shells, which has lower energy state, and also emitted electromagnetic wave, called x-rays. X-rays emitted from the sample are the characteristic in energy and wavelength.
Figure 7 X-ray emission[27]
EDX analysis could provide element information from the sample because of its specific energy and wavelength. A quantitative analysis can be done by standards or standardless analysis. A standardless analysis quantifies the elements by calculating the area under the peak of each identified element and after taking account for the accelerating voltage of the beam to produce the spectrum, performs calculations to create sensitivity factors that will convert the area under the peak into weight or atomic percent.
18
4.4.2 Principles of XPS[28]
X-ray Photoelectron Spectroscopy (XPS), irradiates the sample surface with a low energy X-ray. If binding energy are lower than x-ray energy, photoelectron will be emitted from the parent atom. Only the photoelectrons at the extreme outer surface (10- 100 Angstroms) can escape the sample surface, making this surface analysis technique.
This depth is approximately twenty atomic layers.
The electron orbitals of an atom have different binding energies. These orbital energies also differ depending on what element the sample atom is composed of. The kinetic energy (K.E.), or speed of the electrons emitted from the sample is coming from incident energy minus the binding energy. Because of this, if the kinetic energy of the emitted electrons can be measured, through a simple substraction, the binding energy of the electron orbital can be calculated and also determine the valence state of the atom.
4.4.3 Principles of TEM[29]
Transmission electron microscope is using high energy beam of electrons to penetrate a very thin sample, and the interactions between the electrons and the atoms can be used to observe features such as the crystal structure and features in the structure like dislocations and grain boundaries.
As the electron pass through the sample, they are scattered by the electrostatic potential set up by the constituent elements in the specimen, and there’s also a portion that pass through the electromagnetic objective lens which focuses all the electrons scattered from one point of the specimen into one point in the image plane.
19
4.4.4 N2 adsorption-desorption isotherm (BET method)[30]
Nitrogen gas become a suitable adsorptive to conduct physisorption based on its characteristics. BET theory is based on an over-simplified model of physisorption. As in the Langmuir theory, the adsorbent surface is pictured as an array of equivalent sites on which molecules are adsorbed in a random manner. It is assumed that the occupation probability of a site is independent of the occupancy of neighbouring sites and that there are no lateral interactions between the adsorbed molecules (i.e. the ideal localized monolayer). The molecules in the first layer act as sites for molecules in the second layer; these in turn are sites for molecules in the third layer and so on for molecules in the higher layers. Although no lateral interactions are allowed, all layers above the first are assumed to have liquid-like properties.
P = partial vapour pressure of adsorbate gas in equilibrilium with the surface at 77.4 K Po = saturated pressure of adsorbate gas, in pascals
Va = volume of gas adsorbed at standard temperature and pressure (STP)
Vm = volume of gas adsorbed at STP to produce an apparent monolayer on the sample surface
C = dimensionless constant that is related to the enthalphy of adsorption of the adsorbate gas on the powder sample
20
4.5 Gas chromatography
[31]Gas chromatography involves a sample being vapourised and injected onto the head of the chromatographic column. The sample is transported through the column by the flow of inert, gaseous mobile phase. The column itself contains a liquid stationary phase which adsorbed onto the surface of an inert solid.
Figure 8 Schematic diagram of gas chromatograph
Gas carrier gas must be chemically inert. Commonly used gases include nitrogen, helium, argon, and carbon dioxide. The choice of carrier gas is often dependant upon the type of detector which is used. The carrier gas system also contains a molecular sieve to remove water and other impurities.
There are two general types of column, packed and capillary. Packed column contain a finely divided, inert, solid support material coated with liquid stationary phase. Most packed column are 1.5-10 m in length and have an internal diameter of 2-4 mm. Capilarry columns have an internal diameter of a few tenth of millimeter. They can be one of two types : wall-coater open tubular (WCOT) or support-coated open tubular (SCOT). Wall-coated columns consist of a capillary tube whose walls are coated with liquid stationary phase. In support-coated columns, the inner wall of the capillary is lined with a thin layer of support material such as diatomaceous earth, onto which the
21
stationary phase has been absorbed. SCOT columns are generally less efficient than WCOT columns. Both types of capillary column are more efficient than packed columns.
There are many detectors which can be used in gas chromatography. Different detectors will give different types of selectivity. A non-selective detector responds to all compounds except the carrier gas, a selective detector responds to a range of compounds with a common physical or chemical property and a specific detector responds to a single chemical compound. Detectors can also be grouped into concentration dependent detectors and mass flow dependent detectors. The signal from a concentration dependant detector is related to the concentration of solute in the detector, and does not usually destroy the sample dilution of with make-up gas will lower the detectors response. Mass flow dependant detectors usually destroy the sample, and the signal is related to the rate at which solute molecules enter the detector. The response of a mass flow dependant detector is unaffected by make-up gas.
22
4.6 Characterization of products
After reaction finished, the catalyst was separated from the solution by filtration, afterwards solution was directly analyzed by GC, which was equipped with acid- modified polyethylene glycol as its stationary phase. The calibration curve for furfuryl alcohol, and tetrahydro furfuryl alcohol are listed below.
Figure 9 Furfuryl alcohol calibration curve
Figure 10 Tetrahydro furfuryl alcohol calibration curve y = 5.556x10⁻⁶x peak area
R² = 0.985
0 0.02 0.04 0.06 0.08
0 4000 8000 12000 16000
Conc. (M)
Peak area
y = 6.537x10⁻⁶x peak area R² = 0.983
0 0.02 0.04 0.06 0.08
0 4000 8000 12000
Conc. (M)
Peak area
23
5. Results and Discussions
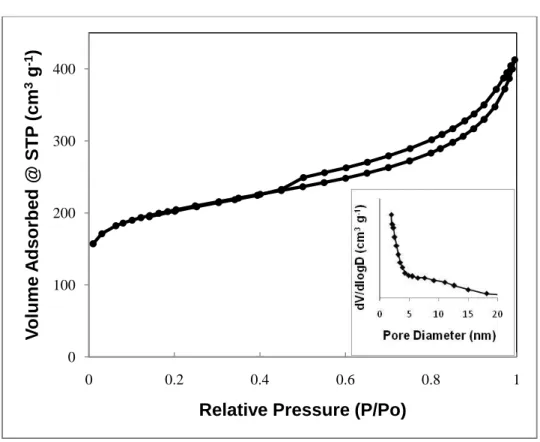
Before jumping to the discussion on parameters effect, it’s better to take a look on catalyst characterizations. The first characterization is N2 adsorption-desorption analyzer, which could give information regarding characteristics of porous material covered surface area, and pore size. From figure below, combination of no sharp peak only broad obtuse distribution and hysteresis loop, indicate carbon matrix has different pore sizes (micro and mesopore).
Figure 11 N2 adsorption-desorption isotherm of Rh/C
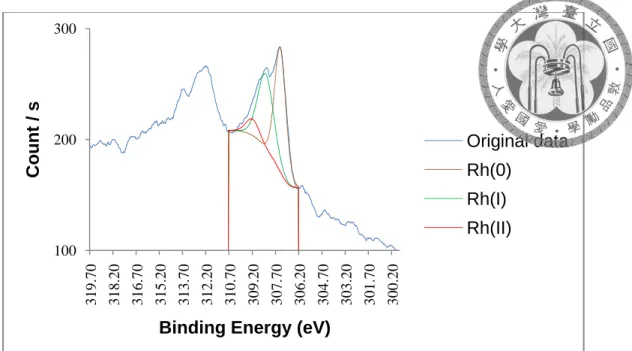
Figure 12 shows the XPS spectra of Rh/C, which contains information of valence state of rhodium metal inside the Rh/C. After fitting process, information shows that not all rhodium metal inside the carbon matrix are in zero valence. Different valence could effect the performance of Rh/C used as catalyst.
0 100 200 300 400
0 0.2 0.4 0.6 0.8 1
Volume Adsorbed @ STP (cm3 g-1 )
Relative Pressure (P/Po)
24
Figure 12 XPS spectra of Rh/C
Figure 13 shows TEM image, indicating black spot represented by rhodium metal on the carbon support. From the image, there is a concentrated black spot indicated the rhodium metal not distributed quite well.
Figure 13 TEM image of Rh/C
100 200 300
319.70 318.20 316.70 315.20 313.70 312.20 310.70 309.20 307.70 306.20 304.70 303.20 301.70 300.20
Count / s
Binding Energy (eV)
Original data Rh(0)
Rh(I) Rh(II)
25
Figure 14 EDS elemental mapping
Figure 14 shows the qualitative analysis of rhodium metal. Actually, there are several techiques that can be used to determine the amount of metal in solid material, but for one and other reason, author couldn’t use any of these techniques.
Techique Advantages Disadvantages Current situation
ICP-OES/MS
Extremely fast, low level of interference, extensive linear dynamic range, multi element detection,
accurate and precise
Solid samples have to be converted into
aqueous solutions.
Rh metal slightly dissolve in strong
acid
AAS Fast, accurate, well documented
Must have element specific lamps, very
short dynamic range, aqueous solution required
Don’t have rhodium lamp
GF-AAS
Fast, extremely accurate, well documented, extremely low detection
limits
Must have element specific lamps, very
short dynamic range, aqueous solution required
Don’t have rhodium lamp
26 XRF
Relatively simple sample preparation, few
interferences
Very slow XRF standard very expensive UV-Vis Simple to use Poor in selectivity
and sensitivity
For organometallic only
Table 2 Different analytical techniques to quantify metal content
Hydrogenation of furfuryl alcohol to THFA isn’t new reaction. So far, there is no report on this particular reaction using NaBH4 as hydrogen-generator. Author designed the system not only in order to avoid high pressure (open system), and perform at 30°C, but also the reaction will be occurred in liquid-phase reaction.
Figure 15 Screening metal for FFA hydrogenation to THFA (NaBH4 method) Reaction condition : 30°C, 1 bar, 2 h, 0.005 g catalyst (5 wt%), 5 mL of DMA, 10.4 µL
FFA (0.12145 mmol), 8 µL H2SO4(conc), 0.5 mL of 1 wt% NaBH4(aq), dropwise rate = 0.25 mL/h
Commercial 5wt% rhodium metal embedded on carbon was selected to this particular reaction because there was a report by Antoine Gaset’s group in 1989 using same catalyst to perform FFA hydrogenation to THFA. This group achieved 53%
conversion and 30% yield of THFA, made 57% of selectivity in 26 minutes. Also author
0 10 20 30 40 50 60 70 80 90 100
Rh/C In/AC Pd/AC Ru/AC
Conversion or Yield (%)
Different metal loading, 5wt%
Conversion of FFA Yield of THFA
63%
20% 20%
17%
60%
27
did perform screening several catalyst started Ru/AC, Pd/AC, and In/AC before decided to use the commercial Rh/C, but none of these could produce THFA as author wanted.
Since the % yield isn’t equal to % conversion, there would be by-products other than THFA. Author tried to confirm these by-product using their standards in GC, and methyl tetrahydro furan (MTHF), 1-pentanol, 1,5-pentanediol were not in these by- products category.
Figure 16 The effect of FFA/Rh molar ratio on THFA production (NaBH4 method) Reaction condition : 30°C, 1 bar, 2 h, 0.005 g catalyst (5 wt%), 5 mL of DMA, 10.4 µL
8 µL H2SO4(conc), 0.5 mL of 1 wt% NaBH4(aq), dropwise rate = 0.25 mL/h
Rhodium/carbon was selected for further optimization. Figure 16 shows the increment of yield but then drop start from 50 molar ratio. 10 molar ratio shows almost all 42% of FFA converted to THFA. This particular condition reaction shows high selectivity. Highest yield of THFA was achieved at 20 molar ratio, which indicated amount of FFA quite low in system so the Rh/C catalyst quite helpful converting FFA to THFA, but trade-off occurred between yield and selectivity. 50 molar ratio shows
0 10 20 30 40 50 60 70 80 90 100
10 20 50 80
Conversion (%)
FFA/Rh molar ratio Conversion Yield of THFA
42%
56% 62%
55%
39% 45%
21%
12%
28
62% conversion, but low as 21% yield of THFA. As the molar ratio increases, and the amount of catalyst’s active sites are fixed, make the catalyst itself get saturated quickly.
Turnover frequency (TOF) represents catalytic ability of catalyst, which means the turnover per unit time in definition. The best yield was achieved at 20 molar ratio, 0.022 mmol of THFA was produced using 0.002429 mmol of rhodium, resulted 0.00126 s-1. Nevertheless, since no molar ratio could produce 100% conversion, so author decided to select 50 molar ratio for further optimization.
The amount of NaBH4 addition was studied using 50 molar ratio. On procedure section, the preparation of aqueous solution pH 14 is to inhibit the production rate of H2
gas. The meaning of ―value wt%‖ on the figure doesn’t show real amount of NaBH4 in the aqueous, because the nature of self-hydrolysis. Since environment inside the vial was acid, the moment NaBH4(aq) made contact to system, OH- would react to excess H+ made the production rate of H2 increased, and the hydrogenation could be occurred.
Figure 17 shows the inclining trend of conversion and yield. The increase amount of NaBH4, means production of H2 also increases, make more FFA could react with H2. The best yield was achieved at 5 wt% NaBH4. As the amount of NaBH4 increases to 8 wt% NaBH4, yield of THFA drops.
29
Figure 17 The effect of different NaBH4 amount on THFA production Reaction condition : 30°C, 1 bar, 2 h, 0.005 g catalyst (5 wt%), 10.4 µL FFA (0.12145 mmol),5 mL of DMA, 8 µL H2SO4(conc), dropwise rate = 0.25 mL/h
The amount of H2SO4 addition was also studied, showed on figure 19. Inside the vial, there were FFA, catalyst, DMA (solvent), and H2SO4. In such very acid environment, FFA get protonated. One report was published in 2011 by Peter C. Stair’s group related to acid-catalyzed furfuryl alcohol polymerization.[32] They calculated free energy of every possible protonated state of FFA. Based on the thermodynamics of protonation, all sites were found to be thermodynamically unfavorable at room temperature, with positions 2, 3, and 5 being significantly endothermic (52.3 – 128.9 kJ mol-1). Protonation at positions 1 and 6 are more probable than other positions as per assessment of their thermodynamic feasibilities, at which the change in free energy of protonation is 1.3 and 19.2 kJ mol-1, respectively.[32] In author’s system, there was a possibility that protonated states in all position 1, 2, 3, 4, 5, and 6 occurred, because the 100% conversion and unfavourable 100% yield of THFA.
0 10 20 30 40 50 60 70 80 90 100
0.5 1 3 5 8
Conversion or Yield (%)
NaBH4wt%
Conversion of FFA Yield of THFA
33%
62%
68%
100% 100%
21%
37%
79%
55%
30
O
OH O
OH
O
OH
O
OH
O
OH O
OH O
O
O
C+
O
C+
O-
CH2 +H
+H H
H H+
H H+
H+
+H H
O H
H H
H
-H2O
H I H
II
III
IV
V VI VII
VIII
IX 1
2 3
4 5
6
Figure 18 Six protonated FFA molecular structures[32]
Figure 19 The effect of different H2SO4 amount on THFA production (NaBH4 method).
Reaction condition : 30°C, 1 bar, 2 h, 0.005 g catalyst (5 wt%), 10.4 µL FFA (0.12145 mmol), 5 mL of DMA, 0.5 mL of 5 wt% NaBH4(aq),dropwise rate = 0.25 mL/h
0 10 20 30 40 50 60 70 80 90 100
4 8 12 16
Conversion or Yield (%)
H2SO4(µL) Conversion of FFA Yield of THFA
100% 100% 100% 100%
35%
79%
51% 56%
31
The yield of THFA over time was also studied. Figure 20 shows there is no inclining of THFA yield after 2 hours. At 1 hour reaction, it produced 28% yield of THFA, but the showed 100% conversion. There is possibility that FFA still in the intermediate state to become THFA before 2 hours reaction, and later after 2 hours reaction, yield of THFA increases dramatically 80%. As the reaction time increases, the yield of THFA is almost constant around 80%, indicating no more intermediate state that would be transformed into THFA.
Figure 20 The yield of THFA over time (NaBH4 method)
Reaction condition : 30°C, 1 bar, 0.005 g catalyst (5 ww%), 10.4 µL FFA (0.12145 mmol), 8 µL H2SO4(conc), 0.5 mL of 5 wv% NaBH4(aq),dropwise rate = 0.25 mL/h
After all, catalyst Rh/C couldn’t achieve high yield (> 90%) after optimization, so next experiment was to test the commercial catalyst Rh/C using H2 gas at open system.
The optimization results for each method would be compared to each other. Figure 21 shows increasing yield of THFA in the ambient and in short period of reaction time using H2 gas at open system. Since only open system that been used, it made the
0 10 20 30 40 50 60 70 80 90 100
1 2 4 6
Conversion or Yield (%)
Reaction time (h) Conversion of FFA Yield of THFA
100% 100% 100% 100%
28%
79% 74%
83%
32
environment not really quite harsh compare to NaBH4 method. This indicates good performance for this hydrogenation using H2 gas. At 100 molar ratio, the turnover frequency is 0.01504 s-1 which is better than previous method for initial step. 100 molar ratio was selected for further optimization because of selective consideration.
Figure 21 The effect of Rh/FFA molar ratio on THFA production (H2 gas method) Reaction condition : 30°C, 1 h, 0.005 g catalyst (5 wt%), 5 mL of DMA,
H2 gas at 1 bar, gas flow rate = 100 cc/min
The yield of THFA over different temperature was studied. Figure 22 shows there is incremental of yield at 50°C, and drops as the temperature increases. Not only it shows that commercial catalyst Rh/C is well performed under ambient temperature, but also shows high selectivity toward THFA at 50°C. The selectivity decreased as temperature increased. Author suspects that the reason why using NaBH4 could give lower selectivity, maybe because since the NaBH4 could perform self-hydrolysis (production of H2 gas increases), and the reaction quite is exothermic (-210 kJ mol-1), make the temperature increased suddenly inside the vials.
0 10 20 30 40 50 60 70 80 90 100
50 80 100 120
Conversion or Yield (%)
FFA/Rh molar ratio Conversion Yield of THFA
79%
68%
61% 61%
58% 55% 54%
45%
33
Figure 22 The effect of temperature on THFA production (H2 gas method) Reaction condition : 1 h, 0.005 g catalyst (5 wt%), 20.8 µL of FFA (0.2429 mmol)
5 mL of DMA, H2 gas at 1 bar, gas flow rate = 100 cc/min
Figure 23 The yield of THFA over time (H2 gas method)
Reaction condition :50°C, 0.005 g catalyst (5 wt%), 20.8 µL of FFA (0.2429 mmol), 5 mL of DMA, H2 gas at 1 bar, gas flow rate = 100 cc/min
0 10 20 30 40 50 60 70 80 90 100
30 50 70 90
Conversion or Yield (%)
Temperature (°C) Conversion of FFA Yield of THFA
0 10 20 30 40 50 60 70 80 90 100
1 3 5 7 9 11 13 15
Conversion or Yield (%)
Reaction time (h) Conversion Yield of THFA
62% 64%
39% 36%
54%
62%
30% 26%
64%
74%
81%
86%
91% 94%
90% 92%
62%
70%
80%
84%
90% 93%
89% 88%
34
Figure 23 shows the increasing yield of THFA as reaction time increases. The high selectivity keep the pace with the conversion. The 100% conversion couldn’t be achieved whatever reaction time progressed.The maximum of FFA conversion is ~94%
followed by ~93% yield, make this result the highest selectivity for author could achieve so far.
Figure 24 Cycled test for catalyst (H2 gas method)
Reaction condition :1h, 50°C, 0.005 g catalyst (5 wt%), 20.8 µL of FFA (0.2429 mmol), 5 mL of DMA, H2 gas at 1 bar, gas flow rate = 100 cc/min
Since the best achievement was gotten from using H2 gas, so author decided to perform the recyclability test using this method. Commercial catalyst Rh/C was tested several runs to check its reusability. First, the quantity of catalyst and FFA was scaled up to 10 times, and performed the reaction. After the reaction finished, solution was centrifuged to separate the catalyst and the solution. Catalyst was washed using water for 6 times to remove the substituents (reactant, product, by-product). Catalyst was dried in the oven at 100°C overnight. As amount as 0.005 g of catalyst was used with equal 100 molar ratio for reaction. The results was analyzed using GC. This result was
0 10 20 30 40 50 60 70 80 90 100
1 2 3 4
Conversion or Yield (%)
Run #
Conversion of FFA Yield of THFA
62%
40%
26%
8%
54%
13%
6% 3%
35
counted for run 2. The remaining catalyst was exposed to FFA with equal ratio, and run for 1 hour. This steps was done till 4 times. Figure 20 shows that yield of THFA gradually drops in the consecutive runs. There is possibility that there are still a lot of constituents attached to the Rh/C surface. It made this commercial Rh/C bad on this recyclability test.
36
6. Conclusions
The optimum condition reaction using sodium borohydride method is 30°C, 1 bar, 0.005 g catalyst (5 wt%), 10.4 µL FFA (0.12145 mmol), 8 µL H2SO4(conc), 0.5 mL of 5 wt% NaBH4(aq),dropwise rate = 0.25 mL/h, 2 hours reaction. This method achieved 100% conversion, and 79% yield of THFA.
The optimum condition reaction using H2 gas method is 50°C, 0.005 g catalyst (5 wt%), 20.8 µL of FFA (0.2429 mmol), 5 mL of DMA, H2 gas at 1 bar, gas flow rate = 100 cc/min, 11 hours reaction. This method achieved ~94% conversion, and ~93% yield of THFA.
Using NaBH4 method could achieve amost similar yield as H2 method, despite of conversion and selectivity factors. Despite of the selectivity, reaction time parameter becomes more strong benefit when using NaBH4, which contributes to higher TOF.
Performing reaction at room temperature, simple apparatus preparation, and cost will become the strong point using NaBH4 method. Commercial rhodium embedded on carbon couldn’t be recycled in this particular case.
From gas-phase hydrogenation, it give author information that it is not NaBH4 that perform the hydrogenation, but H2 gas that produced from it that perform the hydrogenation.
37
7. Future Prospects
Commercial rhodium embedded on carbon showed more selective to THFA when using gas-phase method with open system, which opposited when using liquid-phase method also with open system. Further investigation on surface chemistry need to be performed to answer this riddle, include solubility of H2 gas in DMA solvent, H2 production rate when using NaBH4. Kinetics aspect also need to be investigated to answer which major parameters take big role in this particular reaction. Not only that, reaction mechanism of this two system is still unclear while using this commercial Rh/C..
38
References
[1] Haghighi Mood, S.; Hossein Golfeshan, A.; Tabatabaei, M.; Salehi Jouzani, G.;
Najafi, G. H.; Gholami, M.; Ardjmand, M., Lignocellulosic biomass to bioethanol, a comprehensive review with a focus on pretreatment. Renewable and Sustainable Energy Reviews 2013, 27, 77-93.
[2] http://www.helsinki.fi/polymeerikemia/research/cellulose1.html.
[3] Chen, W.; Zhong, L.-x.; Peng, X.-w.; Wang, K.; Chen, Z.-f.; Sun, R.-c., Xylan-type hemicellulose supported palladium nanoparticles: a highly efficient and reusable catalyst for the carbon-carbon coupling reactions. Catalysis Science & Technology 2014, 4 (5), 1426-1435.
[4] http://www.lignoworks.ca/content/what-lignin.
[5] Bozell, J. J.; Petersen, G. R., Technology development for the production of biobased products from biorefinery carbohydrates-the US Department of Energy's "Top 10" revisited. Green Chemistry 2010, 12 (4), 539-554.
[6] Toor, S. S.; Rosendahl, L.; Rudolf, A., Hydrothermal liquefaction of biomass: A review of subcritical water technologies. Energy 2011, 36 (5), 2328-2342.
[7] http://www.dalinyebo.com/furfural-market.
[8] Zeitsch., K. J., The chemistry and technology of furfural and its many byproducts.
Amsterdam, 2000.
[9] H.E. Hoydonckx, W. M. V. R., W. Van Rhijn, D.E. De Vos, P.A. Jacobs, Furfural and derivatives. Wiley-VCH Verlag GmbH & Co. KGaA, Weinheim 2007.
[10] Scholz, D.; Aellig, C.; Hermans, I., Catalytic Transfer Hydrogenation/Hydrogenolysis for Reductive Upgrading of Furfural and 5- (Hydroxymethyl)furfural. ChemSusChem 2014, 7 (1), 268.
39
[11] Lange, J.-P.; van der Heide, E.; van Buijtenen, J.; Price, R., Furfural—A Promising Platform for Lignocellulosic Biofuels. ChemSusChem 2012, 5 (1), 151.
[12] Brack, P.; Dann, S. E.; Wijayantha, K. G. U., Heterogeneous and homogenous catalysts for hydrogen generation by hydrolysis of aqueous sodium borohydride (NaBH4) solutions. Energy Science & Engineering 2015, 3 (3), 174-188.
[13] Samuel, S., Catalytic production of furfuryl alcohol and catalyst therefor. Google Patents: 1956.
[14] Perez, R. F.; Fraga, M. A., Hemicellulose-derived chemicals: one-step production of furfuryl alcohol from xylose. Green Chemistry 2014, 16 (8), 3942-3950.
[15] Yan, K.; Wu, G.; Lafleur, T.; Jarvis, C., Production, properties and catalytic hydrogenation of furfural to fuel additives and value-added chemicals. Renewable and Sustainable Energy Reviews 2014, 38, 663-676.
[16] http://www.novamolecular.com/media/THFA%20DS_R1, p.
[17] Merat, N.; Godawa, C.; Gaset, A., High selective production of tetrahydrofurfuryl alcohol: Catalytic hydrogenation of furfural and furfuryl alcohol. Journal of Chemical Technology & Biotechnology 1990, 48 (2), 145-159.
[18] Strassberger, Z.; Mooijman, M.; Ruijter, E.; Alberts, A. H.; Maldonado, A. G.;
Orru, R. V. A.; Rothenberg, G., Finding Furfural Hydrogenation Catalysts via Predictive Modelling. Advanced Synthesis & Catalysis 2010, 352 (13), 2201-2210.
[19] Gowda, A. S.; Parkin, S.; Ladipo, F. T., Hydrogenation and hydrogenolysis of furfural and furfuryl alcohol catalyzed by ruthenium(II) bis(diimine) complexes.
Applied Organometallic Chemistry 2012, 26 (2), 86-93.
[20] Vetere, V.; Merlo, A. B.; Ruggera, J. F.; Casella, M. L., Transition metal-based bimetallic catalysts for the chemoselective hydrogenation of furfuraldehyde. Journal of the Brazilian Chemical Society 2010, 21, 914-920.
![Figure 1 Schematic pretreatment of lignocellulosic material [1]](https://thumb-ap.123doks.com/thumbv2/9libinfo/9603503.629850/9.893.212.712.594.1051/figure-schematic-pretreatment-of-lignocellulosic-material.webp)
![Figure 2 Structure of cellulose [2]](https://thumb-ap.123doks.com/thumbv2/9libinfo/9603503.629850/10.893.182.788.86.921/figure-structure-of-cellulose.webp)
![Figure 3 Structure of hemicelluloses [3]](https://thumb-ap.123doks.com/thumbv2/9libinfo/9603503.629850/11.893.134.806.117.338/figure-structure-of-hemicelluloses.webp)
![Figure 5 Schematic of reductive upgrading pathway for biomass derived xylose [10]](https://thumb-ap.123doks.com/thumbv2/9libinfo/9603503.629850/12.893.173.762.713.920/figure-schematic-reductive-upgrading-pathway-biomass-derived-xylose.webp)
![Figure 6 Furfural platform for biofuels [11]](https://thumb-ap.123doks.com/thumbv2/9libinfo/9603503.629850/13.893.136.776.197.779/figure-furfural-platform-for-biofuels.webp)
![Table 1 Representative works from literature in the hydrogenation of furfural to furfuryl alcohol [15]](https://thumb-ap.123doks.com/thumbv2/9libinfo/9603503.629850/15.893.136.801.526.1040/table-representative-works-literature-hydrogenation-furfural-furfuryl-alcohol.webp)