國 立 交 通 大 學
應用化學系分子科學碩士班
碩
士
論
文
利用奈秒時間解析光譜研究 HPTS
在 AOT
反微胞的質子轉移基態動力學研究
Ground-state Proton Transfer Dynamics of HPTS in
AOT Reverse Micelles as Studied by Nanosecond
Time-Resolved Infrared Spectroscopy
研 究 生:王辰文
指導教授:重藤真介 博士
利用奈秒時間解析光譜研究 HPTS
在 AOT 反微胞的質子轉移基態動力學研究
研 究 生:王辰文 Student:Chen-Wen Wang
指導教授:重藤真介 博士 Advisor:Dr. Shinsuke Shigeto
國 立 交 通 大 學
應用化學系分子科學碩士班
碩 士 論 文
A Thesis
Submitted to M. S. Program, Institute of Molecular Science, Department of Applied Chemistry
National Chiao Tung University in Partial Fulfillment of the Requirements
for the Degree of Master
in
M. S. Program, Institute of Molecular Science, Department of Applied Chemistry
August 2011
Hsinchu, Taiwan, Republic of China
i
利用奈秒時間解析光譜研究 HPTS
在 AOT 反微胞的質子轉移基態動力學研究
學生 : 王辰文 指導教授 : 重藤真介 博士
國立交通大學應用化學系分子科學碩士班
摘要
1-hydroxy-3,6,8-pyrenetrisulphonic acid (常見名為 HPTS) 為其中一種
被廣泛研究的螢光分子。在水溶液中,HPTS 存在兩種形式,一種為酸式,
其吸收光譜最大峰值出現在 400nm,另外一種形式則為鹼式,吸收光譜最
大峰值出現在 450nm。在電子基態下,HPTS 的 pKa 值約為 7.2,然而在第
一激發態下急遽下降到了 0.5。受到光誘發而改變酸性這一特性引起了科學
家的興趣,有一系列的研究已完成而了解 HPTS 位於激發態的質子轉移動
力學。然而,那些大部分的研究利用的是電子吸收/放射光譜。能用來提供
HPTS 兩種形式結構直接訊息的震動光譜術至今仍舊匱乏。
這裡我們利用了奈秒時間解析紅外光譜(TRIR)來觀察 HPTS 位於基態的
質子轉移動力學。為了能在水溶液中進行 TRIR 的測量,我們利用了具有奈
秒尺度的“水池”,其位於丁二酸二辛酯磺酸鈉(通稱 AOT)形成的反微胞
中,HPTS 亦溶於“水池”內部。使用反微胞讓我們不只可以有效降低水大
量的 IR 吸收而且能藉由改變水-介面活性劑的比例,W
0= [H
2O]/[AOT],來
ii
控制 HPTS 位於從侷限水到類散水的微觀環境,我們利用次微秒至微秒的
時間區段來記錄受到 355nm 激發,位於 AOT 反微胞的 HPTS 之瞬態 IR 光
譜。HPTS 位於單一反微胞的平均分子數調整至 0.8,這樣可以使平均不超
過一個 HPTS 分子包含在單一反微胞中。由結果顯示位於基態下觀察到的
動力學反應歸因於鹼式 HPTS 的再質子化途徑。我們量測了在從 7 改變到
25 的瞬態物質衰變圖譜,並利用自然對數方程式來擬合。自然對數的時間
常數
會依據 W
0的變化而有急遽的改變,也就是在 W
0= 7 時
= 0.2 s,然而
W
0= 25 時
= 2.4 s。換句話說,HPTS 的再質子化結合速率會因為“水池”
的大小減少而增加。這樣的結果定性而言和 HPTS 於基態下反質子轉移的
擴散模型一致。我們也發現存在於 AOT 反微胞內部“水池”之 HPTS 分子
的平均數目和衰變圖譜有關。
iii
Ground-state Proton Transfer Dynamics of HPTS in
AOT Reverse Micelles as Studied by Nanosecond
Time-Resolved Infrared Spectroscopy
Student: Chen-Wen Wang
Advisor: Dr. Shinsuke Shigeto
M. S. Program, Institute of Molecular Science,
Department of Applied Chemistry
National Chiao Tung University
Abstract (English)
1-hydroxy-3,6,8-pyrenetrisulphonic acid (commonly referred to as HPTS) is one of the most extensively studied fluorescent molecules. HPTS occurs as two forms in aqueous solution. One is the acidic form, whose absorption maximum is located at ~400 nm, and the other is the basic form, which has the absorption maximum at ~450 nm. The pKa of HPTS in
the electronic ground state is about 7.2, whereas that in the first excited state drastically decreases to 0.5. Being motivated by this phototriggered change in acidity, a number of studies have been done to understand the proton transfer dynamics of HPTS in the excited state. However, most of those studies used electronic absorption and/or emission spectroscopies. Vibrational spectroscopic studies, which provide more direct information on the structure of the two forms of HPTS, are still scant.
Here, we apply nanosecond time-resolved infrared (TRIR) spectroscopy to investigate the proton transfer dynamics of HPTS in the ground state. To be able to perform TRIR measurements in aqueous solution, we utilize the nanoscale water pool of reverse micelles formed by bis(2-ethylhexyl) sulfosuccinate (known as AOT), in which HPTS is dissolved. The use of reverse micelles allows us not only to effectively decrease the immense IR absorption of water but also to control the microscopic environment of HPTS from confined water to bulk-like water by varying the water-to-surfactant ratio, W0 = [H2O]/[AOT].
Transient IR spectra of HPTS in AOT reverse micelles excited at 355 nm are recorded in the sub-s to s time regime. The average number of HPTS molecules in a single reverse micelle is adjusted to 0.8 so that no more than one HPTS molecule is included on average. It is shown that the observed dynamics is attributed to the reprotonation process of the basic form of
iv
HPTS in the ground state. We measure the decay profiles of the transient species with varying the W0 value from 7 to 25, which are fit to an exponential function. The exponential time
constant, so determined changes drastically depending on W0: that is, = 0.2 s at W0 = 7,
whereas = 2.4 s at W0 = 25. In other words, the reprotonation rate of HPTS increases as the
water pool size decreases. This result is in qualitative agreement with a diffusion model of the back proton-transfer of HPTS in the ground state. We also find that the decay profile depends on the average number of HPTS molecules present in the water pool of AOT reverse micelles.
v
Acknowledgements
研究所兩年就這樣過去了,這段日子裡大大小小的事我都經歷過了,也覺得自己真 的成長了很多,來這裡的兩年,勝過我讀大學的四年。我在這裡遇到了許多貴人,一群 把我當家人並認真教育我的貴人。在這邊我首先想要感謝的是培育我的指導教授—重藤 真介老師,老師在論文的指導上還有 meeting 及學術討論上教導了我很多我需要改正的 缺失和概念,而且更重要的,是這間 lab 讓我培養了管理時間的能力。在購買儀器和生 活方面,老師總是不顧自己,總是第一順位為學生著想。更難得的是, 老師會藉由暑假 的時間帶我們出國見習,不僅可和東大的學生們互動交流,更學習到了真正國際研討會 是如何舉行,這些點點滴滴,都是我在碩班最珍貴美好的回憶。 在這段期間,我想謝謝傳耿學長,威威學長,岡岡,塞塞,依婷,郁芳,恭惠學弟, 君甫學弟,齡勻助理,還有好多好多人,謝謝你們直到我口試最後還連番幫忙我加油打 氣,能夠認識你們一定是緣分,再來要謝謝帶我實驗的直屬學長是日本的博士後研究— 藪本宗士博士還有印度籍學長 Sudhakar,他們是我一生中最需要感謝的貴人,回想我剛 進來 lab 真的是笨手笨腳,連配藥都不會,後來博後知道我不會作實驗以後就從零開始 嚴格紮實的教我,而且在我的研究主題上給了我很多新的想法和建議,因此我在學做實 驗的過程中,也順便學習了如何獨立思考,如何解決問題,Sudhakar 學長也為了教我做 實驗,犧牲了好幾天的睡眠時間陪著我作,直到今天,博後回日本了,我終於可以獨當 一面自己做研究,自己動手操作他設計的超複雜光學儀器,我自己有一種說不出的喜悅 還有感激,直到口試結束,三位老師跟我說恭喜的那一刻,我想和兩位學長說聲 ”謝 謝,你們辛苦了!! “沒有兩位學長指導,我不可能順利走到現在。 最後要感謝的,是養育我 25 年的爸爸和媽媽,他們培育我到現在,聽了我無數的抱 怨都無怨無悔,而且還提供經濟和精神上的支柱,我能當你們的兒子真的是非常幸福。 最後,我想把這分喜悅獻給剛過世的奶奶,願妳在天之靈能看到孫子順利研究所畢業, 在那邊也過得開心。我的路還會是繼續勇敢走下去,請不用擔心。vi
Tables of Contents
Page
Abstract (in English) ... i
Abstract (in Chinese) ... iii
Acknowledgments ... v
Table of Contents ... vi
List of Figures and Tables ... vii
Chapter 1. Introduction ... 1
Chapter 2. Experimental Section ... 7
Chapter 3. Ground state Kinetics and vibrational spectra of HPTS located in AOT-reverse micelle ... 14
3.1 Introduction ... 15
3.2 Experimental ... 17
3.3 Results and Discussion ... 18
3.3.1 Steady-state spectroscopy ... 18
3.3.2 Time-resolved IR difference spectra of HPTS in AOT reverse micelles ... 19
3.3.3 Decay kinetics ... 22
Chapter 4. Summary ... 37
vii
List of Figures and Tables
Page
Fig. 1.1 Example of a Jablonski diagram representing the fate of a photoexcited molecule. .. . 5
Fig. 1.2 (a) Chemical structure of HPTS (pyranine) in its acidic form (left) and basic form (right). (b) Appearance of aqueous solution of HPTS. ... 5
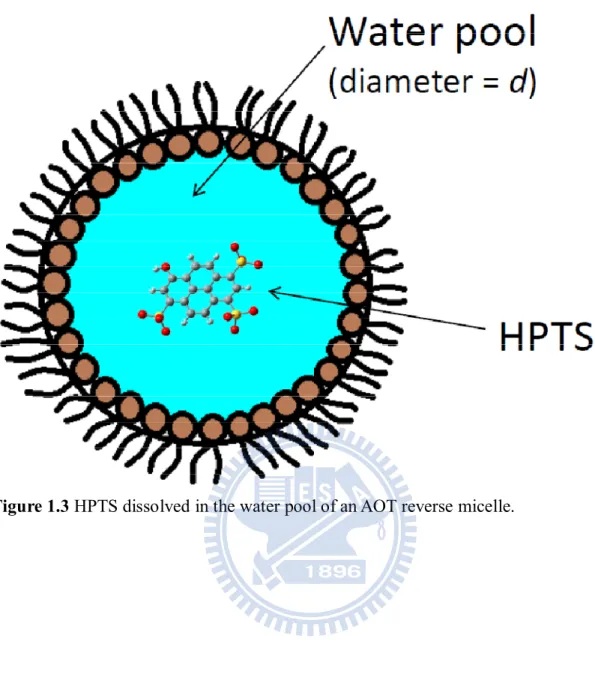
Fig 1.3 HPTS dissolved in the water pool of an AOT reverse micelle. ... 6
Fig 2.1 Schematic illustration of the ns-TRIR spectrometer. . ... 12
Fig 2.2 Components of the laboratory-built sample cell ... 13
Fig 2.3 Sample flow system using a gear pump. ... 13
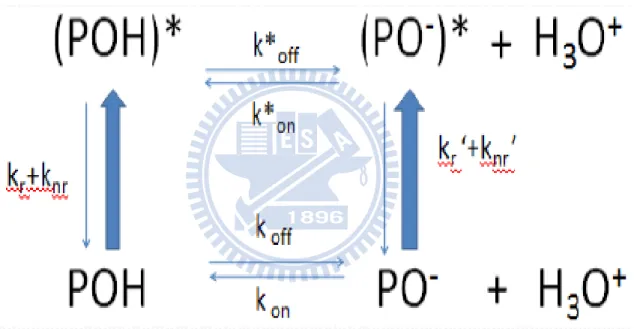
Fig 3.1 Proposed scheme of the proton transfer reactions of HPTS in the ground and first excited state. ... 25
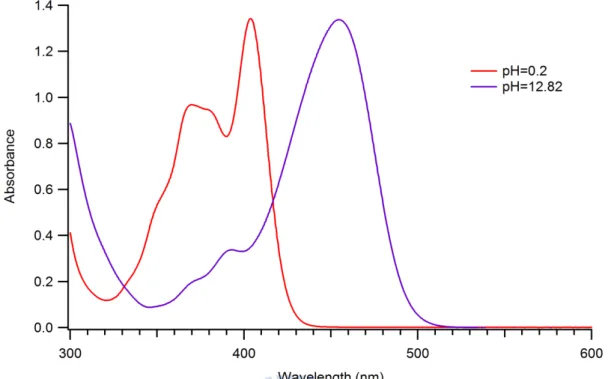
Fig 3.2 UV-vis spectra of HPTS in aqueous solution (510-5 M) obtained by adjusting pH to 0.2 and 12.82 with 0.6 M HCl or NaOH. ... 26
Fig 3.3 FTIR spectra of the acidic and basic forms of HPTS in aqueous solution (10mM) obtained by adjusting pH to 2.1 (for the acidic form) and 13.1 (for the basic form) with 0.3M HCl or NaOH. ... 26
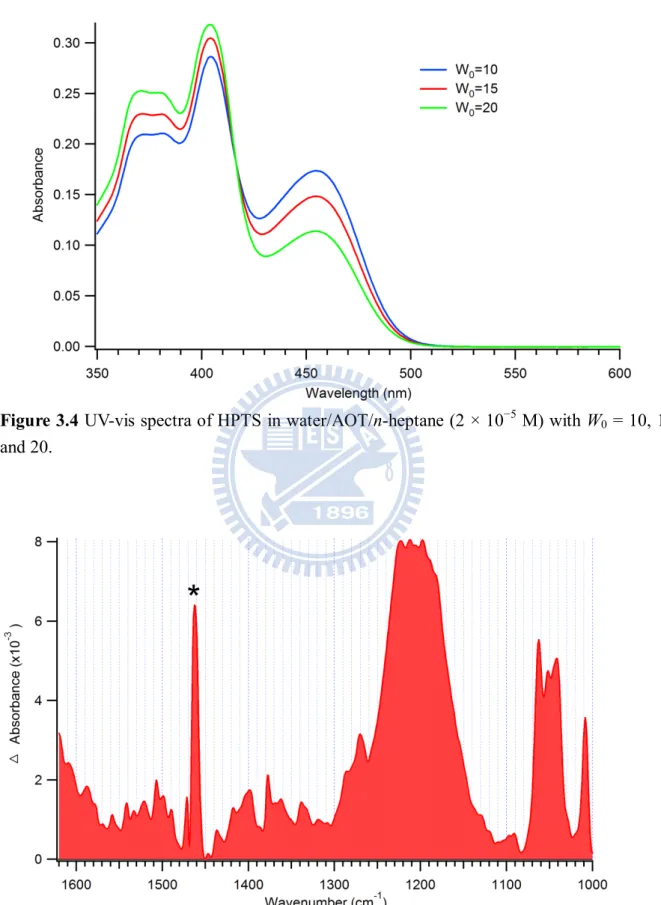
Fig 3.4 UV-vis spectra of HPTS in water/AOT/n-heptane (210-5 M) with W0 = 10, 15, and 20. ... 27
Fig 3.5 FTIR spectrum of HPTS in the W0 = 15 AOT reverse micelle. ... 27
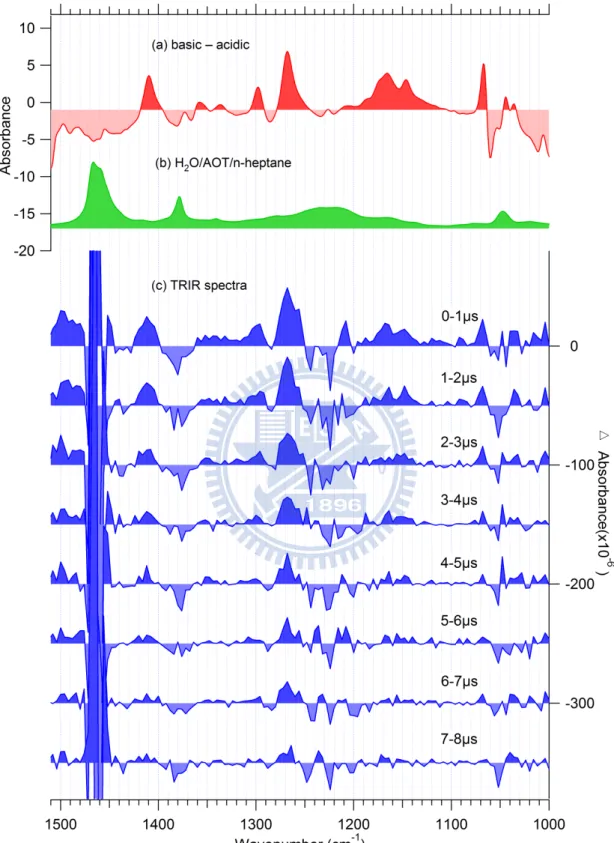
Fig 3.6 (a) Simulated IR difference spectrum, which is obtained by subtracting the FTIR spectrum of acidic HPTS (blue line in Fig. 3.3) from that of basic HPTS (red line in Fig. 3.3) by a 1:1 ratio. (b) FTIR spectrum of water/AOT/n-heptane. (c) Time-resolved IR difference spectra in the 1000–1520 cm−1 region of HPTS in the W0 = 20 AOT reverse micelle. ... 28
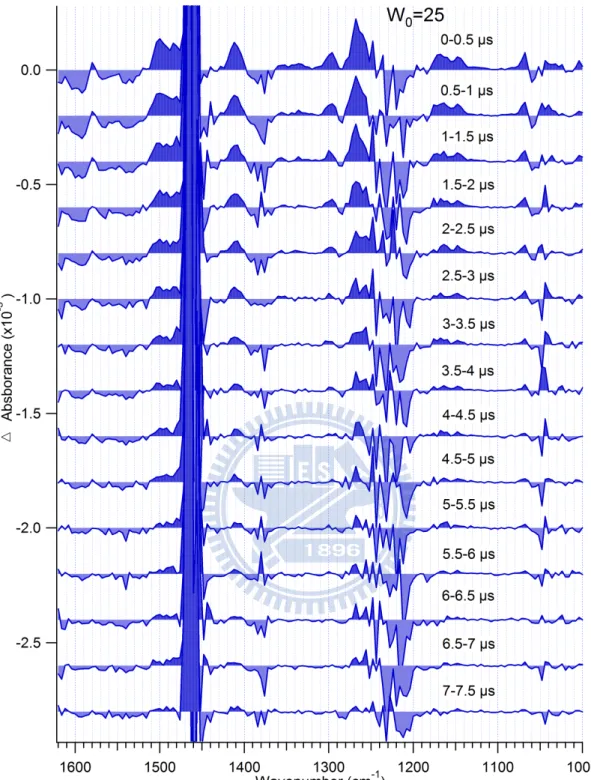
Fig 3.7 Time-resolved IR spectra in the 1000–1620 cm−1 region of HPTS in the W0 = 25 AOT reverse micelle. ... 29
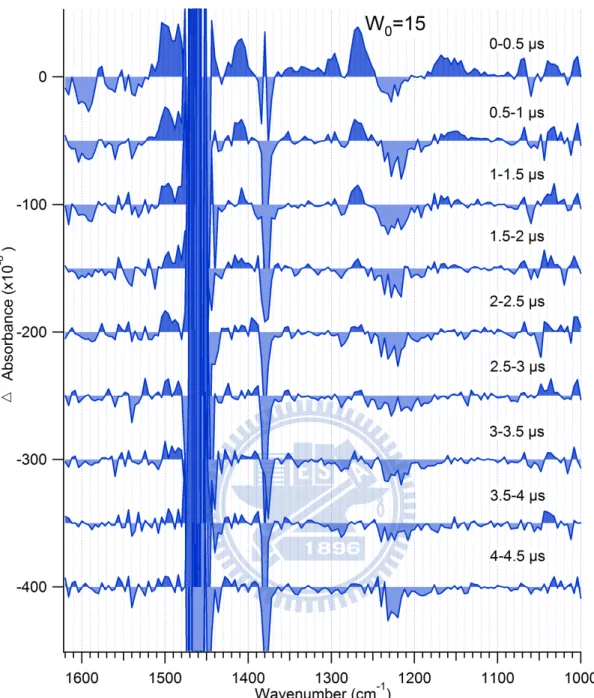
Fig 3.8 Time-resolved IR spectra in the 1000–1620 cm−1 region of HPTS in the W0 = 15 AOT reverse micelle. ... 30
Fig 3.9 Time-resolved IR spectra in the 1000–1620 cm−1 region of HPTS in the W0 = 10 AOT reverse micelle. ... 31
Fig 3.10 Time-resolved IR spectra in the 1000–1620 cm−1 region of HPTS in the W0 = 7 AOT reverse micelle. ... 32
Fig 3.11 Normalized time profile at 1268 cm−1 (black line) and the best fit to a single exponential function (red line) for the AOT reverse micelles with W0 = 7, 10, 15, 20, and 25. ... 33
Fig 3.12 Normalized time profile at 1412 cm−1 (black line) and the best fit
viii
W0 = 7, 10, 15, 20, and 25. ... 34
Fig 3.13 Exponential time constant plotted as a function of (a) the W0 value and
(b) the volume of the water pool. The solid curve is a guide to the eye. ... 35 Fig 3.14 Dependence of the time profile of the transient band at 1268 cm−1 on the
average number of HPTS molecules per reverse micelle: 1 molecule/micelle
(green); 3 molecules/micelle (blue); and 5 molecules/micelle (red). ... 36
1
Chapter 1
2
Photochemistry is important in our life, and its application is seen in a variety of materials
including solar cells, novel semiconductor materials, optical memory discs, and
photocatalysts. It is even used in medical therapies. The principle of photochemical processes
can be understood with a Jablonski diagram (Fig. 1.1), in which a ladder of the electronic
states of a molecule are represented by horizontal lines and the transitions between them are
represented by vertical arrows. Among various types of photochemical processes, proton
transfer [1-3] is one of the most fundamental phenomena and as such, it has been extensively
studied with numerous methods. In fact, proton transfer plays a central role in biology as well
as in chemistry [4-6]. For example, reactions between Brønsted acid and base may involve
proton transfer [7]. Proton pump across biological membranes includes proton transfer as
elementary steps.
In their pioneering work, Eigen [8, 9] and Weller [10] provided quantitative description of
proton transfer processes based on the analytical Smoluchowski model [11, 12].
Experimentally, the most suitable way to investigate proton transfer is to use pulsed laser light
to photoexcite (pump) a finite number of solute molecules to a higher excited state. The
photoexcitation triggers a proton transfer reaction between the proton donor and acceptor, and
subsequent dynamics is probed as a function of delay time. Such pump–probe techniques
have been used with the development of ultrafast lasers. One of the extensively used
3
as pyranine, in aqueous solution (H2O or D2O) [13, 14]. HPTS occurs as the acidic and basic
forms in acid–base equilibrium (Fig. 1.2a). It is also a fluorescent compound, which displays
yellowish-green color in aqueous solution (Fig. 1.2b). It is well-established that HPTS
behaves as a photoacid: in the ground state, pKa is about 7, but when excited to the first
excited state, it drastically reduces to 0.5. The excited-state proton transfer takes place in
roughly 150 fs in polar solvent, and the time scale depends strongly on the solvent polarity
[15]. Transient fluorescence spectroscopy has been used as a powerful technique. Prayer et al.
employed fluorescence up-conversion to study early-stage dynamics which had not been
observed [16]. In addition to these, a number of experimental and theoretical studies have
been performed on this system [17-20], in which the researchers focus mainly on photoacidic
species that would change the photoacidity as a result of receiving the energy of light.
In the present study, we employ nanosecond time-resolved infrared (ns-TRIR) spectroscopy
to study the proton transfer dynamics of HPTS in aqueous environment. TRIR measurements
in aqueous medium are a challenging task because of strong absorption of water in the mid-IR
region. To circumvent this problem, we use the water pool inside reverse micelles of
bis(2-ethylhexyl) sulfosuccinate (AOT) as aqueous environment and dissolve HPTS in it (see
Fig. 1.3). Since reverse micelles containing tiny pockets of water are dispersed in nonpolar
solvent [21], IR absorption due to water can be suppressed to a great extent compared with
4
the present case) with high sensitivity. Furthermore, reverse micelles provide unique
environment, in which water is confined to a nanoscopic volume and has unique
physicochemical properties that differ from bulk water [22-25]. It is possible to control the
size of the water pool by changing the parameter W0 = [H2O]/[AOT]. Therefore it is
interesting to examine how the proton transfer dynamics is affected by the water pool size.
Such studies will be of great help for understanding the detailed mechanism of the proton
transfer in biological water.
The rest of this thesis is organized as follows. In Chapter 2, the principle and experimental
details of nanosecond time-resolved IR spectroscopy are described. Our apparatus can achieve
the detection limit of 1 × 10⁻⁶ in absorbance change with a spectral resolution of 8 cm−1. The sample flow system used in this study is also outlined. In Chapter 3, the author presents the
results of ns-TRIR measurements on HPTS in AOT reverse micelles. The author begins by
introducing a proposed kinetic scheme for HPTS. Next, steady-state UV-vis and FTIR spectra
of the acidic and basic forms of HPTS are discussed. Finally, the author presents TRIR
spectra in the 1000–1650 cm−1 range of HPTS in AOT reverse micelles with different W0
values. The observed dynamics is attributed to the reprotonation process of the basic form of
HPTS in the ground state. Chapter 4 is meant to summarize the major outcomes of this work.
5
Figure 1.1 Example of a Jablonski diagram representing the fate of a photoexcited molecule [26].
Figure 1.2 (a) Chemical structure of HPTS (pyranine) in its acidic form (left) and basic form (right). (b) Appearance of aqueous solution of HPTS.
(b)
(a)
6
7
Chapter 2
8
2.1 Introduction
The principle of ns-TRIR spectroscopy and details of the TRIR spectrometer used in the
present study are presented. The laboratory-made sample cell, which enables sample flow
during measurement, is described as well.
2.2 Nanosecond time-resolved IR absorption spectrometer
The nanosecond time-resolved mid-IR spectrometer used here [27, 28] is composed of an
excitation laser source, an IR light source, a dispersive monochromator, a HgCdTe (MCT)
detector with an AC-coupled amplifier, and a signal processing system using a high-speed
digitizer (Fig. 2.1). This apparatus is superior to the conventional instruments in sensitivity. A
pump pulse was the third harmonic derived from a Q-switched Nd:YAG laser (IB Laser,
DiNY pQ355; wavelength, 355 nm; pulse duration, 7 ns; pulse energy, 60 μJ; and repetition
rate, 500 Hz). The laser beam was loosely focused on the sample with the beam diameter at
the focus being approximately 2 mm, which was comparable in size to the condensed IR
probe light. The probe light used here was generated from a ceramic IR emitter (JASCO). The
probe light was condensed onto the sample by a pair of off-axis ellipsoidal mirrors, and the
transmitted light was introduced to the monochromator.
After passing through the entrance slit, the probe light was dispersed by a modified
Czerny-Turner monochromator (JASCO CT-50TFP; focal length, 500 mm; f-number, 4.3).
9
manually depending on the wavenumber range of interest. Their groove density and blaze
wavelength are as follows: (i) 100 mm−1, 7.3 μm; (ii) 300 mm−1, 3 μm; and (iii) 600 mm−1, 1.2 μm. In the present study, grating (i) was used. The spectral resolution was 8 cm−1.
Next, the detection system is briefly described. The MCT detector was housed in a metal
box for electrostatic shielding. When the dispersed probe light came out of the
monochromator, it was focused on the photovoltaic MCT detector connected with a
preamplifer (Kolmar KMVP11-1-J1/DC), and the available wavenumber range of the detector
is below 2000 cm−1. The time resolution of the apparatus was determined by the response of the MCT detector, which was about 50 ns.
The output of the detector was AC-coupled by a capacitor (22 nF), followed by
amplification with a differential amplifier (NF Corporation 5305; gain, 10–1000; band width,
DC–10 MHz). By using the AC-coupled amplification, absorbance changes as small as 10−6 can be detected. The signal was then converted by the high-speed digitizer (National
Instruments 5112; dynamic range, 8 bit; sampling rate, 100 MS s−1), which was mounted on a personal computer. If the sampling rate was higher than 100 MS s−1, an oscilloscope (Tektronix, DAS 602) was used alternatively.
In addition to TRIR spectra, steady-state UV-vis and FTIR spectra were recorded on a
JASCO V-660 spectrometer and a JASCO FT/IR-6100 spectrometer, respectively. In this
10
which form, the acidic or basic form, is predominantly excited with a 355 nm pulse.
2.3 Principle of TRIR spectroscopy
A TRIR measurement consists of the following steps. Firstly, the intensity spectrum of the
probe light without the sample, I0( ) , is measured. Here is the wavenumber. Secondly, the intensity spectrum of the probe light transmitted through the sample, I( ) , is measured.
In obtaining these intensity spectra, we used an optical chopper placed in front of the entrance
slit of the monochromator in order to modulate the probe light at 800 Hz. The absorption
spectrum A( ) is calculated from I0( ) and I( ) as
0 ( ) ( ) log . ( ) I A I
(2.1)
Finally, the IR intensity change, I, caused by photoexcitation is detected at a given delay time t. The absorbance difference spectrum A( , ) t at time t is directly converted from
( , ) I t as 0 0 0 ( ) ( , ) ( ) ( , ) log ( ) ( ) ( ) ( , ) log log ( ) ( ) ( , ) ( ) log 1 , ( ) I I t A A t I I I I t I I I t A I (2.2) which yields ( , ) ( , ) log 1 . ( ) I t A t I (2.3)
11
2.4 Sample flow cell and circulation system used for TRIR measurements
Figure 2.2 shows the sample flow cell used in this study, which was composed mainly of a
cell holder made of stainless steel, CaF2 windows, a thin lead spacer 100 µm thick, and
Kalrez® O-rings. CaF2 windows were selected because of the high transparency in
extensively wide wavelength range from ultraviolet to mid-IR. As shown in Fig. 2.3, the
sample was circulated by a gear pump (Micropump). To flow the sample properly, the flow
rate was adjusted to approximately 20 cm s−1. If the flow rate is much higher than this value, the flow may cause an internal pressure increase and eventually damage the windows. In
contrast, a much smaller flow rate would result in multiple excitation of the same molecule
before it fully recovers to its original state.
12
13
Figure 2.2 Components of the laboratory-built sample cell. (A) CaF2 windows. (B) Stainless
steel cell holder. (C) Karlez® O-rings.
14
Chapter 3
Ground-State Proton Transfer Dynamics of
HPTS in AOT Reverse Micelles:
15
3.1 Introduction
In this chapter, a ns-TRIR study of the proton transfer dynamics of HPTS in AOT reverse
micelles is presented. HPTS is well-known as a photoacid in aqueous solution. As shown in
Fig. 1.1, HPTS in aqueous solution exists as the acidic or basic form in equilibrium. The two
forms interconvert with each other depending on pH conditions. Note that there are three
negative formal charges at the sulfonate groups. At pH < 7, the absorption spectrum of HPTS
exhibits a peak at 405 nm, which is ascribed to the acidic form (POH), whereas at pH > 7, it
exhibits an additional band at 450 nm, which arises from the basic form (PO−). Because of these interesting properties, HPTS has attracted considerable attention of chemists. In
particular, many researchers have studied excited-state proton transfer of HPTS in different
solvents by means of various spectroscopic techniques [29].
The photochemistry of HPTS including proton transfer can be summarized as Fig. 3.1. In
the ground state, POH and PO− are in equilibrium. The protonation and deprotonation rates are denoted kon and koff, respectively. The pKa is known to be ~7.2. As will be shown later, the
355 nm light predominantly excites the acidic (POH) form of HPTS. Upon photoexcitation,
POH is pumped to the first excited state (POH*). POH* either relaxes back to the ground
state via a radiative (kr) or nonradiative (knr) decay, or releases its proton with a rate constant
of koff*, forming PO−*. The pKa in the excited state, pKa*, is only 0.5. The PO−* produced
16
constant of kon* or undergoes a radiative (kr′) or nonradiative (knr′) transition to form PO−.
These dynamics have been shown to take place within picosecond to nanosecond time scales.
The proton transfer dynamics in both ground and excited states should depend on solvent.
Water in AOT reverse micelles (Fig. 1.3) provides unique aqueous environment that is quite
different from bulk water. In nonpolar solvent such as n-heptane or CCl4, AOT molecules
form a spherical aggregate with their hydrophobic alkyl chains heading outward and
hydrophilic headgroups inward, which embraces a nanoscale water pool. The most important
parameter that characterizes the dimension of reverse micelles and hence of the water pool is
the molar ratio, W0, of water to AOT:
W0 = [H2O]/[AOT]. (3.1)
The size of the water pool has been shown to have an empirical linear relationship with W0 as
[30]
d = 0.29W0 + 1.1 (nm) 3 < W0 < 20 , (3.2)
where d is the diameter of the water pool of the AOT reverse micelle. In the present study, W0
is varied from 7 to 25, which correspond to d = 3.1 nm to 8.3 nm.
3.2 Materials and methods
1-hydroxy-3,6,8-pyrenetrisulphonic acid trisodium salt (>97%), sodium bis(2-ethylhexyl)
sulfosuccinate (>99%), and n-heptane (>99%) used as nonpolar solvent were purchased from
17
concentration of HPTS was 0.7 mM for all W0 values, and the AOT concentration was 0.23 M.
The sample preparation protocol is given as follows. First, we took a certain amount of HPTS
and dissolved it in a small volume of water at the fixed concentration (0.7 mM). Then, we
added the aqueous solution of HPTS to n-heptane using a volumetric flask of 50 mL, forming
a water–oil emulsion. Finally, AOT was dissolved in this emulsion and the mixture was
vigorously stirred with a magnetic stirrer for 0.5–1 h. For suspensions with smaller W0, much
longer time was required for stirring.
It is important to control the number of HPTS molecules per reverse micelle. In the
present study, we adjusted the HPTS concentration such that there is no more than one HPTS
molecule per reverse micelle on average. In fact, we set the average number of HPTS
molecule per reverse micelle as ~0.8, implying that the number of HPTS molecule contained
in the water pool is at most one. Under these conditions, the preparation of the W0 = 7 reverse
micelle was most difficult; the suspension easily showed an opaque appearance and ended up
with phase separation. A successful suspension looked transparent and pale green (the color of
HPTS).
The experimental setup for ns-TRIR spectroscopy has already been described in Chapter 2.
The time resolution of the apparatus was estimated to be about 50 ns. Spectral acquisition was
controlled by a program coded in IGOR Pro 5 (WaveMetrics). Spectral analysis was also
18
3.3 Results and discussion
3.3.1 Steady-state spectra
(1) HPTS in aqueous solution
Figure 3.2 displays UV-vis spectra of HPTS in aqueous solution at pH 0.2 and 12.8. The
spectrum at pH 0.2 shows an absorption maximum at ~400 nm, and that at pH 12.8 has a
maximum at ~455 nm. The former corresponds to the acidic form of HPTS, whereas the latter
corresponds to the basic form. The ratio of the absorbance of the acidic and basic HPTS at
355 nm is roughly 6:1, so the acidic HPTS is mainly excited by the 355 nm light.
Figure 3.3 shows FTIR spectra of the acidic and basic HPTS in aqueous solution, which
were obtained by adjusting pH to 2.1 and 13.1, respectively. Because the structural difference
between the acidic and basic forms concern only the hydroxyl group, the IR spectra of the two
forms resemble one another. However, the spectral window between 1250 and 1500 cm−1 does show sharp distinctions between the two forms.
(2) HPTS in AOT reverse micelles
Figure 3.4 shows UV-vis spectra of HPTS in water/AOT/n-heptane with different W0
values (W0 = 10, 15, and 20). These UV-vis spectra are reasonably represented by a
superposition of the POH and PO− spectra shown in Fig. 3.2. Therefore the band at ~450 nm originates from the basic form and that below ~400 nm from the acidic form. An isosbestic
19
ground state changes with W0. As the reverse micelle becomes larger, the concentration of the
acidic form increases, and concomitantly, that of the basic form decreases. This result
suggests that the ability of the acidic form to release the proton is closely related to the size of
the water pool: as W0 increases, the acidity of the water pool increases. This change also
accompanies the variation in pKa. In steady-state fluorescence spectra [31], the tendency is
opposite to what is found in the absorption spectra (Fig. 3.4). This reversed tendency can be
understood as follows. When W0 increases, pKa* decreases and in turn the excited-state
proton-transfer rate (koff*) increases. Consequently, a more amount of PO−* will be formed
rapidly and emit fluorescence [32]. Is this also true for the ground state? We will address this
question in Section 3.3.3.
Figure 3.5 displays the FTIR spectrum of HPTS in the W0 = 15 AOT reverse micelle. The
IR spectrum of water/AOT/n-heptane has been subtracted off as background. Because of the
low concentration of HPTS in the reverse micelle suspension, the signal-to-noise ratio (S/N)
is not good in this spectrum. Nevertheless, as expected, the main characteristics of the IR
spectrum can be accounted for by the absorption bands observed in the spectra of the acidic
and basic forms shown in Fig. 3.3.
3.3.2 Time-resolved IR difference spectra of HPTS in AOT reverse micelles
Time-resolved IR difference (A) spectra of HPTS in water/AOT/n-heptane at W0 = 20
20
steady-state FTIR spectrum of water/AOT/n-heptane (Fig. 3.6b). To simulate the difference
spectrum (Fig. 3.6a), we subtracted the FTIR spectrum of POH (blue line in Fig. 3.3) from
that of PO− (red line in Fig. 3.3) by a 1:1 ratio. Because we used the IR spectra of HPTS in aqueous solution instead of those in AOT reverse micelles, which were too difficult to be
observed, the simulated spectrum does not represent the true difference spectrum in AOT
reverse micelles. However, it serves as a reference spectrum useful for assigning the observed
transient bands as well as the bleach signals. In Fig. 3.6b, the bands at ~1460 and 1380 cm−1 are assigned to n-heptane, and those that appear between 1180 and 1250 cm−1 and at ~1050 cm−1 are assigned to AOT. These solvent and surfactant bands may cause thermal artifacts in TRIR spectra, masking the HPTS signal.
Now we turn to the TRIR spectra of HPTS in AOT reverse micelles (Fig. 3.6c). First of all,
we would like to note that challenging TRIR measurements in aqueous medium has been
made possible by utilizing the reverse micelle system. In Fig. 3.6c, positive features are seen
in the following wavenumber regions: ~1070 cm−1, 1140–1200 cm−1, 1250–1280 cm−1, 1280–1320 cm−1, 1400–1430 cm−1, and >1480 cm−1. These bands rise instantaneously within the first 1s and decay away in 10 s. A positive signal in TRIR spectra represents the
transient absorption of a newly generated species upon photoexcitation. A careful comparison
with Fig. 3.6a reveals that these wavenumbers coincide well with the positive bands in the
21
transient bands to the basic form of HPTS in the ground state (PO−). This interpretation is consistent with the proposed kinetic scheme (Fig. 3.1). Within an excitation pulse,
photoexcited acidic HPTS undergoes proton transfer to form PO−* and this PO−* relaxes to its ground state. The dynamics that we have observed here is, therefore, the reprotonation
process of PO− to produce POH. In addition to the transient absorption of PO−, a bleaching due to the depletion of the POH population should also be observed. However, probably
because the IR bands of the acidic HPTS are located near the regions where there are
solvent/AOT bands, they are severely obscured by the thermal artifacts. Detailed mode
assignments of the observed IR bands of PO− are not fully understood yet; these bands are a composite of many vibrational modes such as pyranine stretches and in-plane deformations
and the C–O stretch [15].
Time-resolved data for W0 = 25, 15, 10, and 7 are shown in Figs. 3.7–10. Except for worse
S/N with decreasing W0, the spectral pattern is overall similar; the location of the transient IR
bands remains the same and almost no band shift is found. An interesting observation which
attracted our attention is that the decay kinetics of the transient bands depends largely on W0.
The transient bands of the basic form of HPTS in the W0 = 25 reverse micelle show a slower
decay than in the W0 = 7 reverse micelle. To obtain quantitative information on this
phenomenon, we analyze the time profiles of the two major transient bands at 1268 and 1412
22
3.3.3 Decay kinetics
Figures 3.11 and 3.12 display the normalized time profiles of the transient bands at 1268
and 1412 cm−1, respectively, for W0 = 7, 10, 15, 20, and 25. In both cases, it is evident that the
decay of the transient band is accelerated as W0 decreases. Although several model functions
for the protonation/deprotonation dynamics of HPTS in both ground and excited states have
been proposed, we phenomenologically fit the decaying component of the observed time
profile to a single exponential with time constantThe time constant, which is an apparent
lifetime of the basic form of HPTS (PO−), is determined at each W0, as shown in Table 1. The
water pool volume V was calculated using Eq. 3.2, i.e., V =d3/6. The uncertainties in the time constant are standard deviations of the value derived from two independent runs.
Figure 3.13 plots the time constant as a function of W0 (panel a) and V (panel b). The –W0
plot shows a nearly linear dependence. When plotted against the water pool volume, which
may be a more relevant quantity, the time constantdisplays a more characteristic behavior.
In Fig. 3.13b, we fit the dependence to an exponential in order to give a guide to the eye. We
do not have solid rationale for the exponential fitting, but the behavior is described fairly well
by this function. In the AOT reverse micelle, it is likely that Coulombic repulsive interactions
between trinegatively charged HPTS and the AOT headgroup make HPTS stay near the core
of the water pool rather than the interfacial region. Therefore, as the water pool size becomes
23
asymptotic behavior of the –V curve is consistent with this interpretation. Similar behaviors
have been found in NMR [24] and IR [23] studies of water in reverse micelles, showing the
spectral shift toward bulk water with increasing W0. According to previous studies, it is found
that the properties of water confined to smaller reverse micelles, such as diffusive motion of
water molecules, differ substantially from those of bulk water. For instance, Hasegawa et al.
[33] measured the viscosity of water inside reverse micelles and found that it increases with
decreasing the W0 value. Zhang and Bright [34] also reached a similar conclusion based on
their study of nanosecond time-resolved fluorescence spectroscopy using a fluorescent probe,
1,8-anilino-8-naphthalenesulfonic acid (ANS).
The UV-vis spectra (Fig. 3.4) show that an increase in the W0 value produces more acidic
and less basic forms of HPTS in the ground state [22], making the equilibrium constant, K =
[PO−][H+]/[POH], larger. Using the relation K = koff/kon (see Fig. 3.1), this leads to a slower
recombination rate in the ground state, which is consistent with our TRIR results.
The fact that the time profile of the basic HPTS is well-explained by assuming a single
exponential is suggestive of geminate recombination [35, 36]:
1 2
1 2
geminate pair separated pair
POH k PO H k PO H
k k
(3.3)
Unfortunately, the S/N of our time-resolved data, in particular at lower W0, does not allow
us to analyze in more detail the decay kinetics and to discuss the underlying reaction
24
the observed dynamics will be made feasible if the quality of the data is improved at least by
an order of magnitude; it is left for the future study.
Another interesting thing to note is the finding that the decay profile is affected by the
average number of HPTS molecules in the water pool. This is illustrated in Fig. 3.14. Here we
measured the time profile of the transient band at 1268 cm−1 in the W0 = 20 reverse micelle
with an average number of one, three, and five HPTS molecules per reverse micelle. The
1268 cm−1 transient appears to decay faster as the average number of HPTS per reverse micelle increases from one to five. Furthermore, the decay profile shows a deviation from an
exponential when there are more than one HPTS molecules in the water pool, implying that
the dynamics of HPTS inside the water pool may be more complicated compared to the case
of one HPTS molecule per reverse micelle. A possible account for this observation is that
direct interactions between HPTS molecules are not negligible for the case of more than one
HPTS molecules. Such a process will compete with proton transfer, so it is crucial to control
25
Table 1.1 W0 dependence of the exponential time constant
W0 7 10 15 20 25
Water pool volume
(10−20 cm3) 1.61 3.35 8.48 17.2 126
s 0.2 (±0.1) 0.6 (±0.1) 1.0 (±0.1) 1.8 (±0.1) 2.4 (±0.1)
Figure 3.1 Proposed scheme of the proton transfer reactions of HPTS in the ground and first excited state. POH and PO− are the acidic and basic forms of HPTS, respectively. kon and koff
are the protonation and deprotonation rates, respectively. Asterisks designate the excited-state species and properties.
26
Figure 3.2 UV-vis spectra of HPTS in aqueous solution (5 × 10⁻⁵ M) obtained by adjusting pH to 0.2 and 12.82 with 0.6 M HCl or NaOH. The former corresponds to the acidic form and the latter to the basic form.
Figure 3.3 FTIR spectra of the acidic and basic forms of HPTS in aqueous solution (10 mM) obtained by adjusting pH to 2.1 (for the acidic form) and 13.1 (for the basic form) with 0.3 M HCl or NaOH.
27
Figure 3.4 UV-vis spectra of HPTS in water/AOT/n-heptane (2 × 10⁻⁵ M) with W0 = 10, 15,
and 20.
Figure 3.5 FTIR spectrum of HPTS in the W0 = 15 AOT reverse micelle. The spike marked
with an asterisk is a subtraction artifact.
28
Figure 3.6 (a) Simulated IR difference spectrum, which is obtained by subtracting the FTIR spectrum of acidic HPTS (blue line in Fig. 3.3) from that of basic HPTS (red line in Fig. 3.3) by a 1:1 ratio. (b) FTIR spectrum of water/AOT/n-heptane. (c) Time-resolved IR difference spectra in the 1000–1520 cm−1 region of HPTS in the W0 = 20 AOT reverse micelle.
29
Figure 3.7 Time-resolved IR spectra in the 1000–1620 cm−1 region of HPTS in the W0 = 25
30
Figure 3.8 Time-resolved IR spectra in the 1000–1620 cm−1 region of HPTS in the W0 = 15
31
Figure 3.9 Time-resolved IR spectra in the 1000–1620 cm−1 region of HPTS in the W0 = 10
32
Figure 3.10 Time-resolved IR spectra in the 1000–1620 cm−1 region of HPTS in the W0 = 7
33
Figure 3.11 Normalized time profile at 1268 cm−1 (black line) and the best fit to a single exponential function (red line) for the AOT reverse micelles with W0 = 7, 10, 15, 20, and 25.
34
Figure 3.12 Normalized time profile at 1412 cm−1 (black line) and the best fit to a single exponential function (red line) for the AOT reverse micelles wit h W0 = 7, 10, 15, 20, and 25.
35
Figure 3.13 Exponential time constant plotted as a function of (a) the W0 value and (b) the
volume of the water pool. The solid curve is a guide to the eye.
(a)
36
Figure 3.14 Dependence of the time profile of the transient band at 1268 cm−1 on the average
number of HPTS molecules per reverse micelle: 1 molecule/micelle (green); 3 molecules/micelle (blue); and 5 molecules/micelle (red).
37
Chapter 4
38
Proton transfer dynamics of ground-state HPTS in AOT reverse micelles has been studied
by utilizing ns-TRIR spectroscopy. The author has been successful in performing TRIR
measurements in aqueous environments, which are technically very difficult. Additionally,
there were a lot of difficulties in preparing AOT reverse micelle suspensions containing HPTS,
because once the concentration ratio among HPTS, AOT, and water is out of some acceptable
range, the equilibrium is disturbed and the suspension no longer shows a homogeneous
appearance. Fortunately, we also settled this problem even at low W0. The author has
measured the time-resolved IR spectra in the 1000–1600 cm−1 region (fingerprint region) for the W0 = 7, 10, 15, 20, 25 reverse micelles and found that the decay time-constant
(recombination rate) decreases (increases) with decreasing the water pool size.
In the final part of Chapter 3, the author showed another interesting finding that the time
profile of the transient species is dependent on average number of HPTS molecules inside a
single reverse micelle. This finding indicates that the number of solute molecules in the
reverse micelle needs to be controlled in order to obtain the correct picture of the dynamics
that takes place in the reverse micelle. The author used a single exponential function to fit the
observed decay kinetics, which is suggestive of a pseudo first-order reaction. This should be
confirmed with more experiments.
The proton transfer of HPTS in reverse micelles has been extensively studied with
39
found a similar dependence of the reprotonation rate on W0, although they do not show the
actual decay kinetics for each W0 reverse micelle. The original goal of this study is to look at
transient absorbance changes in the O–H stretch (or O–H bending) region of water upon
photoexcitation of HPTS. Such a direct investigation of water in relation to proton transfer is
not possible with fluorescence techniques. The author has tried a TRIR measurement in the
O–H stretch region several times, but unfortunately it has not been successful so far probably
because the water absorption is still too strong even in reverse micelles. Using HOD in H2O
40
References
[1] C.-C. Hsieh, Y.-M. Cheng, C.-J. Hsu, K.-Y. Chen, P.-T. Chou, J. Phys. Chem. A, vol. 112, pp. 8323-8332, 2008.
[2] S. Kundu, S. C. Bera, N. Chattopadhyay, SPECTROSCOPY LETTERS, vol. 30, pp. 1023-1035, 1997.
[3] P. Leiderman, L. Genosar, D. Huppert, J. Phys. Chem. A, vol. 110, p. 12, 2006. [4] B. Cohen et al., J. Phys. Chem. B, vol. 115, pp. 7637-7647, 2011.
[5] P. Scherrer, Biochemistry, vol. 33, pp. 13684-13692, 1994. [6] A. K. Dioumaev, Biochemistry, vol. 41, pp. 5348-5358, 2002.
[7] T. Förster, S. Völkera., CHEMICAL PHYSICS LETTERS vol. 34, p. 6, 1975. [8] W. K. M. Eigen, L. De Maeyer, Progr. React. Kinet., vol. 2, 1964.
[9] M. Eigen, Angew. Chem. Int. Ed., vol. 3, 1964. [10] A. Z. Weller, Phys. Chem, vol. 17, p. 224, 1958.
[11] D. B. Spry, A. Goun, K. Glusac, D. E. Moilanen, M. D. Fayer, Journal of the American Chemical Society, vol. 129, pp. 8122-8130, 2007.
[12] N. Agmon, J. Chem. Phys, vol. 88, p. 4, 1988.
[13] D. B. Spry, J. Phys. Chem. A, vol. 111, pp. 230-237, 2007.
[14] B. J. Siwick, H. J. Bakker, J. AM. CHEM. SOC., vol. 129, pp. 13412-13420, 2007. [15] O. F. Mohammed et al., ChemPhysChem, vol. 6, pp. 625-636, 2005.
[16] C. Prayer, T. Gustavsson, T. H. Tran-Thi., "Fast Elementary Processes in Chemical and Biological Systems," 54th International Meeting of Physical Chemistry, 1996. [17] Noam Agmon, J. Chern. Phys., vol. 88, p. 4, 1988.
[18] J. McKiernan, E. Simoni, B. Dunn, J. I. Zink, J. Phys. Chem., vol. 98, pp. 1006-1009, 1994.
[19] D. B. Spry, M. D. Fayer, THE JOURNAL OF CHEMICAL PHYSICS, vol. 128, p. 9, 2008.
41
[20] P. Leiderman, L. Genosar, D. Huppert., J. Phys. Chem. A, vol. 109, p. 13, 2005. [21] T. K. De, A. Maitra, Adv. Colloid Interface Sci., vol. 59, pp. 95-193, 1995. [22] M. Hasegawa, Langmuir, vol. 17, pp. 1426-1431, 2001.
[23] Quan Li, S. Weng, J. Wu, N. Zhou, J. Phys. Chem. B, vol. 102, pp. 3168-3174, 1998. [24] B. Baruah et al., J. AM. CHEM. SOC., vol. 128, pp. 12758-12765, 2006.
[25] I. R. Piletic, D. E. Moilanen, D. B. Spry, N. E. Levinger, M. D. Fayer., J. Phys. Chem. A, vol. 110, pp. 4985-4999, 2006.
[26] D. Roya, R. Karmakara, S. K. Mondala, K. Sahua, K. Bhattacharyya, Chemical Physics Letters, vol. 399, pp. 147-151, 2004.
[27] T. Yuzawa, C. Kato, M. W. George, H.-O. Hamaguchi., Applied Spectroscopy, vol. 48, pp. 684-690, 1994.
[28] S. Yabumoto, S. Shigeto, Y.-P. Lee, H.-o. Hamaguchi, Angew. Chem. Int. Ed., vol. 49, pp. 1-6, 2010.
[29] S. S. Mojumdar, T. Mondal, A. K. Das, S. Dey, K. Bhattacharyya, THE JOURNAL OF CHEMICAL PHYSICS, vol. 132, p. 8, 2010.
[30] T. Kinugasa et al., Colloids and Surfaces A: Physicochem. Eng. Aspects, vol. 204, pp. 193-199, 2002.
[31] E. Bardez, B. T. Goguillon, E. Keh, B. Valeur, J. Phys. Chem, vol. 88, pp. 1909-1913, 1984.
[32] D. B. Spry, A. Goun, K. Glusac, D. E. Moilanen, M. D. Fayer, J. AM. CHEM. SOC., vol. 129, pp. 8122-8130, 2007.
[33] M. Hasegawa, T. Sugimura, Y. Suzaki, Y. Shindo, A. K. Yuzawa., The Journal of Physical Chemistry, vol. 98, pp. 2120-2124, 1994.
[34] J. Zhang and F. V. Bright, The Journal of Physical Chemistry, vol. 95, pp. 7900-7907, 1991.
42
[35] N. Agmon, D. Huppert, A. Masad, E. Pines,J. Phys. Chem, vol. 95, pp. 10407-10413, 1991.
![Figure 1.1 Example of a Jablonski diagram representing the fate of a photoexcited molecule [26]](https://thumb-ap.123doks.com/thumbv2/9libinfo/8243121.171407/15.892.199.738.117.485/figure-example-jablonski-diagram-representing-fate-photoexcited-molecule.webp)