行政院國家科學委員會專題研究計畫 期中進度報告
子計畫二:智慧型生理訊號監控系統(2/3)
計畫類別: 整合型計畫
計畫編號: NSC94-2218-E-009-006-
執行期間: 94 年 10 月 01 日至 95 年 09 月 30 日
執行單位: 國立交通大學電機與控制工程學系(所)
計畫主持人: 楊谷洋
共同主持人: 林進燈
報告類型: 精簡報告
報告附件: 出席國際會議研究心得報告及發表論文
處理方式: 本計畫可公開查詢
中 華 民 國 95 年 7 月 28 日
智慧型生理訊號監控系統
Intelligent Physiological Signal Monitoring System
摘 要
以往多通道腦波量測記錄儀存在著面 積龐大、使用不便以及攜帶不易等問題,且這 些系統大多只做到記錄部分,再藉由電腦進行 後續離線處理。本報告結合腦波訊號放大器、 無線傳輸及嵌入式系統等技術,開發一套可攜 式即時嵌入式無線腦波訊號感測與處理系統 以實際應用於日常生活當中。 本系統之開發流程分為三個階段,分別 為 「 腦 電 位 訊 號 量 測 與 藍 芽 無 線 傳 輸 」、 「OMAP 嵌入式系統平台建構」、「腦波訊號處 理之實現與應用」。首先是以藍芽協定做為傳 輸介面,並整合生理量測放大器電路,將所量 測 的腦電 位訊 號進行 無線 傳輸。 其次 ,以 OMAP 為發展平台,並於上開發一套適合用 於雙核心架構處理器- OMAP 的即時嵌入式 作業系統來無線接收腦電位訊號。最後,本研 究在此嵌入式系統中利用 DSP Gateway 機制 將腦波分析演算法交由 ARM 和 DSP 分工處 理,建構一駕駛員精神認知狀態系統,以驗證 其即時進行駕駛員精神認知狀態估測之能力。ABSTRACT
In this study, a portable real-time wireless embedded brain signal acquisition/processing system is developed. The proposed system integrates electro- encephalogram signal amplifier technique, wireless transmission technique, and embedded real-time system. The development strategy of this system contains three parts: First, the Bluetooth protocol is used as a transmission interface and integrated with the bio-signal amplifier to transmit the measured physiological signals wirelessly. Second, the OMAP (Open Multimedia Architecture Platform) is used as a development platform and an embedded operating system for OMAP is also designed. Finally, DSP Gateway is developed as a mechanism to deal with the brain-signal analyzing tasks shared by ARM and DSP. A driver’s cognitive-state estimation program has been developed and implemented on the proposed dual core processor-based real time wireless embedded system for demonstration. KEYWORD : Embedded System, Bluetooth, ARM, DSP, Linux, DSP Gateway, Brain Computer Interface, Brain Signal Processing
報告內容
With the development of embedded system and signal processing technique, there is a tendency to apply the embedded system technique to Brain Computer Interface (BCI). An electroencephalogram-based Brain Computer Interface (EEG-based BCI) provides a novel concept for the communication between the human brain and the computer [1-4]. Traditionally, the variations of brain waveforms are measured on subject’s scalp by the PC-based measuring instruments. For the inconvenience of using PCs for instant computing, we need to develop wearable and inexpensive Brain Computer Interface systems—small devices with long battery life that can be carried indoors or outdoors [5]. Real-time and embedded systems offer a better platform to build wearable and inexpensive BCI systems, their limited processor and memory resources are efficiently utilized. The application may be easy to migrate to newer platforms whenever smaller and more powerful devices are developed.
Since the processing of the EEG data analysis needs a large number of calculations, the computing ability of the embedded processor becomes important when choosing a suitable embedded processor. So we consider the DSP processor as a coprocessor with ARM (Advance RSIC Machines). In this study, we developed an embedded Brain Computer Interface system. One of the main discrimination of the implemented BCI system is wireless transmission which is more convenience for users. Another reason is that dual-core embedded processor increases working performance and is able to save computing time.
I. SYSTEM ARCHITECTURE
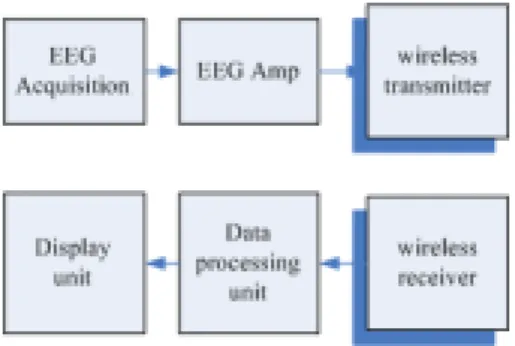
In this study, the overall system we developed can be divided into three units: (1) signal acquisition and amplifying unit, (2) wireless data transmission unit, and (3) dual core processing and display unit. The block diagram of the proposed system is given in Fig. 1.
Fig. 1. Block diagram of the BCI system. A. Signal Acquisition and Amplifying Unit
The signal acquisition and amplifying unit is used to measure the EEG signal and filter out the noise. The block diagram of the unit is shown in Fig. 2. The EEG amplifying circuit was structured of a pre-amplifier with the gain of 100, an isolated amplifier to protect the subject, a band-pass filter to reserve 1-100Hz which was composed of a low-pass filter and a high-pass filter, a differential amplifier which had the gain of ten or fifty (which can be chosen by a switch), and a 60Hz notch filter to eliminate the effect of the plug artifact.
Fig. 2. Block diagram of the signal acquisition and amplification unit.
Fig. 3. The signal acquisition and amplification unit The signal acquisition and amplification unit is shown in Fig. 3. The EEG was recorded uni-polarly from 2 gold-electrodes fixed on the forehead of the subject. The EEG signal is recorded with 343Hz sampling rate (8-bit resolution), the signal is then transmitted to the
data processing unit by wireless data transmission unit.
B. Wireless Data Transmission Unit
Fig.4 shows the wireless data transmission unit which converts the analog signal to digital signal, and then it encodes and transmits through the wireless transmitter and receiver. To do that, we use ALTERA FLEX10K EPF10K10TC144-3 CPLD (Complex Programmable Logic Device) to control the A/D converter and encode the data for the transmitter which is shown as Fig.5. We choose the Bluetooth devices as the wireless transmitter and wireless receiver, because of three advantages: (1) low transmission power, (2) the insensibility of the noise, and (3) higher security. The characteristics of the Bluetooth are shown in the Table I.
TABLE I
The specifications oh the Bluetooth device Frequency band ISM band, 2.4GHz Bandwidth 1M Hz
Spread Spectrum method FHSS (Frequency Hopping Spread Spectrum)
Frequency of Frequency
hopping. 1600 times/sec (625 us/slot) Transmission distance 10-100 meter
Modulation method GFSK (Gaussian Frequency Shift Keying) Connection interface USB, UART
Fig.4 . Block diagram of the wireless data transmission unit.
Fig. 5. The data transmit unit. C. Dual-core Processing and Display Unit
The dual-core processing and display unit is the main part of the portable real-time wireless embedded brain signal acquisition/processing system. The operating core is TI (Texas Instruments) OMAP (Open Multimedia
Architecture Platform) 1510, which is composed of ARM925 and TMS320C55x DSP core. Fig.6 shows Innovator Development Kit which is a development platform produced by TI. A DSP processor is helpful for EEG data processing with a large number of mathematical calculations. In this study, the DSP processor processes EEG data and the ARM925 communicates with the other devices, such as wireless receiver devices and network. The DSP Gateway is used as the cooperation structure for communication between the two cores since the two processors have different functions.
Fig. 6. Innovator Development Kit
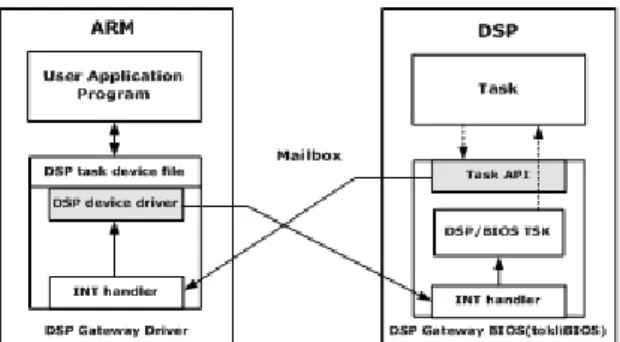
DSP Gateway connects the ARM core with the DSP core, it can be considered as a software layer which is placed at two cores. DSP gateway makes ARM core possible to use resource of DSP core by API (Application Program Interface), and works like a small real-time kernel which manages the source and data flow in the DSP core. By this method, it drives the DSP core only when we need to process the EEG data. The Linux operating system is built to manage the resource of ARM core. The architecture of the DSP Gateway is shown as Fig. 7.
The function of ARM core can be divided into three parts: (1) wireless receiver control, (2) TCP/IP control, and (3) DSP Gateway driver. The analysis algorithm is designed in the DSP processor, which will be introduced in next section. A display module is designed to display the analysis output and the original EEG wave signals on PC. The block diagram of the dual-core processing and display Unit is shown in Fig. 8.
Fig.7 . The structure of DSP Gateway
DSP ARM wireless receiver control
DSP Gateway BIOS PC Java NFS TCP/IP Estimate Algorithm DSP Gateway driver wireless receiver Task management TCP/IP
OMAP
LCD displayFig.8 . Block diagram of the dual-core processing and display unit.
II. ANALYSIS ALGORITHM
In this study, the proposed system was used to acquire the driver’s EEG signals and drowsiness condition of the driver was to be estimated via automatic EEG analysis. In order to test and verify our analysis algorithm, we built an experiment environment first. Recently, driving safely has received increasing attention of the publics due to the growing number of traffic accidents. Drivers’ fatigue has been implicated as a causal factor in many accidents because of the marked decline in the drivers’ abilities of perception, recognition and vehicle control abilities while sleepy. In this study, we use this system and implement an algorithm to detect the drowsiness of the driver accurately.
A VR-based dynamic driving simulation environment and a 6-DOF dynamic Stewart motion platform were used to simulate the situation of the driving in the highway, and measure the EEG signals of the subject. The 3-D highway driving scene is shown as Fig. 9. The four lanes from left to right are separated by a median stripe. The subject must keep the car in the middle of the third lane, and the car is driven at a fixed speed of 100 km/hr on the highway. The car is randomly drifted away from the cruising lane to the mimic consequences of a non-ideal road surface.
is based on the driving error of the subject, because it is not easy to keep the car in the middle of the cruising lane if the subject is drowsy. Previous studies [6-7] demonstrated when the subject starts to fall into micro-sleep or become less attention during the lane-keeping driving task, the decline in the driver’s vehicle control ability will make the car drifting away from the center of the cruising lane. In order to investigate the relationship between the measured EEG signals and subject’s cognitive state, and to quantify the level of the subject’s alertness, we defined the subject’s driving performance index (driving error) as the deviation between the center of the vehicle and the center of the cruising lane as an indirect measurement of the subject’s alertness level.
Fig. 9. VR-based driving simulation environment It has been shown that human fatigue or drowsiness most commonly occurs late at night and during the afternoon. During these periods, alertness deficits would most likely take place in 1-h monotonous working [8][9]. In this study, we thus conducted all driving experiments in the early afternoon hours after lunch to maximize the opportunities to collect data during which subject driving performance became intermittent. For each session, the subject started with a min calibration procedure and then was asked to drive the car continuously for 45 min. The EEG data and the driving errors were measured and recorded simultaneously. Participants then returned on different days to complete the second 45-min driving session or the third session if necessary. We select participants who had two or more micro-sleep episodes based on the measured driving errors.
A. Data processing flow
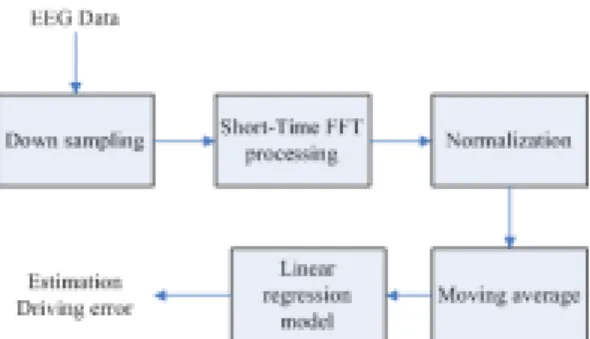
Fig. 10 shows the data processing flow. After acquiring the raw EEG data, we change the sample rate to 64 Hz, and transform to power series by using Short-Time FFT. The length of the processing window of Short-Time FFT is set as 64 data points. Then we normalized the power series and eliminated noise by a moving average filter. At last, the processed data was fed into the linear regression model to estimate the driving performance of the driver.
Fig. 10. Flowchart of the EEG signal analysis procedure. B. Analysis System Design
According to the description in section I, the main tasks of the embedded processor OMAP1510 contain EEG data process, wireless receiver control, and TCP/IP control. Thus we distribute the tasks to DSP processor and ARM processor to satisfy the requirements. According to the characteristics of the processors, the DSP processor calculated the driving error estimation task which needed a large quantity of continuous EEG data computation, and we keep it as a module which can be handled by ARM. The ARM core executes three tasks: (1) control the Bluetooth device to acquire the EEG raw data, (2) handle the DSP task to estimate the driving error of the driver, and (3) show the results of the estimation across the network. The ARM processor is selected for these tasks for the reason of its excellent interface control ability. All process flow and task division is shown in Fig. 11.
Fig. 11. The structure of the EEG process. III. RESULT
A. Signal Acquisition and amplifying Unit Test The test of our system was performed by three steps. First, we used EEG simulator to generate sin wave with frequency of 5 Hz and the amplitude of vibration was set as 30uV. In Fig. 12, we used this unit to measure the signal of eye blinks, since the amplitude of the signal was easy to be distinguished. In order to confirm the correctness of measured signal, the subject was asked at rest with eye-closed for the occurrence of α wave. The α wave with frequency of 8-12Hz was measured and shown in Fig. 13.
Fig. 12. The EOG signal.
Fig. 13. α wave
B. Wireless Data Transmission Unit Test We used two PCs to control the Bluetooth devices. Host device was going to search another Bluetooth device automatically. Client device waited until host device had found it, and then the connection and data transmission were started. The CPLD was used to control the client device while OMAP 1510 was controlling sever device, and then test continued.
C. Analysis Algorithm
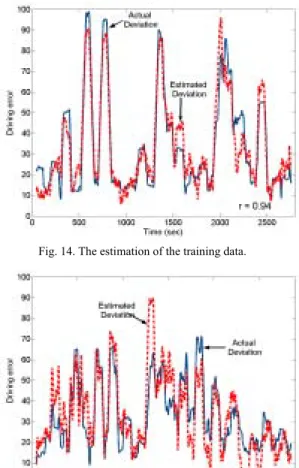
According to the description in section II, we apply our system to estimate the driver’s cognitive state. Before performing the estimation algorithm on the OMAP, we must train an estimation model, test and verify it off-line by PC. We used C code to implement our estimation algorithm and then evaluated its performance by a Matlab program. Fig. 14 shows the estimation of the training data and Fig. 15 shows the estimation of the testing data. The blue line is the real driving error and the red line is the driving error estimation. In Fig. 14, the correlation coefficient of the two time series in the training data is 0.87. In Fig. 15, the correlation coefficient of the two time series in the testing data is 0.87. According to the result, we could use the model which was trained off-line to estimate the driving error online. This demonstrates that it was feasible to estimate driving error as the index of drowsiness by using EEG signals.
Fig. 14. The estimation of the training data.
Fig. 15. The estimation of the testing data. D. Overall System Test
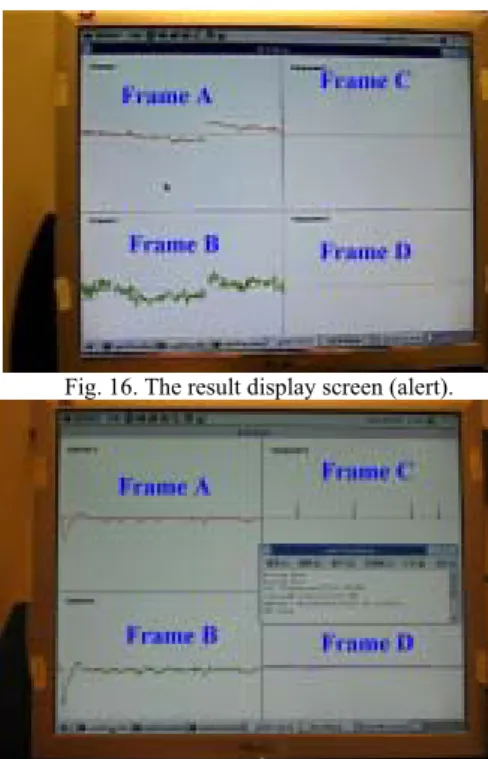
After the subsystems were tested and verified, we integrated the subsystems and tested online. In order to show the estimation results of our system, we employed a Java program to receive estimation results by network and drawn a graph. The Java display screen are shown in Fig. 16 and 17, the left two frames are row data of EEG signals of two channels, and the right side are the results of estimation, respectively. Frame C shows the result of estimation every two seconds and zero when the DSP core calculating. Frame D shows the result of estimation continuously. If the driver is alert, the display screen is show as Fig. 16. Because the driver is alert, there are no peaks in frame C. Fig. 17 shows the display screen when driver is drowsiness, there are peaks in frame C. Te result demonstrates that the system we developed is feasible.
Fig. 16. The result display screen (alert).
Fig. 17. The result display screen (drowsiness). IV. DISCUSSION AND CONCLUSION In this study, a dual core-based embedded system is proposed for an implemented brain computer interface (BCI) to estimate drowsiness condition of driver. The implemented system shows as Fig. 18, we employed the VR-based driving environment and a 6-DOF dynamic Stewart motion platform for simulation of the driving situation, and then the EEG signal was acquired via electrodes and the amplifying unit. The signal was transmitted to the OMAP1510 through the Bluetooth device. Estimation of the driving error of subject was achieved by the processor, and the data was transmitted to the server through the network. The main discrimination of the implemented system can be described as follows: (1) wireless transmission which provides convenience of using it. (2) dual-core embedded processor which promote performance and save computing time.
Fig. 18. The estimation of the training data. The most difficult work of our research is to establish the I/O driver to connect the Bluetooth device and integrate the all subsystems of the BCI system. In the transmission unit, we must understand the structure of the packages and the
transmission protocol. In the signal acquisition and amplifying unit, the way to modulate the system for acquiring the signal correctly is an essential work. When the system was integrated, we made lots of efforts on the stability of the system.
The proposed system integrates electroencephalogram signal amplifier technique, wireless transmission technique, and embedded real-time system. We have implemented a real-time embedded system to process the EEG signals. Furthermore, we integrated Bluetooth transmission technique and the signal acquisition and amplifying unit. We used OMAP1510 as an embedded processor to take advantage of the computing power of DSP to reduce computing time. In the future, we hope to integrate the EEG analysis system onto a chip, make it more convenient to carry for instant analysis.
REFERENCES
[1] J. Kalcher, D. Flotzinger, C. Neuper, S. Gölly, and G. Pfurtscheller, “Graz brain–computer interface II: Toward communication between humans and computers based on online classification of three different EEG patterns,” Med. Biol. Eng. Comput., vol. 34, pp. 382–388, 1996. [2] J. J. Vidal, “Toward direct brain–computer
communication,” Annu. Rev. Biophys. Bioeng., pp. 157–180, 1973.
[3] J. R. Wolpaw and D. J. McFarland, “Multichannel EEG-based brain–computer communication,” Electroenceph. Clin. Neurophysiol., vol. 90, pp. 444–449, 1994. [4] Guger, A. Schlögl, C. Neuper, D.
Walterspacher, T. Strein, and G. Pfurtscheller, ” Rapid Prototyping of an EEG-Based Brain–Computer Interface (BCI),” IEEE Trans. Neural Systems and Rehabilitation Engineering, vol. 9, MARCH 2001, pp. 49–58.
[5] Luigi Bianchi, Fabio Babiloni, Febo Cincotti, Marco Arrivas, Patrizio Bollero, and Maria Grazia Marciani, “Developing Wearable Bio-Feedback Systems: A General-Purpose Platform,” IEEE Trans. Neural Systems and Rehabilitation Engineering, vol. 11, JUNE 2003, pp. 117–119.
[6] C. T. Lin, R. C. Wu, T. P. Jung, S. F. Liang, and T. Y. Huang, “Estimating driving performance based on EEG spectrum analysis,” EURASIP Journal on Applied Signal Processing, Vol. 2005, No. 19, pp. 3165-3174, Mar. 2005
[7] C. T. Lin*, R. C. Wu, S. F. Liang, W. H. Chao, Y. J. Chen, and T. P. Jung, “EEG-based drowsiness estimation for safety driving using independent component
analysis,” IEEE Transactions on Circuits and Systems I, Vol. 52, No. 12, pp. 2726 – 2738, Dec. 2005.
[8] J. Hendrix, “Fatal crash rates for tractor-trailers by time of day,” in Proc. Int. Truck and Bus Safety Res. Policy Symp., 2002, pp. 237–250.
[9] H. Ueno, M. Kaneda, and M. Tsukino, “Development of drowsiness detection system,” in Proc. 1994 Vehicle Navigation and Information Systems Conf., vol. 31, Sep. 1994, pp. 15–20