doi:10.1136/oem.52.2.138
1995;52;138-142
Occup. Environ. Med.
Y H Liu, M R Lin and J D Wang
related disabling injuries in Taiwan.
Cost and determinants of morbidity from work
http://oem.bmj.com/cgi/content/abstract/52/2/138
Updated information and services can be found at:
These include:
Rapid responses
http://oem.bmj.com/cgi/eletter-submit/52/2/138
You can respond to this article at:
service Email alerting
the top right corner of the article
Receive free email alerts when new articles cite this article - sign up in the box at
Notes
http://journals.bmj.com/cgi/reprintform
To order reprints of this article go to:
http://journals.bmj.com/subscriptions/
go to:
Occupational and Environmental Medicine
Occupational and EnvironmentalMedicine1995;52:138-142
Cost and determinants of morbidity from work
related
disabling injuries
in
Taiwan
Yi-Hung Liu,Mau-Roung Lin, Jung-Der Wang
Departments of Family Medicine and InternalMedicine, National Taiwan University Hospital Y-HLiu
J-D Wang
Center for The
Researchof Environmental and Occupation Diseases, Institute of Occupational Medicine and IndustrialHygiene, National Taiwan UniversityCollege of PublicHealth,Taipei, Taiwan, Republicof China Y-HLiu M-RLin J-D Wang Correspondenceto:
DrJung-Der Wang, Center
for the Researchof Environmentaland Occupational Diseases,
Institute ofOccupational Medicineand Industrial Hygiene, National Taiwan University, College of Public Health,No1, Section 1, Jen-Ai Road, Taipei, Taiwan, RepublicofChina
10016.
Accepted13October 1994
Abstract
Objectives-To estimate the cost and
determinants of morbidity from work
related disabilities.
Methods-114peoplewho lived in
metro-politan Taipei and who had received
dis-ability compensation from the Labor
Insurance Bureau from March to June,
1991 wererandomly selected. Therewere
77 workers interviewed through a
ques-tionnaire that inquired about possible loss of productivity including the dura-tionofmorbidity, the abilityto return to
work, andanychange in monthly income
uponreturningtowork.
Results-The mean (SD) duration of a
stayinhospitalwas29 (39) days, median:
15 days. The average duration between
discharge from the hospital and
return-ingto workwas 111 (146) days, median:
45 days. The main determinants of the
duration of the stay in hospitalwere the
number of stays in hospital and the
severity of the injury. Amultivariate lin-earanalysis showed that oldage and the severity of injury determinethedurations ofmorbidity. An ordinal logistic
regres-sion analysis showed that the severity of
injury, size of thefactory, and age
deter-mined the magnitude of future produc-tivity loss. Based on thesemodels, itwas
estimated that the total duration of
mor-bidity (in hospital and at home) due to
occupational disability was 660000
per-son-days eachyear.When thepercentage
ofthedecreaseinincomebecause of
per-manent disability was converted into a
loss of work days, the annual morbidity
costs were about 19 000-26 000 person-yearsbetween 1985-1990.
Conclusion-The morbidity cost was
aboutfive timesashighasthelumpsum
payment that a worker usually received fordisability compensation.Weconclude
that morbidity cost should be evaluated carefully in the future for the
establish-mentofaccurateand fairdisability com-pensationpayments.
(OccupEnviron Med1995;52:138-142)
Keywords: occupational disability; morbidity cost;
compensation
An average of one to two/thousand male
workers in Taiwan sustain work related
dis-abling injuries annually' 3; also, the annual
mortalityrateof male workers dueto
occupa-tional injuries is about 05/thousand.2I The risk of major occupational injuries among
female workers is aboutonesixth thatof male workers and has not shown any tendency to
decline in thepastsixyears.' Thetotal
mor-tality duetooccupational injuries in Taiwan is five to 10 times higher than that of more
industrialised countries such as Japan or the United States.2
Besides the above figures, there are other
reasons to call for continuous efforts and
moreallocation ofresourcesfor research and the prevention ofoccupational injuries. Most
occupational injuries canbe avoided ifsafety
mechanisms are clearly understood and
proper precautions followed.4 Furthermore, the social costs of occupational injuries are
muchgreaterthan thoseof other health prob-lems because theage groupofinjuredworkers is relatively young and they are economically
productive.3
There are two key elements of social cost.
One is the directcostsuchasexpendituresfor
goods and services. The other is the indirect
costthat includes the lossofpotential earning
or loss ofproductivity.9 The indirect cost is usually several times higher than the direct
cost.'0 In occupational accidents, the indirect
cost canbe further divided into themortality
costofoccupationalfatalities and the morbid-itycostofoccupationalinjuries.9
Inthispaper we try toestimate thecostand determinantsofmorbidity duetowork related
permanent physical impairment-that is, occupationaldisabilities,in Taiwan.
Subjectsand methods
To draw a representative sample of workers with work relateddisabling injuries,wevisited the Labor Insurance Bureau weekly during the months of March to June, 1991. Every worker who lived in the metropolitan Taipei
areaandhad received hisorhercompensation in theprevious weekwasregistered and givena
number. Through the procedure of random sampling, 114 people were selected. Additional information such as their address,
the telephone numbers of their home and workplace,andthe details oftheirinjuries,etc were obtained from the Labor Insurance Bureau. To receive disability compensation resulting from occupational injuries, these
workershad to havefinishedtheir initial med-ical treatment, and the disability should be
relatively stable. All workers with an
occupa-tionally-related permanent disability will cer-138
Cost and determinantsofmorbidity from work related disablinginjuriesin Taiwan
Table 1 Comparison of the pattern of injuries and the degree of disabilities Intemiewed Notinterviewed
n 77 n=37 Pvalue Age (y): Mean(SD) 37-3(11.1) 33-6(11 3) 0-096 Range 8-62 16-57 SexM:F 58:19 34:3 0036t Injury:
Blindnessdue toeyeball injury 1 0 039t
Cervical and thoracic trauma 2 2
Lumbosacraltrauma 4 0
Lowerextremity 3 1
Bilateralupper extremities 5 0 Unilateral upper extremities 60 34
Finger(s) 2 0 Degreeof disability: 1-3j: 3(2) 1 068t 4-6* 2(1) 1 7-9t 16(3) 4 10-12t 27(1) 21 13-15* 29(5) 10 Disability compensation (NT$): Mean (SD) 113 725(114 950) 117938(155851) 0-82* Range 15 300-470 000 19 200-915 000 Median 71400 81600
Durationofstay inhospital:
Mean(SD) 23(36) 46(129) 0-69*
Range 0-252 0-738
Median 13 11
*Wilcoxon rank-sumtest.tX2test.*()No of workers not returned to work.
tainly obtain their compensation payment
because ofworkmen's compensation legisla-tion in Taiwan. In the years 1985 to 1990,
there were 34 416 workers who obtained
compensation.'
Afterperformingapilottest, wedesigneda
questionnaire"'- thatinquired aboutpossible loss ofproductivity including the duration of morbidity (in hospitalandathome),any
com-pensation payments or reimbursements
received, whether the subjects couldreturn to
work, and if there were any changes in their
incomes. We employed two groups of
inter-viewers with three members in each group: onemedicalprofessional (amedical doctoror
physical therapist) and two social workers.
Eachinterviewerreceived asix hourinterview
training course andeveryitem ofinquirywas
standardized. From July to November 1991, interviewersvisited the selectedworkers.
Datawerethen coded into acomputerand
analysed by a statistical package SAS/STAT
PC 6-04."4 Weapplied multiple linear
regres-sionanalysisfor theestimation of the duration of totalmorbidity includingthe duration ofa
stay in hospital and rest at home after acute
injuries. Then, an ordinal logistic regression
analysis'5 was also performed to obtain the
adjusted odds ratio (OR) of all the
determi-nants of future loss ofproductivity. We have classified the decrease inmonthlyincome (in
NT$) into four ordinal categories:
<5000, 5000-9999, 10 000-24 999, and >25000. The independent variables we put
in tofit the model included age, sex, severity
ofinjury,educationallevel,size of thefactory, relationshiptotheemployer, etc.
To estimate the total morbidity cost of work relateddisabilityinTaiwan, wecanonly
use theseverityofinjury andageasthe
inde-pendent variables because no information on the other determinants is available at the
national registration data. We have
con-structed a model topredict the magnitude of theperson's future decrease inworking
capa-bility. In thismodel,theproportion ofchange
inmonthly income was assumed to be a per-centage of loss of working capability. The resulting models from the multiple regression were used to estimate the productivity lost
due tomorbidity fortheyears 1985 to 1990.
Each worker's future loss ofproductivity was calculated as the percentage of loss multiplied by his or her potential working years. To
esti-matethepotential working years, we assumed that each worker would have worked until 65 years of age had he or she not been injured. Thus, we obtained the person's potential working years bysubtracting the person's age
from 65. Both parts of the morbidity cost-thatis, the durationofthestay in hospital plus convalescence at home and the future loss of
productivity-sharedthe same time unit: per-son-daysorperson-years.
Results
Among the 114 workers randomly selected, there were 92 men and 22 women. Their
mean (SD) age was 36-1 (11-3) with a range from 16-62. According to the regulations of the Labor Insurance Bureau, the degree of
disability was classified, from severe to mild,
on ascaleof1-15 (1 being the most
severe).'6
Most of the disabilities were mild-that is,
76-3% of the workers fell between 10-15 on the severity scale. The age and sex
distribu-tionof these 114workers,aswellasthecause, agent, and severity of theinjury, were similar
to those of all disabled workers in Taiwan in 1990.3
We successfully interviewed 77 workers;
theinterviewratewas67-5%.Themean(SD)
durationfrom the onset ofinjuryto the date of the interview was 10 1 (6-7) months. Sixty five ofthem (84%) had returned to work by
the timeofourstudy. Therewere 12workers who could not be interviewed because of diffi-culties in making an appointment. Other
common reasons for a lack of an interview
wereeither a change inplace of employment
and moving out ofmetropolitan Taipei, or a
loss of contact with their families (21/37).
Three people refused to be interviewed and
one person died. Other than the distribution of sex, there was no significant difference in the characteristics of those interviewed and those whowere not(table 1).
The mean (SD) duration ofastayin
hospi-talfor the 77 peopleinterviewedwas 29 (39) days, median: 15 days. The number of stays inhospital ranged from0 to 6. The degree of disability was further
categorised
into severe(degree 1-3), moderate (degree
4-9),
and mild (degree 10-15). The duration ofconva-lescence at home (after discharge from the hospital and before returning to work) was
aboutfive timeslongerthan thatof the stayin
hospital, and the variability of the
convales-cence was also greater (table 2). The total durationofmorbiditywasthesumof the stays inhospitalandathome.
Both the number of times a patient was
admitted to hospital and the severity of the disability (butnot age) were important deter-minants in the multiple linear regression 139
Liu, Lin, Wang
Table 2 Duration ofmorbidity (in hospital or at home) among disabled workers (stratifiedby the severity of thedisability)
Degree of Workers Durationof Durationofstay Durationof disability n Morbidity inhospital rest athome
1-2* 2 Mean (SD) 9680 190(88) 9490 Range 7428-11932 128-252 7300-11 680 3-6 3 Mean(SD) 250(142) 52(18) 198(156) Range 90-360 35-71 19-309 Median 300 53 265 7-9 16 Mean(SD) 209(174) 35(29) 174(157) Range 18-565 6-112 5-565 Median 165 25 133 10-12 27 Mean (SD) 58(75) 11(10) 47(78) Range 0-360 0-31 0-360 Median 30 10 19 13-15 29 Mean(SD) 93(152) 12(16) 81(141) Range 7-767 0-82 0-685 Median 40 7 26
*Two workerswho had beenbedridden fortwoyears after theirinjurywereassumed to be unable to work until theretirementageof65.
analysis of the duration of the stay inhospital.
Except for the two most severely injured workers (degree of disability 1-2 on table 2,
namely, confined to bed) the 75 workers we
visited had an average duration of convales-cence athome of111 (146) days, median: 45 days. Resultsofthemultipleregression
analy-sis ofconvalescenceathome anddurations of morbidity of these 75 workers showed that
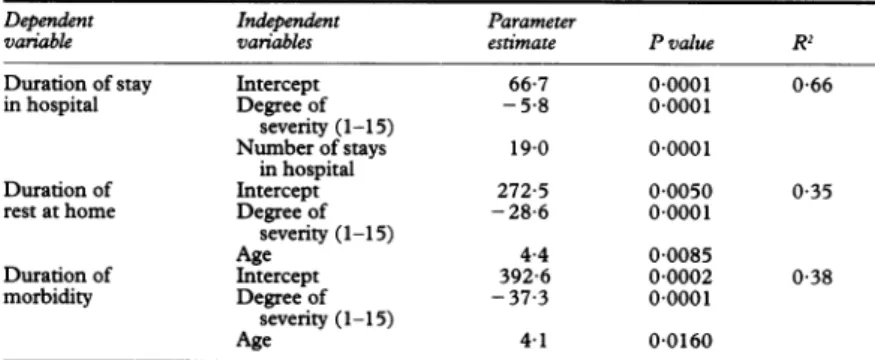
Table3 Modelsconstructedfrom multiple linear regressiontopredict the durationof stay inhospital,rest athome, and totalmorbidity*
Dependent Independent Parameter
variable variables estimate Pvalue R2 Durationofstay Intercept 66-7 0-0001 0-66 inhospital Degreeof -5-8 0-0001
severity (1-15)
Number ofstays 19-0 0-0001
inhospital
Durationof Intercept 272-5 0 0050 0-35 rest athome Degree of -28-6 0-0001
severity (1-15) Age 4-4 0-0085 Durationof Intercept 392 6 0-0002 0-38 morbidity Degreeof -37-3 0-0001 severity (1-15) Age 4-1 0 0160
*Other independentvariables,suchaseducational level(P=0-63),thesize ofthefactory judged
by numberof workers (P=0-92), relation withtheemployer (P=0-67)were notincluded in
the model becausetheywerenotsignificant. The twoworkers withpermanentdisabilitywere excludedfrom the model ofthe duration of rest at home andmorbiditytodowngrade their influence on themodels.
Table4 Decreasein monthly income stratified bydemographicandothercharacteristics ofthedisabled workers
Decrease inmonthly income
5000- 10 000-<4999NT$ 9999NT$ 24999NT$ >25OOONT$ Pvalue* Sex M:F 45:14 4:4 5:1 4:0 0-664 Age: 16-44 46 5 2 3 0-072 >45 13 3 4 1 Education level: <Highschool 39 7 6 4 0040 >Highschool 20 1 0 0 Married 15 2 2 1 0-833 Unmarried 44 6 4 3 Size offactory judged bynumber of workers:
<29 41 4 6 2 0-894
>30 18 4 0 2
Relative of theemployer:
No 35 6 6 3 0-070
Yes 24 2 0 1
Injuredpart:
Hands 54 5 4 2 0 003
Others 5 3 2 2
Severityof thedisability:
Mild 48 4 3 1 <0001 Moderate 11 3 3 1
Severe 0 1 0 2
*Mantel-HaenszelX2testfor trends.
these two
dependent
variables shared thesame determinants that is, the age of the worker andtheseverityof theinjury (table
3).
In exploring each person's future loss of
productivity, we calculated the decrease in income after thedocumentation of permanent
disability.
The decrease in monthly incomewas stratified and analysed by the Mantel-Haenszel
X2
testfortrends. Table 4 showsthat there is a trend in the decrease of monthlyincome associated with a more severe
injury
(P< 0-0001), an injury that involved parts other than the hands (P= 0-003), or a lower educational level (P= 004). Also, an ordinal
logistic registic regression analysis was per-formed to explore the determinants of the decrease in monthly income. The result showed that after adjustmentfor various fac-tors, an increase in the severity of injury, a
decrease in size of thefactory,or anolderage
are independently associated with an
increased OR of greater loss in monthly
income (table5).
With theproportion of decrease inmonthly
income as the dependent variable, a multiple linear regression model was constructed to
explore the importance of the age of the worker and theseverity of the injury. The pro-portion of decrease in monthly income for those over45 years of age showedadramatic increase (14-6%). Moreover, the severity of theinjurysustainedby the worker also signifi-cantlydetermined the magnitude of decrease inthe person'smonthly income (table 6). The total duration of morbidity due to occupa-tionaldisability, inferred from themodel, was about 660 000 person-days, or 1808 person-years, annually for the past six years. The average morbidity cost for each disabled
TableS Adjusted ORs ofdifferent independentvariables
forlossofproductivity calculatedfromanordinallogistic regression analysis (the dependent variablesare thefour
differentlevelsof decreaseinmonthly income-istrowof
table4)
Independentvariables AdjustedOR(95%CI) Pvalue Severityofinjury:
Mild 1.0
Moderate 0-19(0 70to0054) 0 01 Severe 0-004(0-10to00002) <0 001 Size offactory (bynumber ofworkers):
<29 0-16(0-80to0029) 0 03 30 1 0
Age:
16-44 1.0
,_45 0-29(094 to 0086) 0 05 Relatives of theemployer:
No 0-27(1 19 to0-058) 0-08 Yes 1.0
Education level:
<Highschool 0 26 (2-38 to0-028) 0.23
>Highschool 1.0
Table6 Proportionofdecrease inmonthly income predicted bythemultipleregression model stratifiedbyage andseverity oftheinjury
Decrease inmonthly Age(y) Severity income(%)
<44 Mild(10-15) 7.34 Moderate(4-9) 24-73 Severe(1-3) 87-37 >45 Mild(10- 15) 21-93 Moderate(4-9) 39-32 Severe(1-3) 100 0 140
Cost and determinantsofmorbidityfrom work relateddisabling injuries in Taiwan
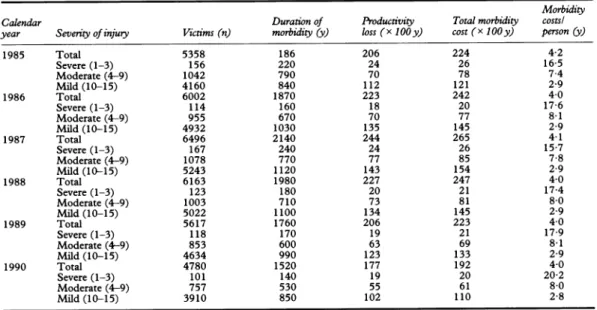
Table7 Morbiditycosts (inperson-years)ofoccupational disabilitiesinTaiwan 1985-90, estimated by our modelsfrom
tables 3 and 6
Morbidity Calendar Durationof Productivity Total morbidity costs
year Severityofinjury Victims(n) morbidity (y) loss(xlOOy) cost(xlOy) person(y)
1985 Total 5358 186 206 224 4-2 Severe(1-3) 156 220 24 26 16-5 Moderate (4-9) 1042 790 70 78 74 Mild(10-15) 4160 840 112 121 2-9 1986 Total 6002 1870 223 242 4-0 Severe (1-3) 114 160 18 20 1746 Moderate(4-9) 955 670 70 77 8-1 Mild(10-15) 4932 1030 135 145 2-9 1987 Total 6496 2140 244 265 4-1 Severe (1-3) 167 240 24 26 15-7 Moderate(4-9) 1078 770 77 85 78 Mild (10-15) 5243 1120 143 154 29 1988 Total 6163 1980 227 247 4-0 Severe (1-3) 123 180 20 21 174 Moderate(4-9) 1003 710 73 81 8-0 Mild(10-15) 5022 1100 134 145 2-9 1989 Total 5617 1760 206 223 40 Severe(1-3) 118 170 19 21 179 Moderate(4-9) 853 600 63 69 8-1 Mild(10-15) 4634 990 123 133 29 1990 Total 4780 1520 177 192 4-0 Severe(1-3) 101 140 19 20 20-2 Moderate(4-9) 757 530 55 61 8-0 Mild(10-15) 3910 850 102 110 2 8
worker wasequaltoalossof4 1 person-years.
After stratifying the morbidity cost with the
severity of the disability, we found that the average losses ofworkingyearsfor themildly, moderately, and severely disabled workers
were 2-9, 7 9, and 17-6 person-years,
respec-tively. During the past six years the annual
morbidity costfor alldisabled workersranged
from 19000 to 26000 person-years (table 7).
Discussion
In the estimation of the morbidity cost of
occupational disability, difficulties and limita-tions do exist and need to be assessed. We could only focus on the metropolitan Taipei
area and the number of workers selected was
also limitedto 114duetotheamountof time and effortwe wereabletooffer for home visits.
Nevertheless, the metropolitan Taipei area
includes a wide variety of industries that are also widespread throughoutthe country, and the random selection we used
provided
uswitha
representative
sample aswas shownbythe lack of obvious difference between the
demographicdataof the workers in ourgroup and workers in the rest of the
nation.'
Although about30% of the workers were notinterviewed,there was asignificantdifference inonly the distribution ofsexbetween those interviewed and thosenotinterviewed. Assex was not found to be a main determinant in
morbidity costs, wethink thatourresults are
acceptable.
The design of thisstudywas retrospective,
whichwas different fromthe fouryear follow
Table 8 Comparison ofcosts(inperson-years) dueto
occupational mortalityanddisabilityinTaiwan,
1985-90
Calendaryear Mortalitycost Morbiditycostof disability
1985 32 500 22400 1986 32500 24200 1987 36 700 26 500 1988 43 100 24700 1989 44 300 22 300 1990 43 800 19 200
uprecommendedby Bakeretal.9In our coun-tryit usuallytakes along time (an average of
10.1
months) to receive disability compensa-tion and there was about a six to 12 month time lagbetween the compensation payment andourinterviews. Moreover, workersgener-allysettletheircompensation onlyif their dis-abilities have stabilised to avoid any future
medical costs. Thus, it is reasonable to
assume that the severity of the disability will
notchangeappreciablyafterourinterviews. Theremightbesomedoubt about the legit-imacyof theuseof theproportion of decrease inmonthlyincomeas anindextoestimate the
degree of loss of
productivity.
We think that this is a reasonable method of estimation in Taiwanorinotherdevelopingcountries with-out a comprehensive system of workmen'scompensation. Alarge
proportion
ofemploy-ers in Taiwan do not take full responsibility
for workers withoccupational disabilities,and thosewho donotpaymuch attentionto
occu-pational safety and health are more likely to havevictims ofinjury. Instead ofbeing
trans-ferred to another job with a similar income,
workers whoareinjured mightreceivealower
salarywhentheirjobs change, orare evenlaid off because of the change in their working capability. The disability
compensation
pro-vided bythe Labor Insurance Bureauis often the onlypayment theyreceive. Therefore our indexisareasonableestimate because the loss of
productivity
ofthedisabledworkers isusu-ally reflectedintheirmonthlyincome. Our ordinal logistic regression analysis
showed that the three most
significant
factors for the decrease inmonthlyincomewere: theseverity of the injury, the size ofthe factory,
and age (table 5). The severity ofthe injury
and age were probably the most important
factors, because both of them are also the mainpredictors of the duration ofmorbidity (table 3). Fortunately, the modelsweused to
predictnational loss also contained these two factors(tables3 and6), whichprobablymade ourestimation of nationalmorbiditycost due
to
occupational
disability relatively accurate.Liu,Lin, Wang
Although we have tried to obtain more infor-mation from the Labor Insurance Bureau, it does not regularly collect data on the size of the factory. Failure to control for the determi-nants other than the severity of theinjuryand age, as well as the small number ofsubjects
interviewed, might limit the generality of our conclusions. We think that our results of mor-bidity cost are unbiased but have a wide confi-dence interval (CI), and thus recommend a larger sample for future studies.
We have computed the working years of potential life lost (WYPLL) as an alternative way to estimate the indirect costs of occupa-tional mortalities in ourprevious article.' We found that the WYPLL ofoccupational mor-talities (inTaiwan) wasabout 38 800 person-years annually. In this study, we have estimated the WYPLL of occupational dis-ability in Taiwan and obtained a figure of about 23 200person-years annually. Thus the ratio of WYPLL between occupational
mor-tality and disability was about 2:1 (table 8). Theannualmortality cost showed a tendency to increase, a result that may be due to the large proportion of occupational fatalities' from traffic accidents and an increase in the
frequencyofmajor occupational accidents at construction sites. On the contrary, the annualmorbiditycostofoccupational
disabil-itydecreasedyearly. The decrease in the pro-portion of workers in manufacturing
industries as well as the migration of haz-ardous industries to neighbouring developing countriesmightcontribute to the result.
The morbidity costs that we have calcu-lated should not be considered to be the only loss to the victims of occupational injuries
simplybecause effects suchaspain,grief, and
family or social disruption cannot be mea-sured in these terms.9 Workers in developing countries like Taiwan still haveextremelyhigh
risks in the working environment. Injured workers should be properly treated and receive enough compensation not only for their future but also the futureof theirfamily
members. At the same time, a greater effort
toward thepreventionofoccupational injuries
mustbe
implemented.
Theamountofdisabil-ity
compensation
paymentgiven
tothose who sustainedinjury
was so limited that itonly
covered about one fifth the morbidity cost thatwecomputed.'6We recommend thatour
people,
government, andemployers
make ajoint
effort to establish a more reasonable compensation payment.1 LiuYH, Wang JD. Death duetooccupationalaccidents andcost tosociety:ananalysisofcumulativemortality
rates and years of potential life loss. Journal of the
NationalPublicHealthAssociation (RepublicofChina) 1992;11:89-101.
2 The BureauofLabor Insurance in Taiwan. Statistics of laborinsuranceinTaiwan 1986-91.Taipei:TheBureau
ofLaborInsuranceinTaiwan,1992.
3 LiuYH, Wang JD.Determinants andtrends of
occupa-tional disability rates in Taiwan during 1985-1990.
JournaloftheNational Public HealthAssociation(Republic
ofChina) 1993;12:354-67.
4 Waller JA. Occupational injuries. In: WallerJA. Injury
control: aguide to the causes andprevention oftrauma.
Lexington,MA:Lexington Books,1985:421-46. 5 Feyer AM, Williamson AM. A classification system for
causesofoccupational accidents foruse inpreventive
strategies. Scand 7 Work Environ Health 1991;17:
302-11.
6 Occupational injuries.In:DavidB,WilliamF,DennisM,
eds. The NationalCommittee forInjury Preventionand
Control.(US)Injury Prevention: meetingthechallenge.
Am_JPrev Med 1989:177-91.
7 Smith GS.Injuriesas apreventabledisease:the control of
occupationalinjuriesfromthemedicalandpublic health
perspective.Ergonomics1987;30:213-20.
8 DepartmentofHealth,ExecutiveYuan, Taiwan Provincial Health Department, Taipei City Health Department.
Kaohsiung City Health Department. Health and vital statistics:1. General health statistics TaiwanArea,Republic of China, 1985-90. Taipei: Division of Statistics, DepartmentofHealth ExecutiveJuan. 1985-90.
9 Baker SP, O'Neill B, Karpf RS. The injury fact book. Lexington, MA: Lexington Books,1984.
10 Harlan LC, Harlan WR, Parsons PE. The economic
impactofinjuries:amajorsourceofmedicalcosts.AmJ7
Public Health1990;80:453-59.
11 Rice DP, MacKenzie EJ, Jones AS, Kaufman SR, deLissovoy GV, SmithGS, et al. Cost of injury in the
United States:areport to congress.San Francisco:Institute for Health and Aging, University of California and
Injury Prevention Center, The Johns Hopkins University, 1989:37-85.
12 MacKenzieEJ, Siegel JH, Shapiro S, Moody M, Smith
RT. Functionalrecovery and medical costs of trauma:
an analysis bytype and severity of injury. J Trauma
1988;28:281-97.
13 MacKenzie EJ, Shapiro S, Siegel JH. The economic
impactof traumatic injuries: one-yeartreatment-related expenditures.JAMA1988;260:3290-6.
14 SAS Institute.SASISTAT User's Guide,release 6 03edition. Cray, NC: SAS Institute, 1988.
15 SAS Institute. SASISTATSoftware: CALISand LOGIS-TIC procedures, release 6-04. Cray, NC: SASInstitute, 1990:175-230. SAS TechnicalReport P-200. 16 The BureauofLaborInsurancein Taiwan.Theregulations
of labor insurance. Taipei: The Bureau of Labor InsuranceinTaiwan,1989:38-79.