522 IEEE TRANSACTIONS ON VEHICULAR TECHNOLOGY, VOL. 45, NO 3, AUGUST 1996
Design of Power Contro
DS-CDMA Cellular
echanisms wit
PCM
Realization for the Upli
Chung-Ju Chang, Senior Member, IEEE, Jeh-Ho Lee, and Fang-Ching Ren, Student Member, IEEE
Abstract-Power control (PC) is an important issue in a direct sequence-code division multiple access (DS-CDMA) cellular mo- bile radio system. Higher link performance and greater system capacity cannot be achieved unless an appropriate PC mechanism is employed. In previous research, a delta-modulation (DM) realization of strength-based and SIR-based PC mechanisms for uplink communication has been studied by simulation. In order to obtain higher PC trackability, in this paper we study a pulse-code-modulation (PCM) realization of the above two PC mechanisms for the uplink of a DS-CDMA cellular mobile radio system. The simulation results presented here indicate that PC mechanisms with PCM realization for the uplink can achieve a lower outage probability and thus higher link performance than PC mechanisms with DM realization. We also obtain optimal design parameters such as the stepsize and the control mode for the two PCM PC mechanisms. In addition, we compare the two PCM PC mechanisms in terms of their outage probability and stability and find that the strength-based mechanism has a higher outage probability but greater stability than the SIR-based mechanism.
I. INTRODUCTION
HE code division multiple access (CDMA) scheme for
T
cellular mobile radio systems was developed mainly for capacity reasons. Many papers [l], [2] have shown that CDMA can achieve a greater capacity than frequency division multiple access (FDMA) or time division multiple access (TDMA). However, several radio link techniques must be used for CDMA to provide greater capacity than these other schemes. One of the most important of these radio link techniques is appropriate control of transmitted power [ 11-[3].In a direct-sequence code division multiple access (DS- CDMA) system, users (mobiles) are distinguished by their respective spreading codes. Since these spreading codes are not completely orthogonal, in the despreading of a user’s waveform, nonzero contributions to the user’s test statistic may arise from the transmissions of other ,users in the system. This effect, which is called self-jamming [4], does not occur in FDMA or TDMA, which preserve the orthogonality of received signals almost completely.
Manuscript received October 29, 1993; revised May 25, 1994, June 15, 1995, and September 7, 1995. This work was supported by the National Science Council, Taiwan, Republic of China, under Contract NSC 82-0404- E009-416.
The authors are with the Department of Communication Engineering and Center for Telecommunications Research, National Chiao Tung University, Hsinchu, Taiwan 300, Republic of China.
Publisher Item Identifier S 0018-9545(96)05464-3.
Because self-jamming may occur in DS-CDMA systems, the transmitted power of users has to be regulated so as to prevent mutual interference and maintain communication quality [l], [2], [4], [5]. Anyavisitakul and Chang [6]-[9] have studied strength-based and SIR (signal-to-interference ratio)-based power control (PC) mechanisms with a fixed- step, or delta modulation (DM), realization for the reverse link (uplink). In [6] they also mentioned a variable-step approach and stated that variable-step PC may perform slightly better (in terms of system capacity) than the fixed-step approach, but they have not investigated the design of a variable-step mechanism in detail.
In this paper, we study a pulse-code-modulation (PCM) realization of these two PC mechanisms for the uplinks of a DS-CDMA cellular mobile radio system [lo]. We have performed an extensive simulation analysis of the performance of the two mechanisms, along with a study of the sensitivity of each mechanism to all the revelant design parameters, including stepsize, control mode, loop delay, and desired power level. As we will see later, the PCM realization of a PC mechanism can achieve a lower outage probability and thus higher link performance than the DM realization of the same PC mechanism. Such a PCM PC mechanism could be applied in a personal access communication system that requires the same communication quality as a wired system. We have also compared strength-based and SIR-based PCM PC mechanisms, in terms of both outage probability and stability. Our findings show that the SIR-based PCM PC mechanism has less outage probability but greater instability than the strength-based PCM PC mechanism.
The remainder of the paper is organized as follows. In Sec- tion 11, the strength-based and SIR-based PCM PC mechanisms are described. In Section 111, the system model is introduced. The framework of the simulation program and the simulation results are presented in Section IV, and our concluding remarks appear in Section V.
11. POWER CONTROL MECHANISMS WITH
PCM REALIZATION
As their names indicate, the strength-based and the SIR- based PCM PC mechanisms are based on different objectives. The strength-based mechanism is based on the original idea of PC-to keep the power of all signals received at the base station as nearly the same as possible so as to mitigate the 0018-9545/96$05.00 0 1996 IEEE
CHANG et al.: DESIGN OF POWER CONTROL MECHANISMS WITH PCM REALIZATION
...
...
. Base Statim j ......
Desired...,..I..
....
... ... {. .... ... . i . . ... Command i Adjustment Detector I ... ... i Mobile Station:. ... .i ...Fig. 1. Block diagram of the uplink power control mechanisms.
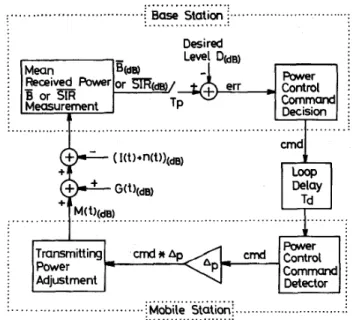
near-far effect. The SIR-based mechanism is based on the objective of directly controlling the communication quality or the system performance according to the SIR received at the base station. These two mechanisms force the transmitted power of the mobile to track the variation in the channel gain. Fig. 1 depicts the block diagram of the uplink PCM PC mechanisms studied in this paper. If the base station measures the mean received signal strength (power) over a power measurement period, denoted by
B ,
and comparesB(&)
with a desired level D ( ~ B ) maintained at the base station, the PC is called a strength-based PC mechanism. Notice that B and Dare defined as ratios to some reference value. In our simulation analysis, B was obtained by
where M ( t ) is the transmitted power of the mobile, G ( t ) is the channel gain on the uplink, and Tp is the power
measurement period. On the other hand, if the base station measures the mean received SIR on the desired uplink over a power measurement period, denoted by SIR, and compares SIR(dB) with a desired level D(dB), the PC is called an SZR-
based PC mechanism. In our simulation analysis,
SIR
was obtained by__
where I ( t ) is the interference power from all the other mobiles in the system and n(t) is the background noise.
The difference between B(dB) and D(dB) in a strength-based mechanism, or the difference between
m(d~)
and D(dB) in an SIR-based mechanism, denoted by err, is then fed into a “Power Control Command Decision” block. This block sends~
523
a PC command, denoted by cmd, which is the realization of pulse code modulation (PCM) for err, to the mobile station via the feedback channel of the downlink (forward link) to track the variation in the channel gain. We define the PCM PC mechanism as follows.
Dejinition: A PCM PC mechanism in control mode-n is
defined as a mechanism whose PC command set, denoted by CMD,, is given by
C M D , ~ { ( - n , - ( n - l ) , . . . , - l , O , l , . . . , n - l , n } where n is a natural number; and the corresponding decision rule for determining the PC command, cmd E CMD,, is given by cmd = -n if key E ( n - 0 . 5 , ~ )
1
- n + 1 i f k e y E ( n - 1 . 5 , n - 0 . 5 ] I .,
-1 if key E (0.5,1.5] 0 if key E (-0.5,0.5] 1 if key E (-1.5,-0.51 n - 1 if key E (-n+
0.5, -n+
1.51 n if key E (- m , -n + 0 . 5 ]where key
A
e r r / A p and Ap is the minimum stepsize for the power tracking.Having received the PC command, cmd, the mobile trans- mits power
M ( t )
updated by an amount of cmd.
A p ( d ~ ) . The time period that the mobile takes for one operation of tracking, denoted by T d , is called the loop delay. The loop delay consistsof the following components: the power measurement period Tp, the uplink and the downlink propagation delays, and the time delay involved in generating, transmitting, and executing a PC command. The loop delay plays an important role in the PC mechanism, which will be explored below.
111. SIMULATION MODEL
In our simulations, we considered only the uplinks of 19 cells in a DS-CDMA cellular mobile radio system and concentrated on a center cell surrounded by the other 18 cells in a hexagonal-grid configuration [8], [9]. The cells were
assumed to be wrapped so as to avoid the edge effect; and the mobiles in these 19 cells were assumed to be randomly located with a uniform density and Nu mobiles per base station.
The radio signal at time t in the uplink of the center cell was assumed to be attenuated by a channel gain G ( t ) containing long-term fading, denoted by L ( t ) , which describes the local mean signal power, and short-term fading, denoted by S ( t ) , which accounts for multipath fading [l 11. Hence, as shown in Fig. 1, given a mobile’s transmitted power M ( t ) , the received power in the base station B ( t ) can be obtained by
B ( t ) = M ( t ) * G ( t ) = M ( t ) * L ( t )
.
S ( t ) . (3)The long-term fading L ( t ) is a random variable modeled as L ( t ) = K . F a 10E’lo (4)
524 IEEE TRANSACTIONS ON VEHICULAR TECHNOLOGY, VOL. 45, NO. 3, AUGUST 1996
where lc is a constant, r is the distance between the base station
and the mobile station, a! is called the path loss exponent, and
is a normal-distributed random variable with zero mean and variance ai [ll ]. In our simulations, we let /c = 1, a! = 4, and
a~ = 8. The short-term fading S ( t ) is also a random variable that is assumed to have Nakagami-m statistics [12], [13]. After normalization by M ( t ) . L ( t ) , S ( t ) is gamma'distributed with probability density function (pdo g ( . ) , which is given by
where
r(.)
is the gamma function, the parameter m equals 1/AF, and AF denotes the amount of fading, which is defined as the ratio of the variance of the received energy to the square of the mean of the received energy [ 121.Two-branch antenna diversity was used at the base station receiver. For each diversity antenna, we assumed that two resolvable paths are captured by the receiver. The two captured signals were assumed to be equal in average strength, but with independent Nakagami-1 (i.e., Rayleigh) fading. After the signals on these two paths are combined, a Nakagami-2 faded signal can be assumed in each diversity antenna. The largest SIR in these two diversity antennae was then selected as the received SIR. On the other hand, each mobile scans signals from all the surrounding base stations and decides to communicate with the base station that has the largest time- averaged signal power. Note that the time-averaged signal power is in fact the long-term fading signal.
Moreover, over an observation period of loop delay, each mobile was assumed to move continuously within a small geographical area, so the radio uplink has uniform path loss and shadowing. Therefore, the long-term fading on each uplink, including the desired and the undesired fading, can be considered to be a constant during the observation period. The maximum Doppler frequency normalized by the power measurement sampling rate for each mobile, denoted by f D T p ,
can be considered to be a random variable, which is given by
where V is the speed of the mobile, X is the wavelength, FO is the central frequency of the signal, and G is the speed of light ( = 3
.
10' d s ) . For example, given that FO = 900MHz, V ranges from 6 km/h to 60 k m h , and Tp = 2 ms, ~ D T ~ will range from 0.01 to 0.1. In our simulations, we assumed that f D T , was uniformly distributed over [0.01,0.1]. The background noise and the minimum transmitted power were assumed to be 10-loMm, and 10'-5Mmu, respectively, where Adma denotes the maximum transmitted power of a
mobile. The maximum path loss due to distance was assumed to be on the order of 40 dB. The antenna used by the base station or the mobile was considered to be omnidirectional. Voice activity and soft handoffs were not considered in the simulations.
We here use the outage probability as our performance criterion [ 6 ] , [14], [15]. The outage probability for a given
communication link i, denoted by P$), is defined as (7) where SIR, is the average SIR of the uplink
i
and SIR0 isthe minimum SIR required to achieve a desired bit error rate [6]. The outage probability for the system, denoted by PO, is defined as the average outage probability over all the in-cell links located in different positions of the center cell [14]; PO is given by
where
Lk
is the set of the in-cell links of the center cell andI
LI,
I
is the size of the set Lk. IfSIR,
is averaged over a short- term period of a power measurement Tp, we call the outage probability the short-term outage probability [14], [15]; ifSIR,
is averaged over Rayleigh fading and is a local meanSIR,,
we call the outage probability the long-term outage probability
[6]. The short-term outage probability reflects the percentage of signal outages in which the measured short-term
SIR,
statistics falls below SIRo. The long-term outage probability indicates the percentage of system outages in which a base station's coverage area has a local-mean
SIR,
of less thanSIRo. The short-term outage probability inherently is more variable Oarger standard deviation) than the long-term outage probability. In the following simulation analysis, we will use the short-term outage probability to evaluate the gain in link performance and use the long-term outage probability to assess the gain in system capacity, for the two PCM PC mechanisms under study.
From [1], [6], [16], SIR can be expressed in terms of Eb/& as
-1 SIR=-.(;) Eb
IO (9)
where E b is the energy per information bit, 10 is the interfer- ence power per hertz, R is the information bit rate, and W is the channel bandwidth. In our simulations, we assumed that the required performance in terms of the bit error rate is less than lop3, and thus E b / l ~ should be larger than 5 (or 7(dB)) [2]; if we consider the spread spectrum processing gain W / R = 128, then we have the minimum required S I R O ( ~ ~ ) -14(dB).
Iv. SIMULATION RESULTS A. Framework of the Simulation Program
The framework of the simulation program was as follows:
Step 0: [Set Up System Parameters]
Set up system parameters such as m (Nakagami-m), 6, a , O-L,
Nu,
Fo, and V for the DS-CDMA cellular mobile radio system.Set up system parameters such as Tp, T d , control mode n, D p , and D for the PC mechanism.
CHANG ef al.: DESIGN OF POWER CONTROL MECHANISMS WITH F'CM REALIZATION 525
Step 1: [Initialization]
Randomly assign the positions of the mobiles with uniform distribution.
For each mobile, set up log-normally distributed long-term fading on its corresponding uplinks and then assign it a home base station.
Set an initial power for each mobile. Set
t
= 0.Step 2: [Simulation over an Observation Period of Loop Delay
( t ,
t+
Td)]Simulate the short-term fading on each uplink, in- cluding desired and undesired fading.
Measure the following items over a power measure- ment period T, at each diversity antenna of each base station: the mean received power from each in- cell uplink and the total mean received power from all out-cell uplinks.
Combine the signal on the diversity antenna for each desired uplink.
According to the above measurements and the strength-based or SIR-based PCM PC mechanism, generate PC command for each mobile.
After a delay time of (Td - T,), the mobile receives the PC command and adjusts its transmitted power. Collect the received
SIR
data to calculate the local- mean SIR and the short-term and long-term outage probabilities.Step 3: [Repeat the Simulation]
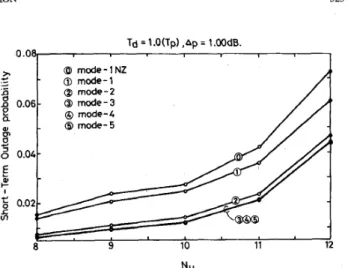
Fig. 2. Outage probability of the strength-based PCM PC mechanism versus
Nu for control mode n E { l N Z , 1 , 2 , 3 , 4 , 5 } , given that Ap = l.Oo(dB),
T d = l.OTp.
signal power and the interference power. Fig. 2 shows the short-term outage probability of the strength-based PCM PC mechanism versus
Nu
for various control mode-n, n E{lNZ, 1,2,3,4,5}, given A, = l(dB), Td = l.OT,. Mode- 1NZ is defined as C M D ~ N Z & {-l,+l}, where the PC command is determined by
-1, if key
2
0 1, if key<
0.cmd =
Mode-1NZ is in fact the DM PC mechanism previously studied in [6]-[91. . ~ In Fig. . _ 2, we find that the PCM PC performs better Let t = t
+
Td and go to Step 2 unless t is greater than the DM P c for the strength-based mechanism and the high-order mode in the PCM PC performs better than the low- than a preset threshold.Step 4: [Restart Another Simulation Cycle] order mode regardless of the system load
Nu.
This is becausecompared with a low-order mode, a high-order mode in the Go to Step 1 to restart a new, independent simu-
lation cycle unless the number of simulation cycles executed exceeds a preset threshold.
PCM PC mechanism has a wider dynamic range of adjustment power, which enables it to track the variation in the channel gain more accurately. However, the improvement provided by
A total of 2000 simulation cycles were executed in our study. For each simulation cycle, the system conditions, in- cluding the mobile location and the long-term and short-term fading processes, were independently constructed; the initial transmitted power of the mobile was set to be inversely proportional to the long-term fading on its uplink. The total number of observation periods in each simulation cycle was 600, where the latter 400 periods were the average period over Rayleigh fading. We checked the first-order statistics, the CDF (cumulative distribution function) curve, of the simulated Nakagami-m short-term fading for m E { 1,
.
, 8 } , and the second-order statistics, Le., the lcr (level crossing rate) curve, for m = 1 [16]. These data showed that our short-term fading simulator was accurate [17].the high-order mode becomes insignificant when the control mode is greater than three. This is because the dynamic range of adjustment power in the PCM PC mechanism does not need to be too large for a given variation in short-term fading.
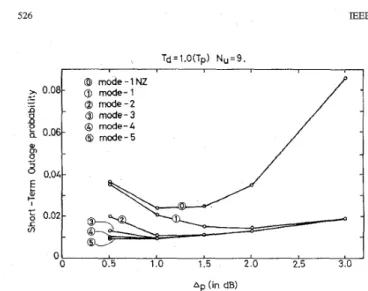
Fig. 3 shows the short-term outage probability of the
strength-based PCM PC mechanism with mode-n, n E {lNZ, 1,2,3,4,5}, versus A,, given that Td = 1.097, and
Nu = 9. We again find that a high-order mode performs
better than a low-order mode regardless of the stepsize A,.
We further observe that, for a given mode, if A, is either too small or too large, the outage probability increases. There exists an optimal A i , for the following reason. The transmitted power signal M ( t ) does not always track the variation in short-term fading exactly. The err signal between the mean received power signal B and the desired level D in the base station can be classified into two types: quantization noise and slope overload noise [ 181. Slope overload noise occurs when the stepsize Ap is too small for the mobile to follow quick changes in short-term fading; quantization noise occurs for any step size but is small for a small stepsize. Therefore, there
B. The Strength-Based PCM PC Mechanism
D is irrelevant in the strength-based PC mechanism, because an increment (decrement) in the desired level D would result in the same amount of increment (decrement) in the desired
526 IEEE TRANSACTIONS ON VEHICULAR TECHNOLOGY, VOL. 45, NO. 3, AUGUST 1996 x 0.08- c .-
-
-8
& 0.06- 0 0-’
0.04- E 5 5 0.02- i5 r-.-
CB mode -1 NZ @ mode-I @ mode-2 0 mode-3 @ mode-4 0 mode-5 I 0.5 1 .o 1.5 2 0 2.5 3.0 01 0 Ap (in dB)Fig. 3 . Outage probability of the strength-based PCM PC mechanism versus Ap for control mode n E { l N Z , 1 , 2 , 3 , 4 , 5 } , given that Td = l.OTp and
Nu = 9.
should clearly be an optimal value for the stepsize, since if the stepsize is increased, the quantization noise will increase but the slope overload noise will decrease. The higher the order of mode n is, the smaller A; will be. As n tends to infinity, A; tends to 0, which is the case of continuous-level PC [19].
Loop delay Td is also an influential factor in determining the short-term outage probability of the system. Fig. 4 depicts the influence of T d on the short-term outage probability of the strength-based PCM PC mechanism for various modes, given
Nu
= 9 and A p = l ( d B ) . As T d increases from l.OTp, the short-term outage probability also increases for all modes. This is because if the loop delay is too large, the PC command received by the mobile will already be obsolete and the mobile will be unable to track the variation in the channel fading accurately. As a result, the effectiveness of the PC mechanism deteriorates. We also observe that as T d increases the short- term outage probability of the higher mode increases more rapidly than that of the lower mode. Finally, at a certain T d there is a crossover between the performance curves of the higher mode and the lower mode. After the crossover, the low- order mode performs better than the high-order mode. This seems to indicate that when Td is larger, the wide dynamic range of the high-order mode is not advantageous but leaves larger room for error. Notice that all modes in Fig. 4 operate withA p
= 1.0 dB, which is not the optimal stepsize at T d2
1 .4Tp. However, if the control mode n in Fig. 4 operates with its optimal valuea
:
corresponding to Td, the higher- order mode will always outperform the lower-order mode and the crossover should not occur. As for the curves of the long- term outage probability, they have the same trends as those for the short-term outage probability shown in above figures, but they are less variable.C. The SIR-Based PCM PC Mechanism
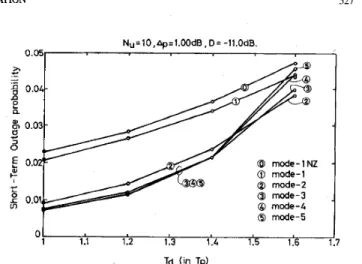
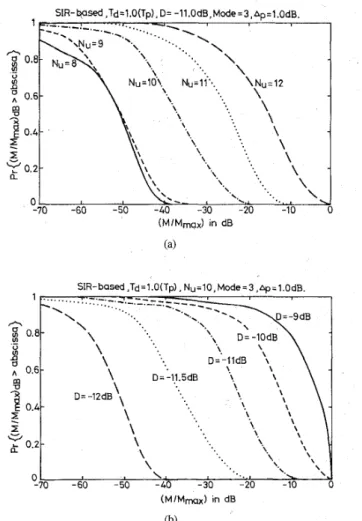
In the SIR-based PCM PC mechanism, the desired level D is an essential system parameter that must be considered. Fig. 5 shows the short-term outage probability of the SIR-
Nu.9 ,Ap=l.OdB @ mode-3 a @ mode-5 F c
6
0.03 f 0.02 $ 0.01 b 0 1.0 1.1 1.2 1.3 1.4 1.5 1.6 1.7 Td (in Tp)Fig. 4. Outage probability of the strength-based PCM PC mechanism versus
T , for control mode n E { l N Z , 1 , 2 , 3 , 4 , 5 } , given that Nu = 9 and Ap = 1 OO(dB).
Td = 1 .O(Tp)
,+=
1 .OOdB, Mode= 3.0.08
0 (in dB)
Fig. 5. Outage probability of the SIR-based PCM PC mechanism versus the desired level D for various system loads Nu E {8,9,10,11,12}, given that Td = l.oTp, A p = l.OO(dB), and control mode n = 3 .
based PCM PC mechanism versus the desired level D ( d B )
for Nu E {8,9,10,11,12}, given control mode n = 3 and
np
= 1 (dB). w e find that for a givenNu,
a relatively higher D and a relatively lower D cause a higher outage probability. There exists an optimal D , denoted by D*, that provides the best link performance, for the following reason. According to our SIR-based PCM PC mechanism, the receivedSIR
should be concentrated at the desired level D. Hence, the pdf curve of the receivedSIR
has a peak at the desired level D. When the desired level D is low, most mobiles will be able to control their transmitted power so that their receivedSIR
is concentrated at the desired level D . As a result, the lower the desired levelD
(closer to m o ) is, the larger the short-term outage probability will be. When the desired level D is high, on the other hand, most mobiles will be commanded to increase their transmitted power, and as a mobile’s transmitted power increases, its interference also increases, because of the increment in the other mo- biles’ transmitted power. Consequently, for most mobiles, the receivedSIR
will still not reach the desired level, and the mobiles will continue to increase their transmitted power untilCHANG et al.: DESIGN OF POWER CONTROL MECHANISMS WITH PCM REALIZATION Td=l.O(Tp),Nu=lO,D=-ll.OdB. I N~=lO,Ap:l.00dB,D=-ll.OdB. 0.051 Q mode-lNZ @ mode-1 Q mode-2 Q mode-3 01 0.2 0.4 0.6 0.8 1 1.2 1.4 1.6 1.8 2 Ap (in dB)
Fig. 6. Outage probability of the SIR-based PCM PC mechanism versus the stepsize Ap for control mode n E { l N Z , 1 , 2 , 3 , 4 , 5 , 6 } , given that
Td = l.OTp, Nu = 10, and D = - l l ( d ~ ) .
the maximum transmitted power M,,, is reached. This will also cause the short-term outage probability to increase. We also find that the optimal desired level D* increases as Nu decreases. If the SIR-based mechanism is required to provide optimal performance at any load, the optimal desired level
D*
at each base station could be dynamically changed according to the system load Nu. However, it is difficult to obtain Nu and adjustD*
correctly. Here we suggest choosing a nearly optimal D so that the SIR-based mechanism will operate effectively for a wide range of traffic load. In the case shown in Fig. 5, we can choose D = -1l(dB) when Nu5
12 so that the short-term outage probability remains around 0.01. Note that the choice ofD
also depends on other factors, such as the loop delay Td, the control mode number n, and the stepsizeA p H71.
Fig. 6 depicts the short-term outage probability of the SIR-based PCM PC mechanism versus the stepsize A p for control mode n E {lNZ,1,2,3,4,5,6}, given Td = l.OTp,
Nu = 10, and
D
= - 1 l ( d B ) . It is obvious that the high-order modes improve the link performance more than the low-order modes. This implies that the link performance can be enhanced by increasing the control mode number, as in the strength-based PCM PC mechanism. However, the performance improvement will become saturated if the mode number is large enough, regardless of the stepsize A p . The upper limit on the improvement in link performance would be offered by continuous-level PC (Le., n tending to infinity and Ap tending to zero) [19]. The improvement is almost the same for control mode n
2
3, given that Ap is around l(dB). Note that in practice A p = l ( d B ) is a reasonable choice. The claim that the high-order modes perform better than the low-order modes still holds, regardless of Nu and D [17]. Since a higher-order mode wastes more system capacity in the feedback channel, we suggest adopting control mode n = 3.Fig. 7 depicts the effect of the loop delay Td on the short-
term outage probability of the SIR-based PCM PC mechanism for various control modes, given Ap = l ( d B ) ,
D
= - I l ( d ~ ) ,and Nu = 10. The short-term outage probability of every control mode increases as Td increases, and the superiority of the high mode holds unless Td exceeds a certain threshold
g
0.01 0 mode-5 0 1 1.1 1.2 1.3 1.4 1.5 1.6 Td (in Tp) 527 7Fig. 7. Outage probability of the SIR-based PCM PC mechanism versus T d for control mode n E { l N Z , 1,2,3,4,5}, given that Nu = l 0 , A p = l . O o ( d ~ ) , D = - l l . O ( d ~ ) .
N U
Fig. 8. Outage probability of the strength-based and the SIR-based PCM PC mechanisms versus Nu for control mode rz E { l N Z , 1 , 2 , 3 , 4 } , given that
T d = l.OTp and Ap = 1 . 0 0 ( d ~ ) .
(around 1.4 Tp). Once T d is larger than the threshold, the order of superiority of the various control modes is gradually reversed. The crossover phenomenon is the same as that in the strength-based PCM PC mechanism, but it is less dramatic. This could be because
SIR
measurement reflects the signal quality more accurately than signal strengthB
measurement does.D. Comparison of the Two PCM PC Mechanisms
In this subsection, we compare the two PCM PC mecha- nisms in terms of the outage probability and stability. Fig. 8 illustrates the short-term outage probabilities of the two mech- anisms versus Nu, given A p = l ( d B ) and Td = l.OTp. From
Fig. 8, we can claim that the system performance achievable by the SIR-based PC mechanism is superior to that achievable by the strength-based PC mechanism at most system loads. We also observe in the simulation that the superiority of the SIR-based PC mechanism always holds, regardless of the loop delay [17]. This is because
SIR
reflects the quality of communication more accurately thanB
does.528
Strenth- based ,Td=l.O(Tp). D=O.OdB, Mode = 3 ,Ap= 1.OdB.
IEEE TRANSACTIONS ON VEHICULAR TECHNOLOGY, VOL. 45, NO. 3, AUGUST 1996
SIR- @sed ,Td=l.O(Tp), D= -11 .OdB. Mode = 3 , AD=^ .OdB.
(MIMmax) in dB
Fig. 9. Complementary CDF of the mobile’s transmitted power in strength-based F‘CM PC mechanism for various N u , given that T d = l.OTp,
D = 0 . O ( d ~ ) , control mode n = 3 , and Ap = l . O ( d ~ ) .
Fig. 9 shows the complementary CDF of the transmitted power of a mobile with the strength-based PCM PC mech- anism versus
Nu,
given control mode n = 3 , Ap = l ( d B ) ,Td = l.OTp, and D = O(dB). As can be seen from the figure,
the distribution of the mobile’s transmitted power is similar for various
Nu.
This is because the power control processes for all desired uplinks are essentially mutually independent in the strength-based mechanism, and thus the mobile’s transmitted power can be stably controlled. On the other hand, Fig. 10 depicts the complementary CDF of the transmitted power of a mobile with the SIR-based PCM PC mechanism versus Nu, given Td = l.OTp, D = -ll.O(dB), control mode n = 3, andAp = I(&), in Fig. 10(a), and versus D , given T d = l.OT,,
Nu
= 10, control mode n = 3, and Ap = l ( d ~ ) , in Fig. 10(b). From Fig. 10, we find that the distribution of a mobile’s transmitted power in the SIR-based mechanism varies greatly asNu
or D varies. This is because of the interaction between the power control processes on each desired link in the SIR-based mechanism. We can explain this phenomenon as follows.When Nu or D is relatively small, the interference power is usually small and the received
SIR
is usually higher than the desired D. Most mobiles will be commanded to decrease their transmitted power, and thus the mutual interference will also be reduced. The overall effect after one control period is that the receivedSIRS
of most mobiles will still be higher thanD,
so the transmitted power of the mobile will be reduced repeatedly until the background noise comes to limit the receivedSIR.
In contrast, whenNu
or D is relatively high, the receivedSIR
for most mobiles is smaller than the desired D. Most mobiles will thus be requested to increase their transmitted power in order to increase the receivedSIR.
This will also result in an increase in the interference power. Consequently, the receivedSIR
will still be smaller than the desiredD,
and the mobiles must increase their transmitted power repeatedly until they reach their maximum transmitted power. Therefore, a system with the SIR-based PC mechanism is unstable, because in general most mobiles must adjust their transmitted power toward its maximum limitation.SIR- based .Td= 1 .O(Tp) I Nu=lO, Mode = 3 ,ap z 1 .OdB.
( M I M m ) in dB (b)
Fig. 10. Complementary CDF of the mobile’s transmitted power in SIR-based PCM PC mechanism for various system loads N u in (a) and for various D in (b). ’@SIR-b~d,N~:12,D=-ll dB @SIR-based,Nu=14 D=-12dB @Strength-based, Nu=12,D=O @Strength-based , Nu=14,D=O -20 -1 6 -12 -0 -4 0 Received SIR (dB)
CDF of the received SIR versus the number of users N u .
Fig. 11.
We further plot the CDF’s of the local-mean and the short- term received SIR in Fig. 11. The curve of the local-mean received SIR rises more steeply than that of the short-term received SIR, indicating that the local-mean received SIR is less variable, as we stated in the previous section. Fig. 12
CHANG et al.: DESIGN OF POWER CONTROL MECHANISMS WITH PCM REALIZATION 529
control mode. If the loop delay is large, on the other hand, the opposite is true.
The PCM PC can respond more flexibly to channel vari- ations than the DM PC and yields significantly better link performance and a slightly larger system capacity. However, the PCM PC wastes more system capacity on the feedback channel (downlink), which negates some of the gain in the system capacity. The PCM PC should have a niche appli- cation in small-sized microcell PCS (personal communication service) systems which intend to obtain the same signal quality as wired systems. Also the PCM PC is more prone to PC command errors if the feedback channel is noisy. According
1 3 14 15 16 17 18 19 20 21 to our observations, when the error rate in the downlink is less than
lop1,
the superiority of high-order modes and the curve trends discussed here should hold.Nu
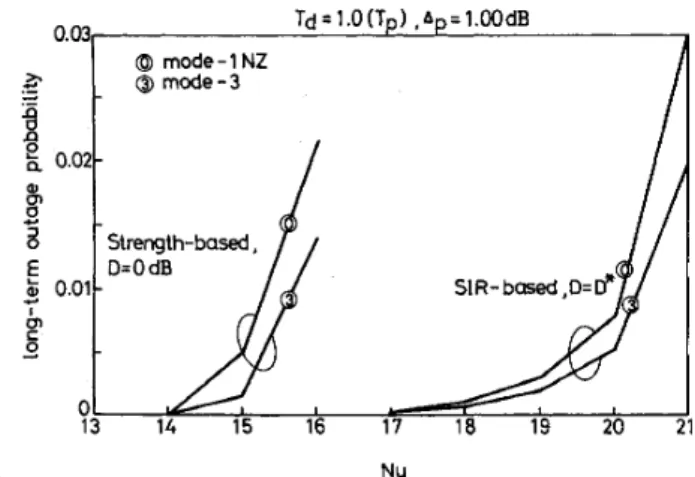
Fig. 12. Long-term outage probability versus the number of users Nu.
ACKNOWLEDGMENT shows the long-term outage probability versus the number of
users Nu. For a given number of users, the system reliability
[6], expressed in percent, increases by one when the power
control mode is changed from mode-1NZ to mode 3. Notice
that the required percentile of system reliability is around 99%. For a 99th percentile of system reliability, the system capacity increases by 3% to 5% when the power control mode is changed from mode-1NZ to mode 3.
V. CONCLUDING REMARKS
The authors would like to thank the anonymous reviewers for their comments, which helped to clarify and improve the presentation of the paper.
REFERENCES
111 W. C. Y. Lee, “Overview of cellular CDMA,” IEEE Trans. Veh. Technol., vol. 40, no. 2, pp. 291-302, May 1991.
[2] K. S. Gilhousen, I. M. Jacobs, R. Padovani, A. J. Viterbi, L. A. Weaver, and C. E. Wheatley, “On the capacity of a cellular CDMA system,”
IEEE Trans. Veh. Technol., vol. 40, no. 2, pp. 303-312, May 1991.
[3] A. Salmasi and K. S. Gilhousen, “On the system design aspects of code division multiple access (CDMA) applied to digital cellular and personal In this paper, we have studied uplink PC mechanisms with
P ~ M realization for a DS-CDMA cellular mobile radio system. We have considered the strength-based and the SIR-based mechanisms and investigated system design parameters such level. Our main findings are the following.
communications networks,” in IEEE GLOBECOM’91, pp. 5 7 4 2 .
[4] R. L. Pickholtz, L. B. Milstein, and D. L. Schilling, “Spread spectrum for mobile communication,” IEEE Trans. Veh. Technol., vol. 40, no. 2,
pp. 313-322, May 1991.
P I M. A. Beach, A. Hammer, S. A. Allpress, J. P. MacGeehan, and A. Bateman, “An evaluation of direct sequence CDMA for future mobile 161 S. Arivavisitakul and L. F. Chang, “Signal and interference statistics of as the PCM control mode, stepsize, and the desired power communication networks,” in IEEE GLOBECOM’91, pp, 63-70.
-
IIn both PCM PC mechanisms, there is an appropriate PCM control mode for a given stepsize. An excessively high PCM mode is not necessary.
There exists an optimal stepsize A: for a given variabil- ity in short-term fading; the magnitude of A; is inversely proportional to the PCM control mode.
When the SIR-based mechanism is used, it is important that the desired level
D
be selected carefully, but this is not necessary when the strength-based mechanism is used. Setting the desired level too high or too low in the SIR-based mechanism will significantly degrade the system performance. In particular, if the desired level is too high, most mobiles will be forced to transmit at maximum power.The outage probability of the strength-based mecha- nism is generally higher than that of the SIR-based mechanism, whereas the mean transmitted power of the mobiles is more stable when the strength-based mechanism is used than when the SIR-based mechanism
is used. Note that the system load and the desired level are also influential factors.
The loop delay has an important effect on the system performance. If the loop delay is small, a high PCM control mode yields better performance than a low
- I
. .
a CDMA system with feedback power control,” IEEE Trans. Commun.,
vol. 41, pp. 16261634, Nov. 1993.
[7] S. Ariyavisitakul, “SIR-based power control in CDMA system,” IEEE
GLOBECOM’92, pp. 868-873.
[8] S. Ariyavisitakul and L. F. Chang, “Simulation of CDMA system performance with feed-back power control,” Electron. Lett., vol. 27,
pp. 2127-2128, Nov. 1991.
[9] L. F. Cbang and S. Ariyavisitakul, “Performance of power control method for CDMA radio communications system,” Electron. Lett. , vol.
27, pp. 920-922, May 1991.
[lo] L. H. Goldstein and B. Liu, “An ADPCM realization of nonrecursive digital filters,” IEEE Trans. Acoust., Speech, Signal Processing, vol.
[ I l l W. C. Y. Lee, Mobile Cellular Telecommunications Systems. New
York McGraw-Hill, 1989.
1121 Y. D. Yao and A. U. H. Sheikh, “Investigations into cocbannel in- terfrence in microcellular mobile radio systems,” IEEE Trans. Veh. Technol., vol. 41, no. 2, pp. 114-123, May 1992.
[13] W. R. Braun and U. Dersch, “A physical mobile radio channel model,”
IEEE Trans. Veh. Technol., vol. 40, no. 2, pp. 472482, May 1991.
[14] Y. S. Yeh and S. C. Schwartz, “Outage probability in mobile telephony due to multiple log-normal interferers,” IEEE Trans. Commun., vol.
COM-32, no. 4, pp. 380-388, Apr. 1984.
[15] K. W. Sowerby and A. G. Williamson, “Outage probability calculations for multiple cochannel interferers in cellular mobile radio systems,” in
IEEE Proc., pt. F, June 1988, vol. 135, no. 3, pp. 208-215.
1161 W. C. Y. Lee. Mobile Communications Enaineerina. New York
ASSP-24, pp. 312-320, Aug. 1978.
-
-McGraw-Hill, 1982.
1171 C. H. Lee, “Power control in DS-CDMA cellular radio system,” M.S.
.,
~ thesis, Department of Communication Engineering, National Chiao
New Tung University, Taiwan, 1993.
[18] L. W. Couch 11, Digital and Analog Communication Systems.
530 IEEE TRANSACTIONS ON VEHICULAR TECHNOLOGY, VOL. 45, NO. 3, AUGUST 1996 [19] R. W. Nettleton and H. Alavi, “Power control for spread spectrum
cellular mobile radio system,” in IEEE VTC’83, pp. 242-246.
Chung-Ju Chang (S’8 l-M’85-SM’94) received
the B.E. and the M.E. degrees in electronics engineering from National Chiao Tung University, Hsinchu, Taiwan, in 1972, respectively, and the Ph.D. degree in electrical engineering from National Taiwan University in 1985.
From 1976 to 1988, he was with Telecom- munication Laboratories, Directorate General of Telecommunications, Ministry of Communica- tions, Republic of China, as a Design Engineer, Supervisor, Project Manager, and then Division Director. There, he was involved in designing digital switching system, ISDN user-network interface, and ISDN service and technology trials. In the meantime, he also acted as a Science and Technical Advisor for Minister of the Ministry of Communications from 1987 to 1989. In August 1988, he joined the faculty of the Department of Communication Engineering and Center for Telecommunications Research, College of Electrical Engineering and Computer Science, National Chiao Tung University, where he is currently Professor. His research interests include performance evaluation, ATM (asynchronous transfer mode) networks, and mobile radio networks.
Dr. Chang is a member of the Chinese Institute of Engineers (CIE).
Jeh-Ho Lee was born in Taiwan, ROC, on Nov. 24, 1969. He received the B.E. and M.E. degrees in Telecommunication Engineering from National Chiao Tung University, Hsinchu, Tawan, in 1991 and 1993, respectively.
He is now employed as an Engineer in a commu- nication equipment company.
Fang-Ching Ren (S’94) received the B.E. and M.E.
degrees in telecommunication engineering from Na- tional Chiao Tung University, Hsinchu, Taiwan, in 1992 and 1994, respectively. Currently, he is working toward the Ph.D. degree.
His research interests include performance anal- ysis, protocol design, and mobile radio network.