A Real-Time Equipment Monitoring and Fault Detection System
R.S. Ciuo', A. Chen2, C.L. Tseng4, I.K. Fong3, A. Yang2, C.L. Lee2, C.H. Wu3, S. Lin' S.J. Huang', Y.C. Lee', S.G. Chang', M.Y. Lee5
'National Taiwan University, Department of Industrial Management and Business Administraticn 'National Taiwan University, Graduate Institute of Industrial Engineering
National Taiwan University, Department of Electrical Engineering
4Lunghwa Jr. College of Technology & Commerce, Department of Electrical Engineering 5 Taiwan Semiconductor Manufacturing Corporation
3
Abstract
In semiconductor fabrication processes, real-time equipment monitoring and fault detection become critical as most problems reveal themselves first on the equipment performance and much later on the wafer quality. The sooner we can detect the problem, the lower the production loss. The goal of this paper is to present an integrated equipment monitoring approach for a PECVD tool. The approach will include: 1) simultaneous monitoring scheme: a dartboard display of real-time data that provides an easy reading of the equipment's overall status, 2) system health index: an index that evaluates the equipment's overall health, and 3) analysis functions that include various charting functions, real-time SPC, run-to-run SPC, and other advanced SPC functions. The system has been implemented in TSMC FAB IV for testing. The preliminary results show that the proposed system is an effective tool for real-time monitoring and fault detection.
1. Introduction
1.1 Motivation
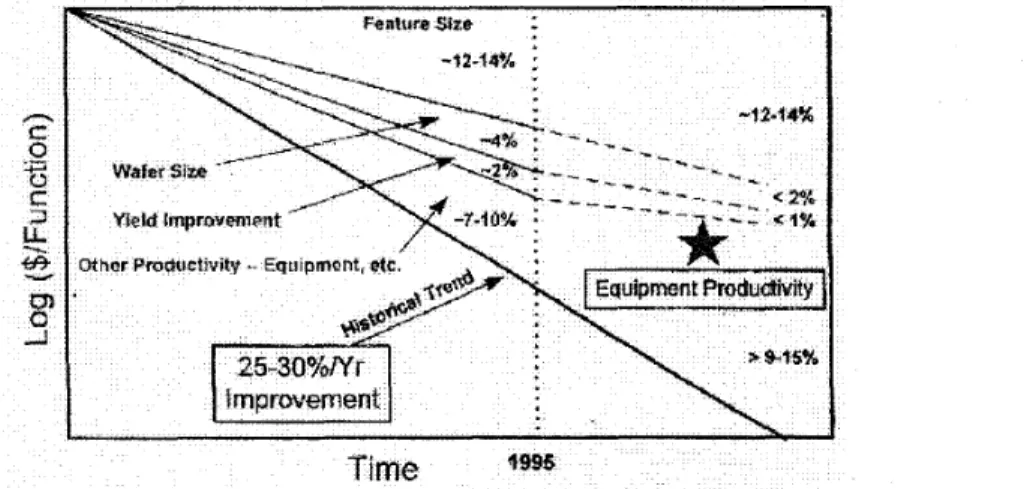
Over the past twenty years, the semiconductor industry has been following the pace predicted by the famous Moore’s laws in the aspects of technology advancement and productivity enhancement. Twenty years later, we are wondering whether this incredible development of semiconductor industry will continue to uphold given that the technology development in IC manufacturing is reaching its limitation. The US SEMATECH member companies have identified four major contributing factors that are essential to upkeep the 25-30% productivity improvement pace per year as predicted by the Moore’s Second Law [l] These factors are shrinking feature size, larger wafer size, yield improvement and higher equipment productivity. Among them, the equipment productivity has been recognized as the most critical factor for the future boost of the overall IC manufacturing productivity. Figure 1 shows the development of the productivity with the four contributing factors.
Figure 1 : Productivity improvement in semiconductor manufacturing
From Figure 1, it can be seen that to upkeep the pace of 25-30% productivity increase per year the answer lies mainly on the improvement of the equipment productivity. The cost of building an IC fab has increased drastically in recent years and the largest part of it is the equipment cost. A typical 8-inch fab in 1997 would cost one to two billion US dollars and the equipment cost is roughly 75% to 80% of the entire fab cost. Despite the huge amount of capital invested in the equipment, the effective equipment utilization averages only 35% [ 2 ] . In order to uphold the pace of productivity growth, it is critical to look into the problems that cause major losses in the equipment utilization. In this paper, we will then focus on the real-time equipment monitoring and fault detection that will improve the equipment yield and availability and consequently raise the overall effectiveness of the equipment. The concept has been implemented in a commercial PECVD tool in a foundry fab.
1.2 Background
Equipment monitoring is an extension of traditional statistical process control (SPC) approach [3] to a more real-time setting and to the equipment data rather than product state data. Since most process excursions are caused by the equipment’s departure from its in-control operational state, the problems will first reveal themselves on the equipment condition and then on the wafer state later. Traditional SPC
techniques are usually applied to the observations of product state for detection of out-of-control processes. This is becoming unsatisfactory because IC fabrication usually involves more than 150 steps and each step demands a very tight control in every aspect of the wafer processing. Even a small deviation could result in hnctional failures of the chips, which after many steps have accumulated a great amount of value. It is thus critical to implement a more effective monitoring mechanism that takes the advantage of real-time information directly obtained from the equipment.
There are some difficulties to apply the traditional SPC approach in equipment monitoring mainly because the nature of equip-ment data violates the fimdamental assumptions of SPC. Due to the presence of process dynamics and closed-loop control mechanisms in wafer processing, semiconductor equipment data often appears to be auto-correlated and cross-correlated. Spanos, et al. [4] propose an SPC scheme that utilizes time-series techniques to filter out the data correlation patterns [5]-[7] and then apply multivariate statistical process control techniques [8] to the residuals for detection of special causes. They also develop a software utility for the monitoring scheme [9].
Another difficulty of implementing a real-time monitoring system is the enormous volume of data to be collected and analyzed. The implementation requires a sound data communication channel and network and an effective data classification and analysis technique. Bunkofske, et al. [ 101 of the IBM Microelectronics Division propose an integrated system for real-time process monitoring (RTPM). There also exist companies devoting their services to implementing such systems [ 111-[ 141. They are, however, less concerned about the implication of the analysis result and its employment in increasing ihe equipment availability. In this paper, we have developed a filtering mechanism that can accurately characterize the equipment behavior. Using the rigorous model of the equipment data, an effective fault detection methodology is developed. This early fault detection helps raise the equipment yield by preventing wafers of poor quality being produced. In addition, we have also developed a scoring scheme to assess the equipment’s soundness. In the scoring scheme, all aspects of the equipment’s performance [ 151 are taken into account.
1.3 Organization of this paper
This paper starts with the introduction in this section. In the following section, generic functions of an equipment monitoring and fault detection system are first described, followed by the introduction of the system’s architecture and GUI design for a PECVD tool. In section 3 , we describe in more detail the monitoring of the tool’s performance against the setting specifications. We then introduce the ideas and methodology of the statistical monitoring hnctions in section 4. Conclusions are made in section 5 .
2. Overview of the system
2.1 Generic system functions
Functions of the real-time equipment monitoring and fault detection system are proposed as follows.
1) Simultaneous monitoring scheme: the scheme consists of 3 concentric circular regions. Observations of different parameters are first normalized and then displayed simultaneously on a dartboard. The farther away the observations from the dartboard center, the worse the performance of the corresponding tool parameters. The display of the scheme provides an easy reading of the equipment’s overall status. A more detailed description of the display will be given in Section 3. 2) System health index: this index provides an overall evaluation of the equipment’s health. Based on
evaluation of the tool parameters’ performance against the setting specifications, a score is
calculated. The score is re-evaluated when new sampled data points are received. A more detailed account will be given in Section 3
3) Analysis hnctions: trend charts and dartboard displays are used to detect the common causes of fault. Real-time SPC, run-to-run SPC, and other advanced SPC functions are proposed to detect the special causes of faults. The statistical monitoring functions will be discussed in more detailed in Section 4
2.2 System architecture for a PECVD tool
To demonstrate the proposed monitoring system, a PECVD machine (Applied Materials PSOOO) is
chosen as a study vehicle. In the
lower left corner of the figure is the PC-based tool controller, which is directly communicates with the manufacturing machines for data acquisition and control command execution. Also, an NT SQL is connected with the tool control system (TCS). As a result, the tool data from TCS are transmitted via intranet to the server and-stored in the SQL database. Since the volume of real-time tool data is enormous, the raw data are kept only for the past eight days. Data older then eight days are purged from the raw data table and only their summarized statistics are kept for at least a year. Developed using Borland C++ Builder (BCB), the real-time equipment monitoring system can be implemented in any client PC connected to the intranet. The system is running on the Win 95/NT platform and has the following functions: display windows, specification analysis, SPC analysis, and historical data queries. Note that the real-time analysis module is established on the server to avoid possible transmission delay and thus increase the system efficiency.
The architecture of corresponding system is shown in Figure 1
ase
Figure 1 : The architecture of the real-time equipment monitoring system 2.3 GUI design
Based on the design of the generic hnctions mentioned in Section 2.1 and inputs from users, the graphic user interface (GUI) for the system is designed and developed as shown in Figures 2 to 7. 1) Main window: the layout of the manufacturing fab is displayed in this window, as shown in Fig. 2.
The color of the equipment icon indicates the connection status. yellow for the machines which are connected to the monitoring system and are currently on-line, blue for connected but off-line, and
white for unconnected. Connection status can be changed in the TOOL menu. By clicking the yellow icon, the window of dartboard (also named Bull’s eye) display shows up.
Fig. 2: The first GUT window, CVD equipment layout, of the equipment monitoring system
2 ) Dartboard display: the dartboard window is shown in Fig. 3 . There are 4 PECVD chambers to be
monitored. By double clicking on a chamber’s dartboard, an enlarged dartboard display for that particular chamber is invoked. The dartboard consists of 3 concentric circular regions with different colors: green for SAVE, yellow for WARNING, and red for DANGEROUS. The distance of the observation points from the dartboard cent the target setting. Thus, the engineers can easily recognize the st y. In addition, the number by the HEALTH label is the score of the health index.
epresents the devi f parameters simu
Fig. 3 : Simultaneous monitoring scheme using dartboards
3 ) Configuration: The observation points displayed on the dartboards are not crude observed data but
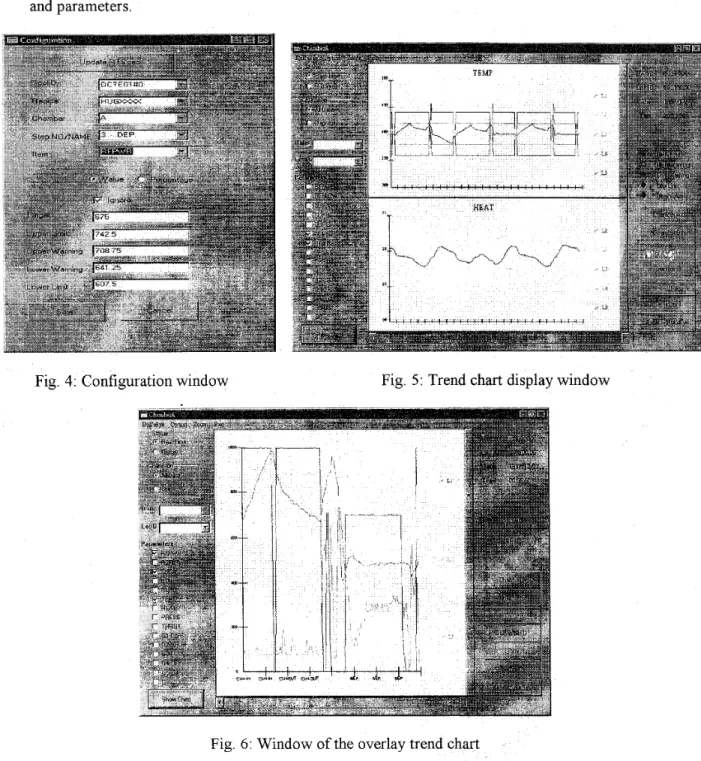
data after normalization against their corresponding target settings and specification limits. In the configuration window shown in Fig. 4, the engineers can flexibly set the target values, upper/lower warning limits, and upper/lower specification limits for different machines, recipes, chambers, steps, and parameters.
Fig. 4: Configuration window Fig. 5 : Trend chart display window
Fig. 6: Window of the overlay trend chart
4) Trend chart display: The trend of real-time or historical tool data is shown in this window. As can be seen in Fig. 5, users can arbitrarily select the parameters to monitor for the entire run or only a
certain step. Also, the warning limits are also shown on the chart to detect possible faults induced by common causes. The historical data can be also display on the trend chart through query functions. Furthermore, engineers can overlay two or more parameters' trends on one chart, as shown in Figure 6, by selecting the overlay fbnction in the OPTION on the menu bar.
5) SPC chart display: Various analysis fbnctions are provided to detect the faults of special causes in
this window. As shown in Fig. 7, the conventional Shewhart chart is used to determine whether the monitored parameter is in statistical control. The engineers can also flexibly set and select the user- defined specifications, control limits, and control rules. In the future, a proposed real-time SPC scheme and other advanced SPC functions will be implemented and shown in this windows as well.
Fig. 7: SPC chart display window
3. Monitoring of equipment performance against specifications
3.1 Development of a simultaneous monitoring scheme
In wafer processing, the equipment's performance is often characterized by a number of parameters.
A usual industrial practice is to monitor each parameter by a trend chart or simply a current-value
display with specification limits as reference. This is somehow difficult for engineers to assess the overall running status of the equipment. Here, we propose a monitoring scheme that has a simple graphical illustration on the equipment's overall health.
Using the PECVD process as an example, suppose we are concerned with around 15 equipment parameters. A normalization procedure of the observations against their specifications will be first performed such that the normalized data can be displayed altogether on a dartboard. For example, the temperature of the chamber is a critical process parameter. The user first inputs the target, say 400" C, and the specification limits, say
*
10" C, for the temperature. When an observed temperature is 402" C. It is normalized to:x loo(%) = +lo(%) Observed value - Target value - 402 - 400
-
USL - LSL 410 - 390
where USL and LSL are the upper and lower specification limits, respectively. This percentage is then reflected on the location and the color of the data point on the dartboard. The location of the data point is solely determined by the magnitude of the percentage while white data points represent positive deviations from the target and black data points represent negative deviations.
When the data points fall on the green area, the corresponding parameters are said to be in good health. When the data points fall on the yellow area, the corresponding parameters are said to be in a worth-watching status. And special attention should be paid to those parameters with data points falling on the red area. Figure 3 shows the monitoring dartboards for three reacting chambers.
As shown in Figure 3, all the variables o erest can be simultaneously displayed on a same board. The distribution of data points provides an vera11 running condition. When the points are concentrated around the center, it indicates a good overall health. In contrast, when data points are scattered over a wide area, it indicates a worrisome situation.
3.2 Evaluation of overall system health
Following the normalization of the observed data against the specifications as demonstrated earlier, a single score on the overall equipment health can be given to hrther simplify the task of monitoring multiple parameters simultaneously.
By using principal component analysis (PCA), the principal components can be ranked by their capability in explaining the variation of the equipment’s performance. Based on the ranking, equipment parameters can be rated over their contributions to the equipment’s performance. Together with proper engineering judgement, the equipment parameters can be hrther classified into three criticality categories: critical, major, and minor. Each category is assigned a weight that will be used in the scoring scheme.
The normalized data on the dartboard falls into one of three severity classes: green, yellow, and red. The severity can be quantified and given a score with scale from 0 to 100 Along with the critkality weights, an overall system health index can be formulated and evaluated using real-time observations of the equipment parameters.
For example, suppose we have a total of n parameters of interest and among the n parameters, n, of them are critical; n2 are major; and n, are minor. That is,
critical parameters:
XI,
X2, ... ,X,,
; major parameters.Yi,
Y2,
... , Yn2 ;*
minor parameters. Z l , 22, ... , Z,, ; andn = nl + 112 + n3
Let SX1, ,Sz,,, be the severity scores for parameters X I , . .,ZfT3. The score is ranging from 0 to 100. When 0 is given, the parameter is said to be out of spec and 100 is given only when the observed value is right on the parameter’s target
To evaluate the health of the equipment, we need first to assign weights to each criticality type of parameters. We use wl: w2: w3 to represent the weight ratio for critical, major and minor parameters, respectively The weight ratio is usually determined by process engineers together with equipment engineers based on their domain knowledge about the equipment and the process and equipment's special characteristics and production situations. In general, we may suggest a ratio like 5:3:1. Then, a weighted geometric mean can be used in the scoring for the equipment's overall health:
N.1
System Health = [(Sxl ..Sxal ]xwf [(S,, ..Sya, )"n2
]Iw'
[(Szl ..Szn, ) 1 ' n 3 JIt can be observed from the above scoring scheme that the severity scores of the parameters are weighted with their criticality. However, when one of the parameters is out of spec, the overall score average will be zero regardless of the parameter's criticality. This is designed to reflect a practical situation where when any of the equipment specifications is exceeded the equipment should be shut down and a thorough investigation should follow.
4. Statistical equipment monitoring
The purpose of SPC approach is to monitor the process and to make sure that any unusual deviation in the process can be detected. The causes that result in the unusual deviation of the process are called special causes or assignable causes. The primary tool of SPC to monitor process and detect special causes is called statistical process control chart.
From a statistical point of view, Shewhart chart is in fact a statistical hypothesis test. The hypothesis of the test is that the mean if remains the same. The null hypothesis (H,) states that the mean remains the same, while the alternative hypothesis (Ha) states that the mean is shifted. The sample statistic is the test statistic and the range of values that are outside the limits is the rejection region. For the Shewhart X
chart, the upper and lower control limits (UCL and LCL) are given as below:
UCL = pu330,
LCL = p - 3 0 , (1)
where
x
is normally distributed with mean ,LL and variancea2;
X is the sample mean of the observations with a sample szie n, and%=
a h . This popular SPC scheme, however, has many assumptions that will become invalid in real-time equipment monitoring. To real-time monitor the equipment, several difficulties are encountered First, the equipment condition is characterized by a number of parameters and there usually exist a great number of them in a typical IC fabrication process. Second, the equipment data include tool signals and process parameters These signals and parameters often emerge l,o be highly auto-correlated and cross-correlated due to the presence of process dynamics and internal closed-loop controls. Two approaches are developed to overcome the difficulties: run-to-run SPC and real-time SPC.4.1 Run-to-run SPC
As shown in Figure 7, observations from the deposition step of every run are taken as a sample. The sample mean is then plotted on the Shewhart control chart. This scheme is referred to as run-to-run SPC scheme because only the sample mean of every run's deposition step is used as the test statistic. This approach avoids the possible autocorrelation among data within a process run and is concerned only with the run-to-run performance of each equipment parameter. The many control runs rules and other advanced schemes developed for traditional SPC approach can be also applied in the run-to-run SPC scheme. This approach, however, could fail to detect faults that only manifest themselves within the process run In the next section, a more advanced real-time SPC is proposed for higher resolution fault detection.
4.2 Real-time SPC
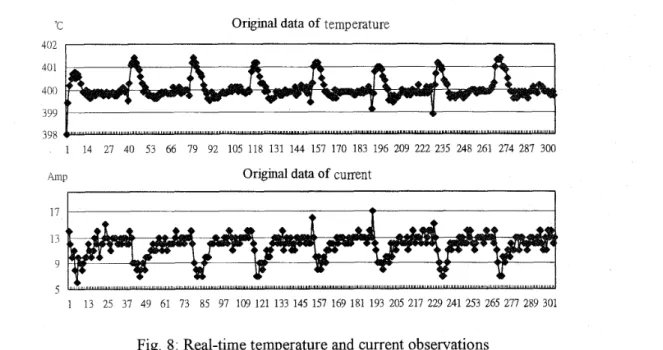
Due to the presence of process dynamics and closed-loop control, the equipment data are usually highly auto-correlated and cross-correlated To more effectively detect faults that could lead to unstable quality output or equipment breakdown, the data correlation patterns are first analyzed. For example, the temperature and the lamp current in the CVD process are auto-correlated and cross-correlated as shown in Figure 8. Both the temperature and the current emerge to be correlated over time and are also correlated to each other. The data analysis will provide basic understanding on the running pattern of the data and prepare us for the real-time fault detection.
'C Orlginal data of temperature
402 I
1 14 27 40 53 66 79 92 105 118 131 144 157 170 183 196 209 222 235 248 261 274 287 300
h11p Original data of current
1 13 25 37 49 61 73 85 97 109 121 133 145 157 169 181 193 205 217 229 241 253 265 277 289 301
Fig. 8: Real-time temperature and current observations
There exist various modeling techniques to filter the data correlation patterns. Most common models are autoregressive integrated moving average (ARIMA) time series models and state-space models, The state-space model can be expressed in autoregressive moving average exogenous (ARMAX) form, which is in effect a special case of multivariate ARIMA models. We consider the ARMAX and multivariate seasonal ARIMA models in our study to analyze the equipment data and to characterize the equipment behavior. Applying the modeling technique to the temperature and current data in Figure 8, the observed data can be fitted with a data correlation pattern. The leftover residuals, as shown in Figure 9, represent the natural disturbance of the equipment and can be used to detect
faults of special causes. -2.5 Residuals of temperature 1.5
r
4It
1 13 25 37 49 61 73 d5 97 109 121 133 145 157 169 181 193 205 217 229 241 253 265 277 289 301 MSE=O. 025 3 Residuals of current 3.5 r I 1.5 -05 MSE=O. 6802Fig. 9: Residuals of temperature and current aRer modeling
An integrated multivariate equipment monitoring consists of common cause and special ccclss. detection schemes. A common cause detection scheme is to monitor the actual observations and/or
fitted values based on the ARMAX or multivariate ARIMA models. This scheme can provide a better understanding on the process’s running condition. The fitted values can be also monitored using the simultaneous monitoring scheme described in the previous section. The relationship between the actual observation and the fitted values can be expressed as:
ACTUAL = FITTED
+
RESIDUALThe fitted values can be seen as the estimate of the process mean conditioning on the past observations. The running pattern of the fitted values actually characterizes a normal behavior of the equipment. When special causes occur, the actual observation will deviate from its normal running pattern and the residual will therefore go past its normal varying range. We can then apply multivariate
SPC techniques, such as T2 statistic, on the residuals to detect special causes. The integrated scheme is depicted in Figure 10.
Equipment
.
Tool Process
Data
Filtering
Residuals Raw Data / Fitted Values
Detection (Multivariate SPC)
Common Cause Detection
Fig. 10: Integrated real-time statistical monitoring scheme
5. Conclusions
In this paper, we have described an integrated real-time monitoring approach. We have also demonstrated how this approach was applied to a PECVD tool in TSMC Fab IV The integrated approach combines various monitoring techniques to monitor the real-time equipment data. Any possible faults can be therefore detected during wafer processing. This early detection can prevent excursions on wafer quality and improve the process yield. The evaluation of the equipment’s overall health can also provide valuable information for effective preventive maintenance (PM)
References
[ 11 C. Cunningham, “NTRS Factory Integration 1997 Update,” Proceedings SEMA TECH AECIAPC Workshop IX pp. 2-1 1, 1997, Lake Tahoe
[2] L Peters, J. Griffin and R. Slunner, Cost Effective ICManufacturing 1995.
[ 3 ] Montgomery, D C., Introduction to Statistical Quality Control, 2”‘ ed New York: Wiley, 1990. [4] C. J Spanos, H Guo, A. Miller, J Levine-Parrill, “Real-Time Statistical Process Control Using
Tool Data,” IEEE Transactions on Semiconductor Manufacturing, 5, 4, pp. 308-3 18, 1992 [ 5 ] D. C Montgomery and D. J Friedman, “Statistical Process Control in a Computer-Integrated
Manufacturing Environment,” Statitical Process Control in Automated Manufacturing, edited by J. Keats and N. Hubele, pp 67-88, Marcel Dekker, Inc., N Y .
[6] S Crowder, “An Application of Adaptive Kalman Filtering to Statistical Process Control,” Statitical Process Control in Automated Manufacturing, edited by J. Keats and N. Hubele, pp.
109-128, Marcel Dekker, Inc., NY.
[7] S Rangan, C Spanos .and K. Poolla, “Modeling and Filteringof Optical Emission Spectroscopy Data for Plasma Etching Systems,” ISSM Conference Proceedings, pp B4 1-44, 1997, San Francisco
[SI F B Alt and N D. Smith (1988) “Multivariate Process Control,” in Handbook of Statzstics, Vol. 7 , edited by P R Krishnaiah and C R Rao, Elsevier Science Publishers B. V. pp. 333-351. [9] S. F. Lee, E D. Boskin, H C. Liu, E Wen, C. J Spanos, “RTSPC A Software Utility for Real-
Time SPC and Tool Data Analysis,” IEEE Transactions on Semiconductor Manufacturing, 8, 1,
pp. 17-25, 1995.
[IO] R. J Bunkofske, N. T. Pascoe, J. Z. Colt, M. W. Smit, “Real-Time Process Monitoring,” 1996
I E E / S N I Advanced Semiconductor Manufacturing Conference, pp.3 82-3 90.
[ 1 11 Agmon, Y , “Standards Compliant Software for Semiconductor Manufacturing,” pp. 67-69, Semiconductor Fabtech.
[12] P. O’Sullivan, J. Martinez, J. Durham and S. Felker, “Advanced Fault Detection for the Semiconductor Industry,” Future Fab International, pp. 71 -73, 1996.
[ 131 J. Mott, “A Comparison of Linear and Non-Linear Multivariate Methods, for Fault Detection and Classification,” Proceedings SEMATECH AEC/APC Workshop IX, pp 446-454, 1997, Lake Tahoe.
[ 141 T. Dalton, “Evaluation of Triant ModelWareRT Sematech
p
-Site,” Proceedzngs (Supplement) [15] J.-H. Byun, E. A Elsayed, A. Chen and R. Bruins, “A Producibility Measure for QualitySElMATECHAECAPC Workshop
Ix
pp. 221-235.Characteristics with Design Specifications,” Quality Engineering, 10, 2, pp. 3 5 1-368, 1997-98.