行政院國家科學委員會專題研究計畫 成果報告
快速穩定態磁振造影及其臨床應用之進階研究(3/3)
研究成果報告(完整版)
計 畫 類 別 : 個別型 計 畫 編 號 : NSC 95-2221-E-002-179- 執 行 期 間 : 95 年 08 月 01 日至 96 年 09 月 30 日 執 行 單 位 : 國立臺灣大學電機工程學系暨研究所 計 畫 主 持 人 : 鍾孝文 共 同 主 持 人 : 陳震宇 計畫參與人員: 博士班研究生-兼任助理:吳明龍、吳珮歆、施逸優、黃尹宬 碩士班研究生-兼任助理:曾慶昭、林智敏、程正傑、張如因 報 告 附 件 : 出席國際會議研究心得報告及發表論文 處 理 方 式 : 本計畫可公開查詢中 華 民 國 96 年 11 月 08 日
行政院國家科學委員會補助專題研究計畫
■ 成 果 報 告
□期中進度報告
快速穩定態磁振造影及其臨床應用之進階研究
計畫類別:■ 個別型計畫 □ 整合型計畫
計畫編號:NSC 95-2221-E-002-179-
執行期間:95 年 8 月 1 日至 96 年 7 月 31 日
計畫主持人:鍾孝文
共同主持人:陳震宇、黃騰毅
計畫參與人員:
成果報告類型(依經費核定清單規定繳交):□精簡報告 ■完整報告
本成果報告包括以下應繳交之附件:
□赴國外出差或研習心得報告一份
□赴大陸地區出差或研習心得報告一份
■出席國際學術會議心得報告及發表之論文各一份
□國際合作研究計畫國外研究報告書一份
處理方式:除產學合作研究計畫、提升產業技術及人才培育研究計畫、
列管計畫及下列情形者外,得立即公開查詢
□涉及專利或其他智慧財產權,□一年□二年後可公開查詢
執行單位:台灣大學電機系
中 華 民 國 96 年 10 月 31 日
行政院國家科學委員會專題研究計畫結案報告
快速穩定態自由旋進磁振造影及其臨床應用之進階研究(3/3)
Advanced rapid steady-state MRI and clinical applications (3/3)
計畫編號:NSC95-2221-E-002-179
執行期限:95 年 8 月 1 日至 96 年 7 月 31 日
主持人:鍾孝文教授 台大電機系
[email protected]
一、中文摘要 文獻中曾報導,平衡穩定態自由旋進技術 由於其無幾何扭曲之特性,使用於大腦功能性 磁振造影具有提供極高空間解析度之應用潛 力。理論上,平衡穩定態自由旋進技術中之射 頻脈衝序列長度是沒有上限的;也因此只要時 間解析度不構成限制因子,影像的矩陣大小 (亦即空間解析度)亦不受限。然而,空間解 析度提高時,伴隨的信號雜訊比降低可能使微 小的腦功能信號難以可靠觀測。因此,在本計 畫中,我們以臨床的 3.0-Tesla 磁振造影系統 將平衡穩定態腦功能性磁振造影提高到 0.38 mm3 之空間解析度。並針對信號雜訊比與功 能性信號百分比大小兩項因素,探討持續提高 空間解析度之優勢。 關鍵詞:平衡穩定態自由旋進、功能性磁振 造影、空間解析度、視覺刺激。 AbstractThe transition-band balanced steady-state free precession (SSFP) functional MRI (fMRI) technique was reported to exhibit strong potential for high resolution fMRI due to its distortion-free nature. Theoretically, the length of RF pulse train in SSFP fMRI, and consequently the image matrix size, is unlimited at the expense of reduced temporal resolution. However, as voxel size reduces at higher resolution, decreased image signal-to-noise ratio (SNR) can become a critical concern to observe minute neuronal activations. Therefore, in this study, we attempted to investigate the feasibility of SSFP fMRI at sub-millimeter in-plane resolution to achieve a voxel volume of 0.38 mm3 using a clinical 3.0-Tesla system. In
addition, the SNR and percentage activation signals were evaluated as a function of spatial resolutions to observe the benefits of decreased voxel size.
Keywords: balanced steady-state free
precession, functional MRI, spatial resolution, visual stimulation.
二、計畫緣由與目的
SSFP fMRI technique was reported to have potential for high resolution fMRI due to its distortion-free and steady-state image [1,2]. Because steady-state signal is maintained through acquisition of all k-lines, without experiencing T2* decay as in echo train of EPI, SSFP fMRI does not suffer from blurring artifact and true high resolution imaging can be achieved. Theoretically speaking, the length of RF pulse train, and therefore matrix size, in SSFP fMRI is not limited, if encoding gradient strength allows and lower temporal resolution is acceptable. However, as voxel size reduces at higher resolution, decreased image signal to noise ratio (SNR) can be a concern to observe minute neuronal activation. For fMRI experiments performed at high field, SNR can be gained from increased field strength, especially when virtually no image distortion would be brought about in SSFP fMRI image. In this study, we investigated the feasibility of SSFP fMRI at sub-millimeter resolution. Activation maps from high resolution SSFP fMRI were shown with more delicate alignment between activated areas and grey matter cortical structures on T1-weighted images. Besides, SSFP fMRI were evaluated at multiple resolutions to observe the effects of decreased voxel size.
三、材料與方法
To explore the possibility of SSFP fMRI technique at very high resolution, three volunteers (two males and one female, 24-30 yrs) underwent fMRI with matrix size of 512x512. All experiments were performed on a 3.0 Tesla system (Philips Achieva, Best, the Netherlands), with a surface coil and high order shimming covering occipital lobe. IIR-filtered frequency stabilization was applied to compensate for temporal frequency drift due to systemic heating, which can be more prominent in high resolution SSFP fMRI [3]. A single transverse slice was carefully placed across visual cortex and parallel to calcarine sulcus by referring to a set of three dimensional T1-weighted images acquired firstly. In this study, three fMRI trials from a 30-year-old subject were demonstrated with 512x512 matrix (TR/TE/flip angle: 10ms/5ms/60, 1 slices, voxel size 0.43x0.43x2mm3) and off resonance setting of -8.3Hz, 0Hz, and 8.3Hz, separately. In each trial, visual stimulus (5Hz checkerboard, 4 ON, 5 OFF, 8 frames/block, 5.12 sec/frame) was given in 72 dynamic scans. A set of high resolution T1-weighted images (voxel size: 0.43x0.43x2mm3) were also acquired as a reference of detailed cerebral structure. Tight foam padding and fixing belts on patient bed were used to prevent head motion. To simulate fMRI at lower resolution in the same experimental condition, SSFP fMRI images of different sizes (64, 128, 256, 384) were then obtained by down sampling k-space data from three 512x512 trials. A total of 15 sets SSFP fMRI (5 matrix sizes, 3 sets/size) were analyzed by Independent Component Analysis (ICA) [4]. Activation signal level was evaluated by calculating the averaged difference between activated and rest states, with first three time points of each block excluded. Signal to noise ratio (SNR) was also calculated from the first dynamic scan of each image set, by comparing parenchyma signal in occipital lobe with image background.
四、結果與討論
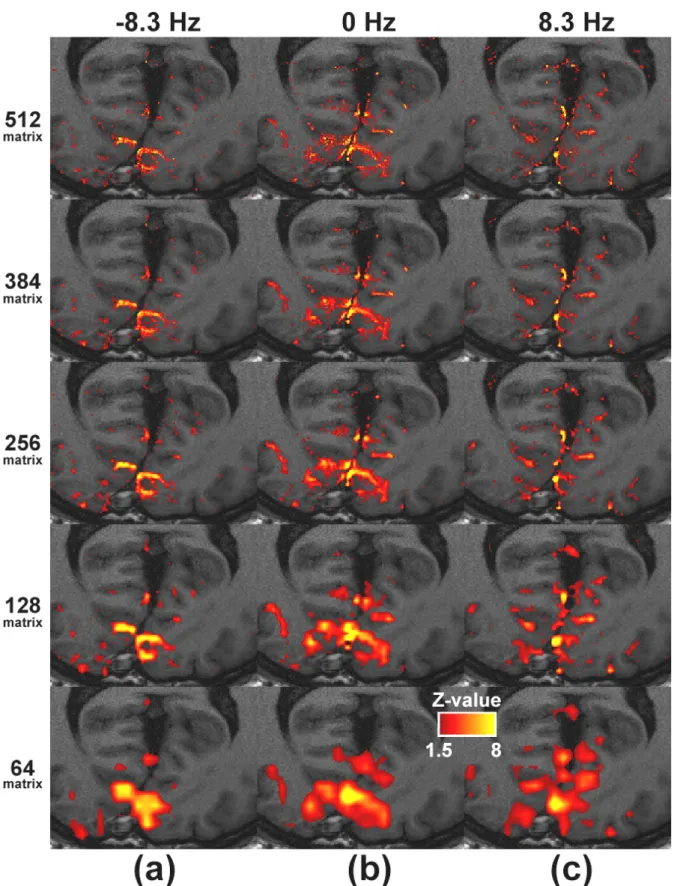
Figure 1 showed activation maps from 15 sets of SSFP fMRI with off resonance setting of
-8.3Hz, 0Hz, and 8.3Hz were shown in (a), (b), and (c), separately. As shown in previous studies, slight change of frequency setting altered SSFP fMRI sensitivity areas and therefore changes of activation pattern [1]. For image sets with same off frequency setting, activation pattern agreed nicely although spatial resolution differed. Note that with 64 or 128 matrix size of conventional fMRI, activation pattern is rather coarse compared with underlying T1-weighted images. As fMRI resolution increases, activated areas accorded more delicately with gray matter borders of T1-weighted images. In addition, at high resolution, mostly activated voxels seemed to be microvessels in cortex, appearing as tiny bright spots. Figure 2 plotted the SNR of each trial at different image resolution. It can be seen that SNR decreased as image matrix size increased. With matrix size of 384 and 512, SNR dropped substantially below 10, as a consequence of reduced voxel size by factors of 36 and 64 compared with 64x64 images. Activation signal versus matrix size was plotted in Figure 3. In all three fMRI trials, a common trend observed was that signal change increased as image resolution went higher, even though overall SNR dropped substantially at highest resolution as shown in Figure 2. At highest resolution, activation signal (ranging 14.7-17.1%) was larger than 14% in all trials.
Our results demonstrated the feasibility of distortion free and ultra high resolution SSFP fMRI on 3T system. Although temporal resolution of high resolution SSFP fMRI was relatively low compared with single-shot EPI, it could be improved by using parallel imaging [5]. The largely level baselines of activation time curves (not shown here) revealed that our IIR-filtered frequency stabilization seemed to effectively compensate for temporal field drift even when intensive gradient switching was applied. From Figure 1, identification of a specific cortex boarder or gray matter nucleus seemed to be more possible with fMRI matrix size larger than 256x256, implying that spatial approximated results were obtained from conventional fMRI. A trend of elevated activation signal with increased fMRI resolution was observed, which agreed with results of previous studies [1,2,6]. However, to the best of our knowledge, results of SSFP fMRI at very
high resolution (voxel size < 1mm3) has not been reported before. Therefore, experiment results from other group for validation are not available at this moment. Despite increased activation signal (> 14%) at matrix size of 512x512, substantial SNR drop was also observed with voxel reducing factor of 64, which was predictable according to basic rules of MRI. Reduced partial volume effect in a single voxel is an explanation for increased activation signal in high resolution SSFP fMRI. However, it has to be noted that additional experiment is required to find out to what extent reduced voxel size contributes to increased activation signal and the optimized fMRI resolution considering functional contrast.
五、計畫成果自評
Our efforts spent in this project have created results substantially greater than that mentioned in this brief report, which is an excerpted version of a published conference paper in 2007 Proceedings of the International Society for Magnetic Resonance in Medicine (7). The concept of fast MR imaging has also led to other related investigations in MR spectroscopic imaging, leading to two journal articles (one published and one revised) in Magnetic Resonance in Medicine (8,9). Overall, the project has generated about ten conference papers presented in the 2007 Annual Meeting of the International Society of Magnetic Resonance in Medicine, which raised substantial attention from many international research teams. The achievements from this project have strong potential both in daily clinical examinations for pre-surgical planning in patients with brain tumors and in psychological investigations involving the cerebral columns. In short, although project continuation is still needed for this relatively challenging topic (i.e., fMRI at sub-millimeter resolution without geometric distortions), we have confidence that the execution of our three-year project can be regarded as highly successful, with positive impact on further imaging acceleration and better utilization of MRI in routine diagnosis. 六、參考文獻
[1] Miller KL, Hargreaves BA, Lee J, Ress D, deCharms RC, Pauly JM. Functional brain imaging using a blood oxygenation sensitive steady state. Magn Reson Med 2003;50:675- 683.
[2] Miller KL, Smith SM, Jezzard P, Pauly JM. High-resolution FMRI at 1.5T using balanced SSFP. Magn Reson Med 2006;55:161-170. [3] Wu ML, Wu PH, Huang TY, Shih YY, Chou MC, Liu HS, Chung HW, Chen CY. Frequency stabilization using infinite impulse response filtering for SSFP fMRI at 3T. Magn Reson Med 2007;57:369-379.
[4] McKeown MJ, Makeig S, Brown GG, Jung TP, Kindermann SS, Bell AJ, Sejnowski TJ. Analysis of fMRI data by blind separation into independent spatial components. Hum Brain Mapp 1998;6:160-188.
[5] Pruessmann KP, Weiger M, Scheidegger MB, Boesiger P. SENSE: sensitivity encoding for fast MRI. Magn Reson Med 1999;42:952- 962.
[6] Lee J, Santos JM, Conolly SM, Miller KL, Hargreaves BA, Pauly JM. Respiration-induced B0 field fluctuation compensation in balanced SSFP: real-time approach for transition-band SSFP fMRI. Magn Reson Med 2006;55:1197- 1201.
[7] Wu ML, Wu PH, Huang TY, Shih YY, Chou MC, Liu HS, Chung HW, Chen CY. SSFP fMRI at 0.37 mm3 voxel volume: effects of spatial resolution on SNR and functional sensitivity. Proc Intl Soc Magn Reson Med 2007;2:1950. [8] Tsai SY, Posse S, Lin YR, Ko CW, Otazo R, Chung HW, Lin FH. Fast mapping of the T2 relaxation time of cerebral metabolites using proton echo-planar spectroscopic imaging (PEPSI). Magn Reson Med 2007;57:859-865. [9] Tsai SY, Otazo R, Posse S, Lin YR, Chung HW, Lin FH. Accelerated proton echo planar spectroscopy imaging (PEPSI) using GRAPPA with large-N phased-array coils. Magn Reson Med 2007, revised.
七、圖表
Figure 1. Activation maps (colored) overlaid on high resolution transaxial anatomical T1-weighted images across the primary visual cortex. Trials with off resonance setting of -8.3Hz, 0Hz, and 8.3Hz were separately shown in (a), (b), and (c), respectively. Note the excellent registration of the activation areas on the microvessels surrounding the gray matter, especially for the high-resolution images.
Figure 2. Image SNR calculated from the first dynamic scan of all data sets. The decreasing trend is consistent with theoretical predictions.
Figure 3. Activation signal level versus fMRI matrix size. Note that as voxel size decreases, the percentage functional activation signals increase despite of the SNR reduction shown in Fig.2. The phenomena are attributed to increased specificity and reduced partial volume effects at high spatial resolution.
1
國科會
補助出席國際會議報告
The Fifteenth Annual Meeting of the International
Society for Magnetic Resonance in Medicine
“國際醫用磁共振學會第十五屆年會”
會議報告
鍾孝文教授 台大電機系
九十六年五月二十九日
2
行政院國家科學委員會出席國際會議補助報告
國際醫用磁共振學會第十五屆年會
The Fifteenth Annual Meeting of the International Society
for Magnetic Resonance in Medicine
2006/5/19~2005/5/25, Berlin, Germany
鍾孝文教授 台大電機系
[email protected]
一、參加會議經過
國 際 醫 用 磁 共 振 學 會 ( International Society for Magnetic Resonance in Medicine;ISMRM)之年會一向以匯集各項先進磁共振(magnetic resonance; MR)技術發展的論文報告而著稱,今年於德國柏林市舉行的第十五屆年會亦不 例外。由於 MR 在國內的發展日趨重要,人員素質也逐漸趨於整齊,因此雖然 單程飛行時間長達十三小時(不含轉機之延誤),本年度台灣地區參加人員(含 放射科醫師以及研究人員在內)較去年之四十人以上更為增加,粗略估計有五十 人以上,並且臨床醫師參與度也明顯提高。本人實驗室研究群今年共發表二十一 篇文章,較之去年的二十篇仍有持續進展,並包括五場演講報告,遠超出國內其 他單位之表現。實驗室含研究生、畢業學生等超過二十人參加此次會議,其中九 人獲得 ISMRM Student Stipend Award、四人獲得 ISMRM New Entrant Award。
會議於德國柏林市西側的 International Convention Center 舉行,議程共分五 天 進 行 , 之 前 再 外 加 兩 天 的 educational courses 。 單 是 五 天 內 的 Scientific Meetings 總共有超過九百八十場的 oral presentations 以及兩千九百個 poster presentations,參加人數將近約七千人。場地空間比前一年西雅圖市的會議大非 常多,使得聆聽不同場地的演講所需要的腳程增加不少。壁報展示的空間相對較 為集中,閱覽次數也如去年一樣甚高。會場附近旅館價格均甚昂貴,為節省公帑, 本年度本人研究群比照去年方式,租用 weekly rental 的一般公寓共計五間,除剛 好距離會場不遠之外,在人數眾多的情形下也得以節約住宿支出。此外,由於公 寓內廚房器具一應俱全,在三餐上亦可選擇自行烹煮,避免飲食不習慣所產生之 水土不服情形。 二、與會心得 會議一開始邀請 2003 年以 MRI 上卓越貢獻而獲得諾貝爾生理醫學獎的 Sir Peter Mansfield 作開場的年度 Mansfield Lecture。很遺憾由於健康因素,臨 時由 Peter Morris (按:為與 Mansfield 共同著有 MRI 書籍之同儕作者)代替。 演講當中對於如何在資源有限的原始環境中一步步推動研發、如何在未知的磁場 生物效應下以自身從事實驗等等,都有概略性的介紹,大師風骨令人印象深刻。 另一位諾貝爾獎得主 Paul Lauterbur 則因在數月前過世,而由中央研究院何潛院 士在週四早晨作 Tribute lecture。儘管兩位重量級人士獲獎已晚,距離當初突破
3
性的 MRI 進展已近三十年,獲獎當時健康情況也都欠佳,但如今舉世對其貢獻 仍給予完全的肯定。可見磁振造影與頻譜技術在人體各部位應用的顯著正面影 響,技術研發的角色在這當中仍不容置疑。以下僅就部分領域,節錄一些實際例 證以供分享。
硬體方面的技術發展,在 ultra-high field systems(例如7.0 Tesla whole body MRI)上,RF transmission array coils 報告數量約與去年相當,仍是以 adiabatic pulse、spatial-spectral selective pulse 等數學運算的變化為主。此方面由於技術已 甄成熟,在本年度會議中已由 Prof. Elliot McVeigh 作 plenary lecture 之報告。 另外值得注意的是今年有一整個 oral session 全部是高達 96 至 128 通道的 RF transmission 或 receive array coils(32 channel 相形之下顯得委屈)。此方面 由於國際間學校單位研究群明顯已得到廠商在 receiver channels 硬體上之支 援,整體觀之,國外廠商似乎有將 large-N received coil array 全面商品化之趨勢。
Left: Flexible 64-element anterior RF receiver coil array, with covers removed, on a subject lying on another 64-element posterior array to achieve acceleration factors as large as 25. Right: Coronal images acquired using single-shot fast spin-echo sequence at different depths, with low echo train length. See ISMRM Abstract #244 entitled 128-Channel Body MRI with a Flexible High-Density Receiver-Coil Array by Hardy CJ et al. from GE Medical Systems and GE Global Research, New York, U.S.A.
在神經放射線領域,類似於 diffusion spectrum imaging(DSI)的衍生方式 (如 Q-ball imaging 以及其 variants 等等)與去年在數量上相當,不再有持續性 的增加,而 DSI 本身的報告在去年的明顯減少之下今年更為稀少,料想是由於掃 瞄時間過長所造成的實用性問題。Neural fiber tractography 的演算法如去年一般 仍有新發展,但已明顯都被排在 poster sessions,反而是探討 tractography 演算法
Professor Paul C Lauterbur, the 2003 Nobel prize laureate, passed away Tuesday, 27 March, at the age of 77 (from the website of ISMRM).
4
限制的論文開始有增加並且排在極為重要的講演時段,對於擴散影像 group comparison 的結果也提出不少的質疑。
Areas of reduced anisotropy in schizophrenics compiled from analysis results obtained from nine different research groups using the same source data. The green voxels in I highlight the skeletonised search volume, while the orange voxels indicate reduced anisotropy in schizophrenics. The results showed minimal consistency in voxel-based group comparison using DTI data. See ISMRM Abstract #74 entitled What Happens
When Nine Different Groups Analyze the Same DT-MRI Data Set Using Voxel-Based Methods? by Jones D et al. from Cardiff University Brain Repair and Imaging Centre,
School of Psychology, Cardiff, Wales, United Kingdom.
本年度另一個重要的課題,是有關於 Gadolinium-based MRI 顯影劑所引起 的腎因性全身纖維化病變(nephrogenic systemic firbosis;NSF)。此病變在 1997 年首先發現病例發表,患者皮膚的纖維化嚴重程度可達硬如石頭,關節無法伸 展,有些需終身倚靠輪椅,重者可引起死亡,但當時並不知道引起病變的原因。 由於歐盟與北美公衛系統的完善與發達,在經過長期的回顧性追蹤後發現病患均 在過去曾接受 MRI 檢查與顯影劑注射,並且都有腎功能方面的缺損(按: Gd-based non-specific MRI 顯影劑均以尿液作為排泄管道),因而開始懷疑與 MRI 顯 影 劑 無 法 及 時 排 出 體 外 有 關 。 而 研 究 者 在 皮 膚 biopsy 檢 體 驗 出 gadolinium,更是為此假說提出了有力的支援。儘管目前並無直接證據顯示一定 是由 MRI 顯影劑引發,但醫界與學界已對全世界發出警訊,並且對於臨床 MRI 檢測做出更為保守的建議。
Photograph (left) and T1-weighted MR image (right) of a patient with nephrogenic systemic fibrosis. Due to its likely association with the use of Gd-based contrast agents, the ISMRM (as well as other societies such as RSNA) has issued global warnings regarding proper use of all Gd-based contrast agents.
5
除上述幾個例子之外,平衡穩定態自由旋進(balanced steady-state free precession; SSFP)快速成像技術以及其 variants 在本年度仍佔有相當大的篇幅。 應用於腦功能方面則數量不多,但也衍申為 transition band 及 pass band SSFP fMRI。美國 Stanford 大學與德國 Freiburg 大學在這方面表現不錯,本人研究群 與上述兩校關係匪淺(按:本人去年夏天在 Stanford 訪問兩個多月,今年該校之 報告均為去年夏天 group meeting 之內容。而 Freiburg 大學則已先後接受三位本
人博士研究生前往交換),因此也由討論中得到一些經驗可供參考。
Visual field mapping results. Activation phase maps overlaid on anatomy (a) and inflated cortical surface (b). (c) Color code used for the phase maps. (d) Temporal signal plotted for a single activated voxel. The results suggest that passband SSFP fMRI provides an alternative method to conventional BOLD and solves some of BOLD’s major limitations in terms of coverage (signal dropout) and resolution. See ISMRM Abstract #694 entitled Full-Brain Coverage and High-Resolution Imaging
Capabilities of Passband SSFP fMRI at 3 T by Lee JH et al. from Department of
Electrical Engineering at Stanford University, U.S.A.
至於本人研究群過去所發展的 Propeller 相關研究,如今也引起大量的重視, 本年度已獨立成為單一 poster session,有幾篇不錯的論文散見於眾多 posters 中。 除了研究單位之外,廠商所投入的研發也十分積極。
(a) Propeller image without T2 decay compensation; (b) image with T2 decay compensation; c) and d) are point spread functions corresponding to images a & b, respectively, showing the effectiveness of the compensation method. See ISMRM Abstract #1733 entitled Corrections to Accelerated Propeller Acquisition to Maintain
Contrast and Reduce T2 Decay Artifacts by Chang S et al. from GE Healthcare,
6 三、考察參觀活動 本年度在時間上並不充裕:週日約中午時間抵達會場報到,週五會議結束後 次日清晨即離開德國,中間時段全數在會場吸取新知,因此無暇抽空參觀柏林市 區學校或觀光景點。 四、建議 近幾年來,國內在 MR 領域的發展已漸具規模特色。台大醫院、陽明大學、 台北榮民總醫院、長庚大學、中研院生醫所、高雄醫學大學、台中榮總、新店慈 濟醫院等單位一如往年都有階段性成果發表,其中高雄醫學大學化學系王雲銘教 授的 contrast agent study 更獲得壁報論文獎,值得慶賀。本人於台大電機系與三 軍總醫院、台大醫院、高雄榮民總醫院等醫學中心合作的研究成績則一如去年, 單以二十一篇論文的數量而言,排名約在全世界前十大左右,遙遙領先國內其他 單位。五個學生的 oral presentations 表現不俗,與聽眾問答逐漸得以自如。更可 喜的是本人已畢業的研究生,如今已可帶領自己的研究團隊,以中山大學、逢甲 大學、台灣科技大學等國內的角色出發走向國際,與世界一流研究群分庭抗禮, 足見長期耕耘的成效。雖然會議論文數量並非世界一流的唯一指標,但研究團隊 所走出的第一步已提供了良好基礎,對往後提升研究品質與影響力更有實質助 益。
在過去會議中,本人與 Massachusetts General Hospital、Brigham Women Hospital 、 University of Pennsylvania 、 University of Freiburg 、 Johns Hopkins University 等多所名校醫學中心均曾深入討論有關磁振造影人才培育方面的議 題。如今上述單位均已接受本人研究生以國際交換學生身份前往進修,也逐年看 到實質成果,令人欣慰。今年則將觸角繼續伸往 Columbia University、University of California at Irvine、Boston University、Duke University、University of New Mexico 等單位。綜合上述討論,個人以為國內的磁振造影發展,已跳脫了十年 前的默默無聞,也比五年前僅靠少數幾人撐場面要好得多。國內相關單位如國科 會等,若願意提升台灣磁振造影研究群在國際間的地位,現在應該正是時候。尤 其對於已有良好基礎的年輕學者(如本次發表 16 篇論文的台科大黃騰毅教授、 發表 10 篇論文的台大林發暄教授、發表 9 篇的陽明大學林慶波教授、發表 8 篇 論文的逢甲大學劉益瑞教授、發表 7 篇即將返台任教的台大吳文超教授、發表 7 篇的台科大林益如教授、發表 6 篇的中山大學柯正雯教授、發表 6 篇的三軍總醫 院阮春榮醫師等)除更應加以重視、賦予高度研究自由度之外,也應追蹤其後續 期刊論文之發表,據以提供適當研究資源。1997 年 ISMRM YIA 得獎者林宜蓁博 士返台,中研院生醫所僅給予博士後研究職位,相關支援付之闕如,在不到兩年 後林博士便離開台灣往國外發展,不啻為人才的一大損失。而在本人疾呼重視有 潛力的年輕學者的情形下,去年方返國的國家衛生院陳南圭教授(今年亦發表 6 篇論文)又已決定離台赴美,去年本人報告中的預測不幸成為事實。單以此次參 加會議為例,前所述及的優秀年輕學者竟有兩人得不到國科會出國參加會議的經 費補助,未免過於離譜!因此,國內應審慎加以思考人力與物力分配的邏輯,不 應再一味依據資深程度來補助大型儀器的擁有者。如此才是鼓勵高品質研究的正 確方式。此次國科會若不深思,難保明年不會再度發生如今年般的傑出人才流失。
7
五、攜回資料名稱及內容
本次參加會議共攜回 ISMRM 2007 Proceeding CD-ROM 一片、以及廠商提 供產品訊息等等。
六、附錄
本次本人研究群所發表論文多達二十一篇。為節省篇幅與記憶體空間,此處 僅附五篇代表性論文。其餘則僅以條列方式呈現如下。
1. Juan CJ, Tzuo TT, Liu YJ, Huang TY, Liu HS, Wang CY, Chung HW, Chen CY (2007) Simultaneous measurement of cerebral blood volume, cerebral blood flow, and cerebral blood oxygenation after hypercapnia challenge: a preliminary result, in Joint Annual Scientific Meeting of the International Society of Magnetic Resonance in Medicine / European Society for Magnetic Resonance in Medicine and Biology, #109, Berlin, Germany.
2. Peng HH, Huang TY, Chung HW, Wu CC, Chen WS, Tseng WYI (2007) Simultaneous monitoring of temperature and magnetization transfer during HIFU transmission: ex vivo experiment, in Joint Annual Scientific Meeting of the International Society of Magnetic Resonance in Medicine / European Society for Magnetic Resonance in Medicine and Biology, #162, Berlin, Germany.
3. Hsu JS, Lin JM, Huang TY, Liu YJ, Lin YR, Chung HW (2007) Dynamic cardiac imaging using phase-modulated undersampled x-f spectra from multiple cardiac cycles, in Joint Annual Scientific Meeting of the International Society of Magnetic Resonance in Medicine / European Society for Magnetic Resonance in Medicine and Biology, #299, Berlin, Germany.
4. Liu HS, Chung HW, Chou MC, Wang CY, Juan CJ, Guo DB, Cho NY, Chen CY (2007) Assessment of longitudinal blood-brain barrier (BBB) changes using MR tracer kinetics in human brain infarction, in Joint Annual Scientific Meeting of the International Society of Magnetic Resonance in Medicine / European Society for Magnetic Resonance in Medicine and Biology, #509, Berlin, Germany.
5. Tsai SY, Posse S, Lin YR, Chung HW, Lin FH (2007) Reduction of lipid contamination in MR spectroscopic imaging using signal space projection, in Joint Annual Scientific Meeting of the International Society of Magnetic Resonance in Medicine / European Society for Magnetic Resonance in Medicine and Biology, #777, Berlin, Germany.
6. Shih YY, Huang TY, Peng HH, Chung HW, Chen CY (2007) Amide proton transfer (APT) imaging for the monitoring of heating treatment by high intensity focused ultrasound (HIFU): phantom experiments, in Joint Annual Scientific Meeting of the International Society of Magnetic Resonance in Medicine / European Society for Magnetic Resonance in Medicine and Biology, #1126, Berlin, Germany.
7. Tsai SY, Posse S, Lin YR, Ko CW, Otazo R, Chung HW, Lin FH (2007) Mapping T2 relaxation time of cerebral metabolites using proton-echo planar spectroscopic imaging (PEPSI), in Joint Annual Scientific Meeting of the International Society of Magnetic Resonance in Medicine / European Society for
8
Magnetic Resonance in Medicine and Biology, #1238, Berlin, Germany.
8. Wang FN, Huang TY, Chuang TC, Chen NK, Chen CY, Chung HW, Kwong KK (2007) PROPELLER EPI: application to ASL perfusion imaging using FAIR, in Joint Annual Scientific Meeting of the International Society of Magnetic Resonance in Medicine / European Society for Magnetic Resonance in Medicine and Biology, #1412, Berlin, Germany.
9. Chao TC, Liu YJ, Huang TY, Wang FN, Chung HW, Wu MT, Chen CY (2007) High resolution diffusion tensor image using segmented FOV, in Joint Annual Scientific Meeting of the International Society of Magnetic Resonance in Medicine / European Society for Magnetic Resonance in Medicine and Biology, #1495, Berlin, Germany.
10. Hsu CS, Chou MC, Liu YJ, Juan CJ, Lai TC, Tzuo TT, Chung HW, Chen CY (2007) Application of geometric indices of diffusion tensor imaging on ischemic cerebral infarction: comparison of two definitions, in Joint Annual Scientific Meeting of the International Society of Magnetic Resonance in Medicine / European Society for Magnetic Resonance in Medicine and Biology, #1527, Berlin, Germany.
11. Cheng YW, Chou MC, Chen CY, Chung HW (2007) Improving diffusion tensor fiber tracking by acquiring additional FLAIR EPI data to eliminate CSF contamination, in Joint Annual Scientific Meeting of the International Society of Magnetic Resonance in Medicine / European Society for Magnetic Resonance in Medicine and Biology, #1567, Berlin, Germany.
12. Wang FN, Chuang TC, Huang TY, Chen NK, Chung HW, Kwong KK (2007) Further investigation on the SNR and de-blurring effect of the weighting window on PROPELLER EPI reconstruction, in Joint Annual Scientific Meeting of the International Society of Magnetic Resonance in Medicine / European Society for Magnetic Resonance in Medicine and Biology, #1736, Berlin, Germany.
13. Tsai SY, Posse S, Lin YR, Ko CW, Otazo R, Chung HW, Lin FH (2007) Proton echo-planar spectroscopic imaging (PEPSI) on the human brain using a 32-channel coil array and GRAPPA reconstructions at 3T, in Joint Annual Scientific Meeting of the International Society of Magnetic Resonance in Medicine / European Society for Magnetic Resonance in Medicine and Biology, #1755, Berlin, Germany.
14. Chiu SC, Huang TY, Chung HW, Chen NK (2007) Correction for gradient-echo EPI distortions using embedded low-resolution field mapping and k-space energy spectrum analysis, in Joint Annual Scientific Meeting of the International Society of Magnetic Resonance in Medicine / European Society for Magnetic Resonance in Medicine and Biology, #1835, Berlin, Germany.
15. Wu ML, Huang TY, Wu PH, Shih YY, Chou MC, Liu HS, Chung HW, Chen CY (2007) Automatic slice-dependent frequency adjustments for SSFP fMRI, in Joint Annual Scientific Meeting of the International Society of Magnetic Resonance in Medicine / European Society for Magnetic Resonance in Medicine and Biology, #1944, Berlin, Germany.
16. Wu PH, Wu ML, Huang TY, Chung HW (2007) Multiple frequencies BOSS fMRI, in Joint Annual Scientific Meeting of the International Society of Magnetic Resonance in Medicine / European Society for Magnetic Resonance in Medicine
9
and Biology, #1949, Berlin, Germany.
17. Wu ML, Wu PH, Huang TY, Shih YY, Chou MC, Liu HS, Chung HW, Chen CY (2007) SSFP fMRI at 0.37 mm3 voxel volume: effects of spatial resolution on SNR and functional sensitivity, in Joint Annual Scientific Meeting of the International Society of Magnetic Resonance in Medicine / European Society for Magnetic Resonance in Medicine and Biology, #1950, Berlin, Germany.
18. Lin JM, Tsai SY, Cheng CM, Yeh TC, Liu HS, Mulkern RV, Chung HW, Chen NK (2007) High-quality non-water suppressed MR spectra with correction for motion induced signal reduction, in Joint Annual Scientific Meeting of the International Society of Magnetic Resonance in Medicine / European Society for Magnetic Resonance in Medicine and Biology, #2116, Berlin, Germany.
19. Juan CJ, Liu YJ, Chou MC, Wang CY, Liu HS, Lai TC, Tsai TT, Huang TY, Chung HW, Chen CY (2007) Application of geometrical diffusion tensor imaging on acute ischemic cerebral infarction, in Joint Annual Scientific Meeting of the International Society of Magnetic Resonance in Medicine / European Society for Magnetic Resonance in Medicine and Biology, #2273, Berlin, Germany.
20. Lai TC, Liu YJ, Juan CJ, Chan WP, Chung HW (2007) Vertebral perfusion in disc degeneration patients using dynamic contrast-enhancement MR imaging, in Joint Annual Scientific Meeting of the International Society of Magnetic Resonance in Medicine / European Society for Magnetic Resonance in Medicine and Biology, #2687, Berlin, Germany.
21. Hsu JS, Lin YR, Liu YJ, Huang TY, Chung HW (2007) Reconstruction of Dynamic Contrast-Enhanced MR Imaging using k-t BLAST, in Joint Annual Scientific Meeting of the International Society of Magnetic Resonance in Medicine / European Society for Magnetic Resonance in Medicine and Biology, #3040, Berlin, Germany.
VASO
FAIR BOLD
TR/TI = 4000/1000 TE1/TE2 = 5.5/49
Figure 3. Geographic demonstration of the change of CBV (VASO), CBF (FAIR) and oxygenation (BOLD) during a single box-car fMRI study. (matrix size: 128 x 128, FOV = 220 mm, SL = 5 mm, analyzed by SPM2)
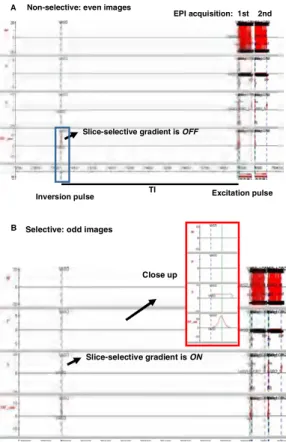
Non-selective: even images
Slice-selective gradient is OFF
Inversion pulse
EPI acquisition: 1st 2nd
TI Excitation pulse A
Slice-selective gradient is ON Selective: odd images
Close up B
Figure 2. Geographic demonstration of the change of CBV (VASO), CBF (FAIR) and oxygenation (BOLD) during a single box-car fMRI study. (matrix size: 128 x 128, FOV = 220 mm, SL = 5 mm)
Simultaneous Measurement of Cerebral Blood Volume, Cerebral Blood Flow, and Cerebral Blood Oxygenation after Hypercapnia Challenge: A Preliminary Result
C-J. Juan1,2, T-T. Tzuo2, Y-J. Liu3, T-Y. Huang4, H-S. Liu1,2, C-Y. Wang1,2, H-W. Chung1,2, and C-Y. Chen1
1Radiology, Tri-Service General Hospital, Taipei, Taiwan, 2Electrical Engineering, National Taiwan University, Taipei, Taiwan, 3Automatic Control Engineering,
Feng Chia University, Taichung, Taiwan, 4Electrical Engineering, National Taiwan University of Science and Technology, Taipei, Taiwan
Introduction:
In human experiments, a 40% to 59% increase of cerebral blood flow (CBF) and a 3% increase of BOLD signals has been documented under 5% CO2 inhalation [1,2]. Simultaneous acquisition of CBF, cerebral blood oxygenation (CBO), and cerebral blood volume (CBV) under hypercapnia challenge has not been documented before. We aim to investigate the change of CBF, CBO and CBV under hypercapnia challenge test using a hybrid pulse sequence modified from Yang’s original design [3].
Materials and Methods:
This study was performed on a 3T MR scanner (Achiva). The optimal inversion delay time (TI) for blood attenuation was measured using a multi-TI dynamic inversion recovery scan (Fi.g 1). The CBF, CVO and CBV images were acquired using a hybrid pulse sequence (Fig. 2) modified from the Yang’s sequence design [3]. With applying alternative selective and nonselective inversion gradients, dual echo EPI acquisitions provide images for generating
CBF, CBO and CBV images [3]. The fMRI study and hypercapnic challenge were done using methods as described by Juan CJ, et al. in 2006 [4]. For hypercapnia challenge, 5% of CO2 was inhaled by the healthy subject. Segmentation of gray matter using Fuzzy C-means method was done for analysis of signal change of gray matter after hypercapnic perturbation.
Results:
Figure 3 showed the CBF, CBO and CBV maps on one visual stimulating fMRI study. BOLD image was most sensitive, followed by FAIR and VASO images in a decreasing order. On challenge test, a 20% (FAIR), .4% (BOLD) and 0.6% (VASO) change of signal intensity was noted between steady state hypercapnic and resting statuses.
Discussion:
Our study provides a simultaneous measurement of three physiologic parameters under hypercapnic challenge, which is free from inter-experiment variation. Our results are consistent with prior researcher regarding the CBF and BOLD signal changes [1,2]. Unlike the apparent increase of CBF and BOLD signals, the CBV remains relatively unchanged after CO2 perturbation. Due to the limitation of case number, further investigations with adequate subjects are necessary to clarify the behavior of CBV under hypercapnic challenge.
References:
1. Kety S S, CF. J Clin Invest 1948;27:484-492. 2. Novack P, etj al. J Clin Invest 1953;32:696-702 3. Yang y, et al. Magn Reson Med. 2004;52:1407-17 4. Juan CJ, et al. ISMRM 2006:541.
0 5 1 0 1 5 2 0 2 5 3 0 3 5 4 0 4 5 2 0 3 2 0 4 2 0 5 2 0 6 2 0 7 2 0 8 2 0 9 2 1 0 C 0 5 1 0 1 5 2 0 2 5 3 0 3 5 4 0 4 5 2 0 3 2 0 4 2 0 5 2 0 6 2 0 7 2 0 8 2 0 9 2 1 0 0 5 1 0 1 5 2 0 2 5 3 0 3 5 4 0 4 5 2 0 3 2 0 4 2 0 5 2 0 6 2 0 7 2 0 8 2 0 9 2 1 0 C 0 5 1 0 1 5 2 0 2 5 3 0 3 5 4 0 4 5 9 8 9 9 1 0 0 1 0 1 1 0 2 1 0 3 1 0 4 1 0 5 B 0 5 1 0 1 5 2 0 2 5 3 0 3 5 4 0 4 5 9 8 9 9 1 0 0 1 0 1 1 0 2 1 0 3 1 0 4 1 0 5 0 5 1 0 1 5 2 0 2 5 3 0 3 5 4 0 4 5 9 8 9 9 1 0 0 1 0 1 1 0 2 1 0 3 1 0 4 1 0 5 B 0 5 1 0 1 5 2 0 2 5 3 0 3 5 4 0 4 5 9 1 0 1 1 1 2 1 3 1 4 1 5 A 0 5 1 0 1 5 2 0 2 5 3 0 3 5 4 0 4 5 9 1 0 1 1 1 2 1 3 1 4 1 5 0 5 1 0 1 5 2 0 2 5 3 0 3 5 4 0 4 5 9 1 0 1 1 1 2 1 3 1 4 1 5 A
Figure 4. Signal intensity-time curves on CBF (A), CBO (B) and CBV (C) after hypercapnia challenge (5% CO2 inhaltion).
200 300 400 500
600 700 800 900
1000 1500 2000 5000
Figure 1. Multi-TI dynamic scans (TR/TE = 8000/5.5 ms) with invariant receiver gain.
Dynamic Cardiac Imaging Using Phase-Modulated Undersampled x-f Spectra from Multiple Cardiac Cycles
J-S. Hsu1, J-M. Lin1, T. Y. Huang2, Y-J. Liu3, Y-R. Lin2, and H-W. Chung1
1National Taiwan University, Taipei, Taiwan, 2National Taiwan University of Science and Technology, Taiwan, 3Feng-Chia University, Taiwan
Introduction: Dynamic images of moving objects often exhibit significant correlation in their k-spaces and time, which enables improved temporal resolution through faster sampling of the dynamic object by acquiring undersampled images. Developed methods such as UNFOLD[1] reconstruct these images through filtering of their x-f spectrum, while methods such as k-t BLAST[2] de-alias the x-f spectrum by applying prior knowledge as an estimation of the un-aliased spectrum. This work is to provide an alternative approach of imaging and reconstruction by performing a spectral analysis toward the x-f spectra of different cardiac cycles.
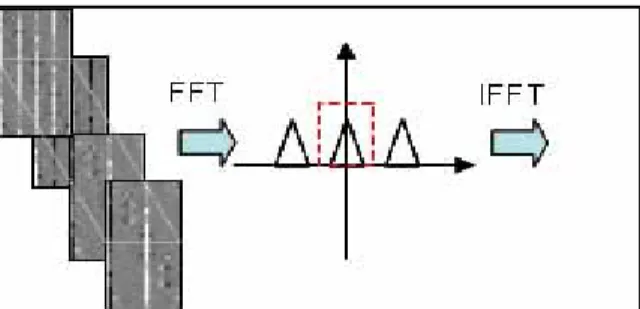
Theory: Figure 1 demonstrates the k-t space sampling patterns and their corresponding x-f spectra with a 4-fold acceleration, which consist of
the un-aliased original spectrum and its replica. Every cycle is acquired by a shifted sampling pattern relative to its previous cycle, resulting in a linear phase shift being applied to the replica of the un-aliased spectrum. By applying a Fourier Transform to the series of x-f spectrum, each replica can be seen to oscillate at a different frequency. Therefore, it is possible to separate the results which correspond to the un-aliased original x-f spectra by post-processing (See Fig 2).
Figure 1: k-t sampling pattern and corresponding x-f spectrum Figure 2: x-f spectra from different cycle. Fourier transform enables the separation
of different cardiac cycles (a) cycle 1, and (b)(c)(d) shifted versions of of original spectrum from different replica. The filtered resulted is then inverse fig 1-a. Note the difference among the “banding” of their x-f spectra transformed to gain the un-aliased x-f spectra.
due to phase modulation induced by shifted sampling
Method: Four healthy volunteers (aged 23-27 years) given informed consent were scanned. In order to test the new reconstruction approach, full
sampled datasets were acquired through a protocol of breathhold, gated 2D TrueFISP short-axis cine sequence., with 30 cardiac phases, a 35 degree flip angle, a matrix size of 256 x 192, and a slice thickness of 10mm. Subsets of these fully sampled datasets were then used in the reconstruction to simulate reduced acquisition. Several datasets with displacement (about 5%) were deliberately created to test the effect of spatial misregistration on reconstruction. All measurements were performed on a Philips Achieva 3T whole-body scanner.
Results: Figure 3 depicts the reconstruction error of the proposed method simulating 8-fold undersampling. A simulated reconstruction using k-t
BLAST was generated with the same set of data to serve as a comparison, while training data required for k-t BLAST were also produced from subsets of the previous fully sampled datasets. Reconstruction error was calculated by:
Whereri,tand oi,tdenote the i’th pixel value at time frame t of the reconstructed and original images, respectively. The reported error is the mean of all examinees. A comparison of the results shows that k-t BLAST (fig 3(a)) results in less error during diastole with a lower overall RMS error, while the proposed method (fig 3(b)) depicts higher overall RMS error yet less error in systolic phases with substantially lower variances in RMS error. Figure 4 depicts the selected reconstructed images and error of the mis-registered datasets. The increase of RMS error k-t BLAST reconstruction with displacement (fig 4(a)) is consistent
with previous reports [3], while error of proposed method (fig 4(b)) also increased, yet the variance of error within cardiac cycle remains relatively lower.
0 50 100 150 200 250 0 0.05 0.1 0.15 0.2 Time frame Re la tiv e RM S e rr or 0 20 40 60 80 100 120 0 0.05 0.1 0.15 0.2 0.25 0.3 0.35 0.4 Re la tiv e RM S e rr or Time frame 0 20 40 60 80 100 120 0 0.05 0.1 0.15 0.2 0.25 0.3 0.35 0.4
Figure 3: RMS error of (a) k-t BLAST (b) proposed method Figure 4: RMS error in the presence of mis-registration (a) k-t BLAST (b) proposed method
Discussion: The proposed method demonstrated a reconstruction with overall low variances in error and slight improvement in systolic phases.
Nevertheless, its sensitivity to mis-registration is relevant to the proposed approach of spectral analysis among the cycles, where error from the mis-registered cardiac cycles seems to spread over all cycles involved in the inverse Fourier Transform. As a consequence, increment of cycle number enhances SNR and accuracy at the cost of somewhat longer scan time and increased risk of mis-registration from involuntary motion.
Reference:
1. Madore B, Glover GH, Pelc NJ. Magn Reson Med 1999;42:813–828.
2. Tsao J, Kozerke S, Boesiger P, and Pruessmann KP, Magnetic Resonance in Medicine 53:1372–1382 (2005)
3. Hansen MS, Kozerke S, Pruessmann KP , Boesiger P, Pedersen EM, and Tsao J, Magnetic Resonance in Medicine 52:1175–1183 (2004)
∑ ∑ = = − = N i t i N i t i t i t RMS o o r E 1 2 , 1 2 , , , | | | |
Assessment of Longitudinal Blood-Brain Barrier (BBB) Changes Using MR Tracer Kinetics in Human Brain Infarction
H-S. Liu1,2, H-W. Chung1,2, M-C. Chou1,2, C-Y. Wang1,2, C-J. Juan1,2, D-B. Guo1,2, N-Y. Cho1, and C-Y. Chen1,3
1Radiology, Tri-Service General Hospital, Taipei, Taiwan, Taiwan, 2Electrical Engineering, National Taiwan University, Taipei, Taiwan, Taiwan, 3School of
Medicine, National Defense Medical Center, Taipei, Taiwan, Taiwan
Introduction
The tracer kinetic models of MR perfusion-weighted images have been widely used in the measurement of the angiogenetic activity in patients with brain tumors, while using the same model in evaluating the pathophysiologic process of ischemic stroke are relatively rare. Since the pathologic evolution of infarct regions may have a close link with blood-brain barrier (BBB) defects [1], we aim to apply the experimental data in this study to investigate whether the infarct growth can be evaluated by the known pharmacokinetic models focusing on contrast leakage profile across the disruptive BBB. It is conceivable to assume that the changes in circulation phase on perfusion-weighted acquisitions may be directly reflected on the status of the endothelial permeability calculations, hence predicting the areas of ischemic brain injury at the earlier stage possible.
Materials and methods
A longitudinal study in 19 patients with ischemic strokes undergoing at least three times MR follow-up imaging was recruited in this study. All MR conventional and T2* perfusion-weighted MR images (TR/TE=1000/44ms, matrix=128×128, flip angle=90o at 1-second interval with 60-75 dynamic time points) were
performed on a 1.5T scanner (Magnetom Vision+; Siemens, Erlangen, Germany). Five of the 19 patients had their MR examinations performed at the acute stage (within 6-48 hours); twelve at the early subacute (within 3-4 days); fourteen at the late subacute (within 7-9days); thirteen at the early chronic (within 10-15 days); and nine at the late chronic stage within 30-31 days after onset of symptoms, were analyzed for vascular permeability maps using the first-pass pharmacokinetic (FPPM) model proposed by Glyn Johnson et., al. [2]. The method used the estimate of vascular contrast medium concentration acquired from normal white matter to allow simultaneous mapping of endothelial permeability (Ktrans) and the fractional plasma volume (v
p) of brain tissues. A region of interest was placed in the area
of ischemic lesion with significantly elevated values in Ktrans maps, with contralateral area of normal white matter drawn as the referenced standard to ensure that
our calculated values are in reasonable agreement with the literatures. The corresponding calculations of vp in the same locations were also measured.
Results
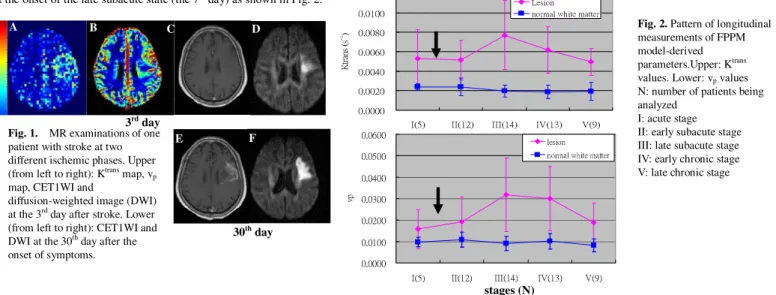
Fig. 1. shows the MR examinations of early onset and late chronic stages together with the calculated Ktrans and the v
p maps for one patient. vp values of normal
white matter extracted from FPPM model have an approximate value of 0.01 which is consistent with the literature in the previous studies. The Ktrans map shows
better contrast between ischemic lesion and normal brain tissues as compared to that of vp map and contrast-enhanced T1-weighted images (CET1WIs). It clearly
delineates the abnormal area, while the CET1WIs show no significant enhancement at early ischemic stage (Fig. 1A vs. 1C). Both peak values of Ktrans and v p occur
at the onset of the late subacute state (the 7th day) as shown in Fig. 2.
.
Discussion and conclusions
Instead of developing a differential diagnostic tool with a sensitivity superior to the conventional diffusion-weighted MR imaging in detecting acute ischemic stoke, the present study was designed to visualize longitudinal infarct changes by assessing the imaging findings using the tracer kinetics. We applied the patients’ data in our institute to confirm that the FPPM model could be an effective means in detectingbrain damage in patients with ischemic stroke at the onset of first few days. These data suggest that only at the late ischemic phase can a leakage of contrast medium lead to a parenchymal enhancement such that BBB disruption is severe enough to be monitored in contrast-enhanced T1-weighted images, while the abnormal permeability performance can already be clearly found with a higher sensitivity to the hemodynamic changes of lesion areas at the acute stage for these patients. The progression of ischemic infarction appears to evolve following a similar tendency between the vascular plasma and the permeability calculations with the exception that the opposite sign of slope from the acute stage to the subacute one (arrows in Fig.2). With an increasing pattern from acute to late subacute stage, both Ktrans and v
p progressively return to a less enhanced contrast at
late chronic stage (Fig. 2). It maybe postulated that the reduction of blood flow perfusion at this stage gives rise to a pseudo-repaired BBB phenomenon in brain infarction. The correlation between measurements of Ktrans and v
p can be predicted because Ktrans is directly affected not only by endothelial permeability surface
area product, but also by blood flow perfusion efficiency. Hemorrhage or large area of cortical necrosis was not included in the ROI calculations because the poorly perfusion-related signal loss would invalidate the computation of hemodynamic analysis.
References [1] I-J Huang, et. al., Radiology, 2001. 221: p. 35-42 [2] G. Johnson., et al., MRM, 2004. 51(5): p. 961-8.
3rd day 0.0000 0.0020 0.0040 0.0060 0.0080 0.0100 0.0120
I(5) II(12) III(14) IV(13) V(9)
stage K tra ns (s -1) Lesion normal white matter
0.0000 0.0100 0.0200 0.0300 0.0400 0.0500 0.0600
I(5) II(12) III(14) IV(13) V(9)
vp
lesion normal white matter
Fig. 2. Pattern of longitudinal
measurements of FPPM model-derived parameters.Upper: Ktrans
values. Lower: vp values
N: number of patients being analyzed
I: acute stage II: early subacute stage III: late subacute stage IV: early chronic stage V: late chronic stage
Fig. 1. MR examinations of one
patient with stroke at two different ischemic phases. Upper (from left to right): Ktrans map, v
p
map, CET1WI and
diffusion-weighted image (DWI) at the 3rd day after stroke. Lower
(from left to right): CET1WI and DWI at the 30th day after the
onset of symptoms.
stages (N)
A B C D
30th day
E F
Mapping T2 Relaxation Time of Cerebral Metabolites using Proton-Echo Planar Spectroscopic Imaging (PEPSI)
S-Y. Tsai1, S. Posse2,3, Y-R. Lin4, C-W. Ko5, R. Otazo3, H-W. Chung1, and F-H. Lin6,7
1Department of Electrical Engineering, National Taiwan University, Taipei, Taiwan, 2Department of Psychiatry, University of New Mexico School of Medicine,
Albuquerque, NM, United States, 3Department of Electrical & Computer Engineering, University of New Mexico, Albuquerque, NM, United States, 4Department of
Electronic Engineering, National Taiwan University of Science and Technology, Taipei, Taiwan, 5Department of Computer Science Engineering, National Sun Yat-Sen
University, Kaohsiung, Taiwan, 6MGH-HMS-MIT Athinoula A. Martinos Center for Biomedical Imaging, Charlestown, MA, United States, 7Department of Radiology,
Massachusetts General Hospital, Boston, MA, United States
Introduction
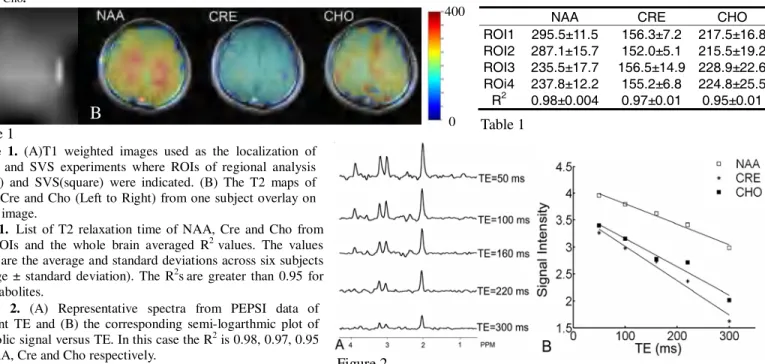
Estimation of metabolite T2 relaxation time is critical in accurate absolute concentration quantification [1,2]. Using fast MR spectroscopic imaging (MRSI) technique, we can obtain the spatial distributions of metabolites T2s. Proton-Echo-Planar-Spectroscopy-Imaging (PEPSI) uses echo-planar read-out to reduce the 3D spatial-spectral data acquisition time by an order of magnitude [3]. Here we demonstrate the feasibility of using PEPSI sequence to map T2 relaxation times of three cerebral metabolites, N-acetyl aspartate (NAA), creatine (Cre), and choline (Cho), at 3T in less than 30 minutes. Metabolite T2 relaxation times measured using the PEPSI method were consistent with those obtained using conventional PRESS single voxel spectroscopy (SVS).
Methods
Six normal subjects (mean age ± standard deviation, 30 ± 10 years) were enrolled in this study. All experiments were performed on a 3 Tesla MR system (Trio, SIEMENS Medical Solutions, Erlangen, Germany) equipped with a 8-channel head coil array. 2D PEPSI data were acquired from a para-axial slice at the upper edge of the ventricles with voxel size of 0.95 ml (matrix size = 32x32, FOV = 220mm, slice thickness= 20mm). Five PEPSI data sets were collected at TE of 50, 100, 160, 220, 300 ms, using TR of 1200 ms and 8 averages. Complete 8-slice outer volume suppression was applied along the perimeter of the brain to reduce lipid signal contamination. Even- and odd-echo PEPSI data were reconstructed separately using a non-water suppressed reference scan for automatic phasing and frequency shift correction [3]. SVS experiments were performed after the PEPSI scans using the PRESS sequence with 64 repetitions. A white matter voxel and a grey matter voxel located in the same slice as the PEPSI experiment (Figure1A: squares) were selected. The voxel size was 8 ml (2x2x2 cm3) using the same TE and TR in the PEPSI
experiments.
Metabolite signal was quantified by integrating individual spectral peak after polynomial baseline correction. The T2 values were calculated from the slope of semi-logarthmic plot of the metabolite signal versus TE using a least square linear regression. The Pearson's correlation coefficient (R2) was used to evaluate the
goodness of the T2 fit. Regional difference of metabolites T2 between white matter and the gray matter were compared at four ROIs: white matter in the left hemisphere (ROI1), white matter in the right hemisphere (ROI2), gray matter in the frontal lobe (ROI3) and gray matter in the parietal lobe (ROI3) (Figure 1). We compared the T2 values estimated from the PEPSI data and SVS data.
Results
Consistent metabolite T2 values were obtained in the six subjects (Table 1). Significant gray and white matter T2 differences were found for NAA (p<0.01) but not for Cre and Cho (Table 1). Figure 1B shows metabolic T2 maps. Figure 2 shows representative spectra with well-resolved NAA, Cre, and Cho metabolic peaks and minimal baseline distortion after the baseline correction. The averaged difference in T2 values between PEPSI and SVS over six subjects was 4%, 5% and 9% for NAA, Cre and Cho.
.
Discussion
Our results demonstrate that the proposed high-speed MRSI protocol can quantitatively map T2 relaxations times of three cerebral metabolites within 30 minutes in human brain. Three-dimensional mapping of T2 relaxation times in 8 slices would in principle be feasible within the same acquisition time. Faster data acquisition is possible using fewer signal averages, but at the expense of reduced SNR. The measured gray and white matter differences in NAA T2 are consistent with previous reports using SVS [1,2]. In conclusion, we have successfully developed a method based on PEPSI to rapidly obtain metabolites T2 relaxation time maps to improve absolute quantification of brain metabolite maps. Parametric maps of metabolite relaxation times may also be useful as an adjunct to high resolution T2-weighted images to identify brain pathology in patients with neurodegenerative disease and stroke.
Acknowledgements
This work is partly supported by the 3T MRI lab in NTUH. This work was supported by National Institutes of Health Grants R01 HD040712, R01 NS037462, R01 EB000790-04, P41 RR14075, R01 DA14178-01 and the Mental Illness and Neuroscience Discovery Institute (MIND).
References
1. Mlynarik, V., et al., NMR Biomed, 2001. 14: p. 325-331. 2. Traber, F., et al., J. Magn Reson Imaging, 2004. 19: p. 537-545. 3. Posse, S., et al., Magn Reson Med, 1995. 33: p. 34-40.
NAA CRE CHO ROI1 295.5±11.5 156.3±7.2 217.5±16.8 ROI2 287.1±15.7 152.0±5.1 215.5±19.2 ROI3 235.5±17.7 156.5±14.9 228.9±22.6 ROi4 237.8±12.2 155.2±6.8 224.8±25.5 R2 0.98±0.004 0.97±0.01 0.95±0.01
Figure 1. (A)T1 weighted images used as the localization of
PEPSI and SVS experiments where ROIs of regional analysis (arrow) and SVS(square) were indicated. (B) The T2 maps of NAA, Cre and Cho (Left to Right) from one subject overlay on the T1 image.
Figure 2. (A) Representative spectra from PEPSI data of
different TE and (B) the corresponding semi-logarthmic plot of metabolic signal versus TE. In this case the R2 is 0.98, 0.97, 0.95
for NAA, Cre and Cho respectively.
Table 1. List of T2 relaxation time of NAA, Cre and Cho from
four ROIs and the whole brain averaged R2 values. The values
shown are the average and standard deviations across six subjects (average ± standard deviation). The R2sare greater than 0.95 for
all metabolites. A B Figure 1 Figure 2 Table 1 0 400
High resolution diffusion tensor image using segmented FOV
T-C. Chao1, Y-J. Liu2, T-Y. Huang3, F-N. Wang4, H-W. Chung1, M-T. Wu5,6, and C-Y. S. Chen7
1Department of Electrical Engineering, National Taiwan University, Taipei, Taiwan, 2Department of Automatic Control Engineering, Feng-Chia University, Taichung,
Taiwan, 3Department of Electrical Engineering, National Taiwan University of Science and Technology, Taipei, Taiwan, 4Institute of Brain Science, National Yang-Ming
University, Taipei, Taiwan, 5Department of Radiology, Kaohsiung Veterans General Hospital, Kaohsiung, Taiwan, 6School of Medicine, National Yang Ming University,
Taipei, Taiwan, 7Department of Radiology, Tri-Service General Hospital, Taipei, Taiwan
Introduction
Diffusion tensor imaging is highly sensitive to bulk motion, hence single-shot EPI is the most widely used readout module for diffusion imaging. However, the susceptibility resulting from regional magnetic field inhomogeneity distorts the EPI images due to long readout train. Shortening the acquisition window is the ultimate remedy. In this work, reduced FOV along the phase encoding direction was proposed to reduce the phase error aggregation. The zoom EPI technique was adopted in this work [1] to avoid the aliasing artifacts from signal outside the reduced FOV. Due to the small number of phase encoding, the distortions are greatly reduced even without SENSE acceleration. We further proposed a method inspired by the line-scan technique [2] to combine multiple images from single shot zoom EP-DTI to form a full FOV image.
Methods and Materials
Volunteer experiments were performed on a 3.0 T Philips Achieva system. A six-direction DTI sequence was adopted in this study. Slice thickness was 4 mm and the in-plane resolution was 1x1 mm2 with the matrix size 224x56. Echo time was 64 ms and the TR was 4000ms. The b value for DTI was 700 s/mm2. The
excitation slice and the refocus location were applied obliquely as indicated in Fig 1. The FOV was shifted to acquire the image in the adjacent location after a TR duration. Each DTI has been averaged over 4 times to improve the image quality.
The sampled scheme to acquire a full FOV image was shown in Fig 2. After the whole regions of interest were sampled, the fringe boundaries were cut out to keep off the inhomogeneous excitation with each region sewed together to form a full FOV image for each diffusion weighted images. The DTI indices were subsequently derived. A full FOV EP-DTI with SENSE factor of 4 with the same resolution was also acquired for comparison.
Results
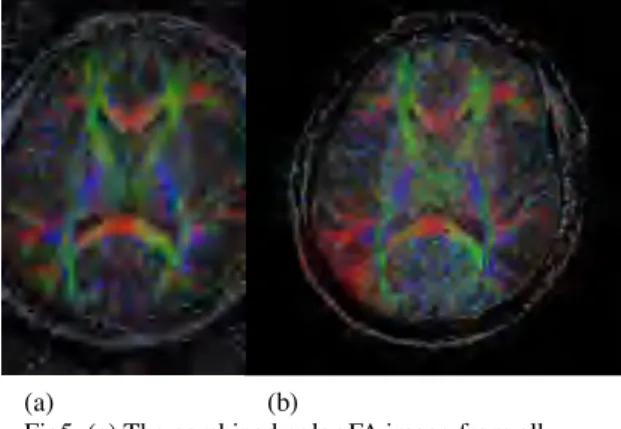
The single rFOV image using EPI acquisition without SENSE was shown in Fig.3, in which the phase encoding direction is in from R to L. A full FOV image combined from multiple partial VOI images were put in Fig 4(a). The full FOV image with SENSE is shown in Fig 4(b). The corresponding color FA map was shown in Fig.5. One particularly notices the residual unfolding artifacts in the Fig.4b (arrow) and the lowered SNR in Fig.5b.
Discussion
It was shown in Fig 4 that the distortions in b0 image were similar. However, the right frontal side in the SENSE (Fig 4b) image showed inevitable unfolding artifacts resulted from the mismatch between the sensitivity map in SENSE and the image due to distortion. From the color FA map (Fig 5), the image distortion and contrast were also similar. The color FA map in the left lower side in Fig 5(a) showed shaper boundaries. In Fig 5(b), the lower SNR in the center region than in the outer region is anticipated to be caused by the imperfect G factor in SENSE reconstruction. Therefore, our results suggest that the full-FOV image produced from the zoom technique could provide equal effectiveness as using SENSE in terms of reductions in geometric distortions. In addition, compared with SENSE at equal distortions, the proposed method is advantageous in its absence of unfolding artifacts and better SNR at similar imaging acquisition time.
Reference
1. Wheeler-Kingshott, C.A., et al., Magn Reson Med, 2006. 56(2): p. 446-51. 2. Yongbi, M.N., et al., NMR Biomed, 1997. 10(2): p. 79-86.
Fig 2. Sampling scheme to acquire full FOV. Circular region is denoted for the imaging object. Each rectangle shows the FOV for each scan with some overlap area to the other region.
Fig 3. The single rFOV image without fold-over artifact was sampled by zoom EPI technique. The outer volume was
suppressed due to no refocus by the echo pulse.
90˚ 180˚
Fig 1. The schematic illustration of slice selection pulse.
(a) (b)
Fig4. (a) The combined b0 image from all sampled partial FOV images. (b) B0 image using SENSE with acceleration factor 4.
(a) (b)
Fig5. (a) The combined color FA image from all sampled partial FOV images. (b)The color FA with SENSE reconstruction