The Role of OPEC in the World Oil Market
3
0
0
全文
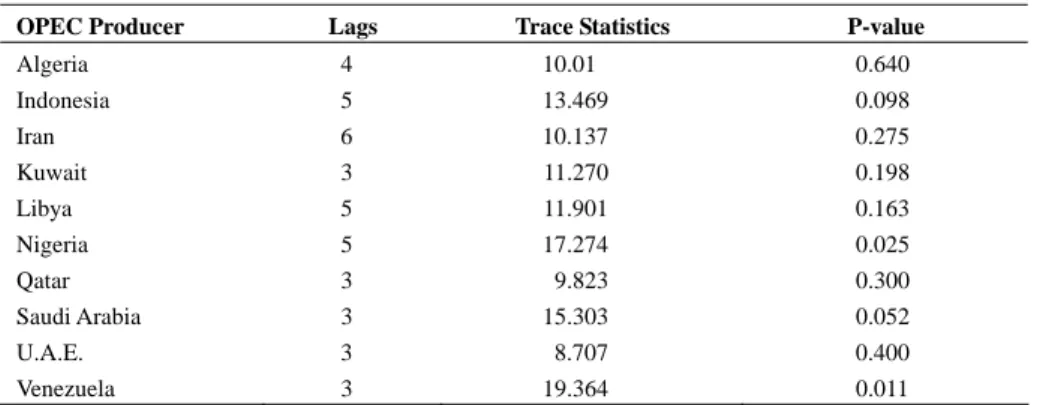
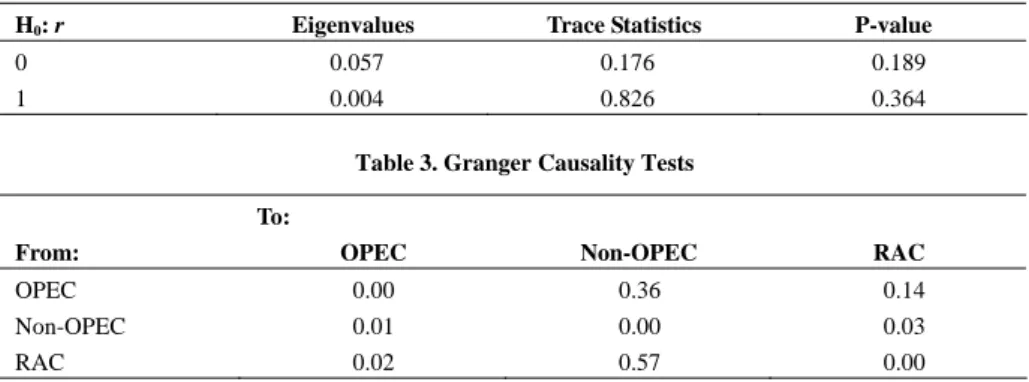
(2) 84. International Journal of Business and Economics. countries and the non-OPEC aggregate are used. The refiner acquisition cost of imported crude oil (RAC) is chosen as the representative oil price in this note. All the data series are obtained from the Energy Information Administration and are log-transformed. The period considered is from January 1992 to August 2007. Before performing the cointegration test, the augmented Dickey-Fuller test is employed to test for the existence of a unit root in each series. It is found that all series are integrated to the first order (the unit root results can be obtained from the author upon request). Table 1 reports the results of the pairwise cointegration tests on production levels between each OPEC member country and the rest of OPEC. Lags are included until the error terms are serially uncorrelated with no ARCH effects. The majority of the OPEC members do not move together with the rest of OPEC in their production levels. At the 5% significance level, only Nigeria and Venezuela production are cointegrated with that of the rest of OPEC. It appears that OPEC is not successful in coordinating the production levels of its own members. Table 1. Pairwise Cointegration Tests OPEC Producer. Lags. Trace Statistics. P-value. Algeria. 4. 10.01. 0.640. Indonesia. 5. 13.469. 0.098. Iran. 6. 10.137. 0.275. Kuwait. 3. 11.270. 0.198. Libya. 5. 11.901. 0.163. Nigeria. 5. 17.274. 0.025. Qatar. 3. 9.823. 0.300. Saudi Arabia. 3. 15.303. 0.052. U.A.E.. 3. 8.707. 0.400. Venezuela. 3. 19.364. 0.011. Smith (2005) criticizes the reliance on the cointegration approach to test for the dominant firm hypothesis. He argues that parallel movement is consistent with both the dominant firm and competitive hypotheses since the output levels of perfectly competitive firms would likewise be moving together in response to demand shocks and systematic cost fluctuations that impact the entire industry. This problem can be overcome to some extent by examining the relationship between OPEC and non-OPEC production. If OPEC were a part of the competitive world, we would expect its production level to be cointegrated with that of the non-OPEC producers. As shown in Table 2, cointegration cannot be found even at 10% significance, suggesting that OPEC production does not share any common stochastic trend with non-OPEC production. Therefore, it can be concluded that the OPEC producers were acting differently from non-OPEC competitive producers and that OPEC is not an integral part of the competitive world. Now we turn to the hypothesis that OPEC production determines the world oil price while the competitive fringe produces according to that price. The results are reported in Table 3. In general, we conclude there is Granger causality when a.
(3) Raymond Li. 85. variable helps predict the movement of another variable without feedback. OPEC production does not Granger-cause non-OPEC production or the oil price even at 10% significance. On the other hand, rather surprisingly, both non-OPEC production and the oil price Granger-cause OPEC production and non-OPEC production Granger-causes the oil price. In summary, the flow of causation runs from non-OPEC production to the world oil price and then to OPEC production; this is a complete reversal of what one would expect if OPEC is influential in the world oil market. The empirical results in this paper indicate that it is not appropriate to treat OPEC as a dominant firm. Table 2. Pairwise Cointegration Tests between OPEC and Non-OPEC Producers H0: r. Eigenvalues. Trace Statistics. P-value. 0. 0.057. 0.176. 0.189. 1. 0.004. 0.826. 0.364. Table 3. Granger Causality Tests To: From:. OPEC. Non-OPEC. RAC. OPEC. 0.00. 0.36. 0.14. Non-OPEC. 0.01. 0.00. RAC 0.02 0.57 Notes: The null hypothesis is that there is no Granger causality. P-values are shown.. 0.03 0.00. References Alhajji, A. F. and D. Huettner, (2000), “OPEC and World Crude Oil Markets from 1973 to 1994: Cartel, Oligopoly, or Competitive?” The Energy Journal, 21(3), 31-60. De Santis, R. A., (2003), “Crude Oil Price Fluctuations and Saudi Arabia’s Behaviour,” Energy Economics, 25(2), 155-173. Gülen, S. G., (1996), “Is OPEC a Cartel? Evidence from Cointegration and Causality Tests,” The Energy Journal, 17(2), 43-57. Johansen, S. and K. Juselius, (1990), “Maximum Likelihood Estimation and Inference on Cointegration—with Applications to the Demand for Money,” Oxford Bulletin of Economics and Statistics, 52(2), 169-210. Rauscher, M. and F. R. G. Konstanz, (1988), “OPEC Behaviour and the Price of Petroleum,” Journal of Economics, 48(2), 59-78. Smith, J. L., (2005), “Inscrutable OPEC? Behavioral Tests of the Cartel Hypothesis,” The Energy Journal, 26(1), 51-82. Spilimbergo, A., (2001), “Testing the Hypothesis of Collusive Behavior among OPEC Members,” Energy Economics, 23, 339-353. Wirl, F., (1991), “Economics of (Oil) Price Politics: Penalizing Price Changes,” Journal of Policy Modeling, 13(4), 515-527..
(4)
數據
相關文件
Xianggang zaji (miscellaneous notes on Hong Kong) was written by an English and translated into Chinese by a local Chinese literati.. Doubts can therefore be cast as to whether
(a) In your group, discuss what impact the social issues in Learning Activity 1 (and any other socials issues you can think of) have on the world, Hong Kong and you.. Choose the
(1) principle of legality - everything must be done according to law (2) separation of powers - disputes as to legality of law (made by legislature) and government acts (by
In the context of the Hong Kong school curriculum, STEM education is promoted through the Science, Technology and Mathematics Education Key Learning Areas (KLAs) in primary
Hong Kong: The University of Hong Kong, Curriculum Development Institute of Education Department. Literacy for the
Hong Kong: The University of Hong Kong, Curriculum Development Institute of Education Department. Literacy for the
Cheng, ed., China: Modernization in the 1980s (Hong Kong: The Chinese University of Hong Kong, 1989), p.161..
Co-developed by the Hong Kong Palace Museum and the Education Bureau, this teaching resource offers exciting learning content from the Museum's opening exhibitions that bring to
