A comprehensive evaluation of NIPAM polymer gel dosimeters on three orthogonal planes and temporal stability analysis
Kai-Yuan Cheng1,*,, Ling-Ling Hsieh1,2,, Cheng-Ting Shih3
1 Department of Medical Imaging and Radiological Sciences, Central Taiwan University of Science and Technology, Takun, Taichung 406, Taiwan.
2 Graduate Institute of Pharmaceutical Science and Technology, Central Taiwan University of Science and Technology, Takun, Taichung 406, Taiwan.
3 3D Printing Medical Research Center, China Medical University Hospital, China Medical University, Taichung 40402, Taiwan
*Corresponding author.
These authors contributed equally to this work.
Kai-Yuan Cheng, Ph.D.
Department of Medical Imaging and Radiological Sciences,
Central Taiwan University of Science and Technology
Taichung, Taiwan
Tel: +886-4-22391647 ext. 7115
Fax: +886-4-22396762
Email: [email protected]
Polymer gel dosimeters have been proven useful for dose evaluation in radiotherapy treatments.
Previous studies have demonstrated that using a polymer gel dosimeter requires a 24 h reaction time to
stabilize and further evaluate the measured dose distribution in two-dimensional dosimetry. In this study, the
short-term stability within 24 h and feasibility of N-isopropylacrylamide (NIPAM) polymer gel dosimeters
for use in three-dimensional dosimetry were evaluated using magnetic resonance imaging (MRI). NIPAM
gels were used to measure the dose volume in a clinical case of intensity-modulated radiation therapy
(IMRT). For dose readouts, MR images of irradiated NIPAM gel phantoms were acquired at 2, 5, 12, and 24
h after dose delivery. The mean standard errors of dose conversion from using dose calibration curves
(DRC) were calculated. The measured dose volumes at the four time points were compared with those
calculated using a treatment planning system (TPS). The mean standard errors of the dose conversion from
using the DRCs were lower than 1 Gy. Mean pass rates of 2, 5, 12, and 24 h axial dose maps calculated
using gamma evaluation with 3% dose difference and 3 mm distance-to-agreement criteria were 83.5% ±
0.9%, 85.9% ± 0.6%, 98.7% ± 0.3%, and 98.5% ± 0.9%, respectively. Compared with the dose volume
histogram of the TPS, the absolute mean relative volume differences of the 2, 5, 12, and 24 h measured dose
volumes were lower than 1% for the irradiated region with an absorbed dose higher than 2.8 Gy. It was
concluded that a 12 h reaction time was sufficient to acquire accurate dose volume using the NIPAM gels
with MR readouts.
Introduction
Intensity-modulated radiation therapy (IMRT) has been widely applied in modern radiation therapy.
Pretreatment verifications have become a crucial part of routine patient-specific quality control in IMRT [1].
Traditional measurement tools, such as ion chambers and films, have been used to verify the dose
distribution of IMRT. However, these tools provide only point or planar dose measurements. To fully verify
a three-dimensional (3D) dose distribution, Gore et al. [2] used a ferrous sulfate gel dosimeter (Fricke gel) to
measure the dose distribution in three dimensions. However, the measured dose distribution is strongly
influenced by readily dispersed ferric ions, resulting in low signals, blurred images, and, ultimately, errors in
dose measurement. In 1958, Hoecker and Watkins reported that the critical diffusion of ferric ions in Fricke
gel can be prevented using a radiation-induced polymerized monomer [3]. In the last decade, polymer gel
dosimeters have become useful in measuring dose distribution. In contrast to traditional measurement tools,
polymer gel dosimeters can capture the entire 3D dose distribution in a single measurement without
signification diffusion. In addition, polymer gel dosimeters demonstrate the advantages of easy shaping and
are equivalent to human tissues.
The basic physical process of polymer gel dosimetry relies on water radiolysis, leading to radicals that
interact with monomers, thereby initializing the polymerization reaction. When the polymerization reaction
is completed, the chains become spatially trapped in the parts of the gel matrix affected by radiation.
Therefore, the dose distribution can be obtained by measuring the changes of growing polymer chains.
Several modalities have been used, including X-ray computed tomography [4], optical computed
relaxation rate (R2) depends on the mobility of water molecules. The polymer chains formed in the gel
matrix reduce the mobility of water molecules. MRI can therefore determine the degree of polymerization
through T2-weighted imaging. Additionally, MRI demonstrates the advantages of high spatial resolution and
no additional dose to gel.
Senden et al. [10] proposed a new polymer gel, mainly composed of gelatin, N-isopropylacrylamide
(NIPAM), Bis, and tetrakis (hydroxymethyl) phosphonium chloride (THPC), with a high radiation
sensitivity that allows the reaction of monomers and free radicals in the irradiated region. An increasing
number of reports [11-13] show that NIPAM gel dosimeters have potential for use in the verification of
radiotherapy dose distributions. Previous work [11,12] has focused on the fundamental characteristics of
NIPAM polymer gel dosimeters and the feasibility of an NIPAM/MRI system for clinical 3D dosimetry. Gel
dosimeters are generally considered stabilized and readable at 24 h postirradiation [11,13]. In subsequent
investigations, simple dose distributions and γ-index maps from gel measurements have been compared with
those from treatment planning system (TPS) calculations regarding central axial planar dose distributions
[14].
In this study, the short-term stability and feasibility of the NIPAM gel dosimeter with MR readouts were
evaluated using a clinical case of eye tumor intensity-modulated radiation therapy (IMRT). Dose maps and
dose volume measured from the NIPAM gel dosimeters at 2, 5, 12, and 24 h postirradiation were compared
to that calculated from a treatment planning system. Dose maps in axial, coronal, and sagittal views were
evaluated using the isodose maps, dose profiles and gamma evaluation. In addition, the entire dose volume
Materials and methods
NIPAM gel dosimeter preparation
The gel used in this study consisted of 5% gelatin (300 Bloom Tape A, Sigma-Aldrich), 3% NIPAM
(97%, Sigma-Aldrich), 3% BIS (Merck), 10 mM THPC (80%, Sigma-Aldrich), and 87% deionized water.
The NIPAM polymer gel was prepared according to the instructions of Senden et al. [10]. After
manufacture, the gels were poured into Pyrex tubes for calibration and into three cylindrical gel phantoms
for dose distribution measurement; the tubes were subsequently placed in cylindrical
polymethylmethacrylate phantom containers (130 mm diameter, 130 mm height, and 5 mm wall thickness)
covered with aluminum foil. The containers were then stored in a refrigerator at 4 °C to prevent
light-induced prepolymerization until complete solidification was achieved. After dose delivery and between MR
scans, the gel phantoms and calibration tubes were placed in the scanning room at 23 ± 1 °C to reduce the
influence of temperature on the polymerization reaction.
Dose delivery
Calibration tubes
The NIPAM gels were irradiated using a 6 MV linear accelerator (Clinac 21EX LINAC, Varian Medical
Systems, USA). Quality assurance of the linear accelerator was regularly performed, thereby passing the
regulations of Taiwan. The photon output error of the medical accelerator was validated daily at lower than
3%. The irradiation was performed at the following settings: beam angle, 0°; dose rate, 4 Gy/min; and field
size, 10 × 10 cm2. The dosimeters were placed in an acrylic phantom (length, 30 cm; width, 30 cm;
determine a dose response curve (DRC) for the dose conversion. The doses delivered to the tubes were 0, 1,
2, 5, 8, 10, and 12 Gy.
Cylindrical gel phantoms
For treatment planning, CT images of a cylindrical phantom were acquired to obtain the geometry by
using a simulation CT (CT Simulation, Marconi AcQSim, Philips, UK). The cylindrical phantom was filled
with gelatin to prevent unnecessary dose absorption in the gels and to mimic the gels’ photon attenuation
characteristics. The CT images were imported into the TPS, and an IMRT plan for eye tumor treatment was
generated using the Eclipse TPS v10.0 (Varian Medical Systems, Palo Alto, CA). Three cylindrical gel
phantoms filled with the NIPAM gel were irradiated using dose delivery techniques identical to those
commonly used in patient treatments. The irradiation condition settings were as follows: prescribed dose at
isocenter, 5 Gy; photon beam energy, 6 MV; dose rate, 400 cGy/min; number of fields, five; and
source-to-axis distance (SAD), 100 cm.
MRI scanning and data analysis
A clinical 1.5 Tesla MRI scanner (MAGNETOM Aera MRI Scanner, Siemens, Germany) with a head
coil was used to scan the gel phantoms. As shown in Fig. 1, the calibration tubes and gel phantoms were
inserted into a customized acrylic holder. The T2-weighted images of the tubes and phantoms were acquired
using a multiple-spin echo sequence with the following parameters: TR, 3000 ms; echo spacing, 22 ms;
number of echoes, 16; FOV, 240×240 mm2; matrix size, 512×512; and slice thickness, 5 mm.
USA). The DRC was determined using the following three procedures. First, regions of interest were drawn
in the tubes to measure the mean signal. Employing the many-points method [15], least-square fittings were
performed to determine the T2 values of each tube, using the T2 relaxation model, mean signals, and echo
times of 16 echoes. Second, R2 values were calculated by 1/T2 values. Finally, the DRC was determined by
linear fitting the R2 values and the absorbed doses of the tubes by using R2 = a × Dose + b. Similarly, the
MR images of the cylindrical gel phantom were converted to R2 maps by using the aforementioned
procedures on a pixel-by-pixel basis. Using the DRC, the R2 maps were converted into dose maps directly.
In addition, to investigate the time polymerization reaction characteristics of NIPAM gel under MRI, the
calibration tubes and three gel phantoms were scanned at four time points: 2, 5, 12, and 24 h after dose
delivery. To accurately obtain T2-weighted images at the four time points, the calibration tubes and three gel
phantoms were separately irradiated with a 40 min interval for MR imaging. On the basis of the irradiation
time, the T2-weighted images of the calibration tubes and three gel phantoms were separately acquired at the
four time points. The R2 maps were converted into dose maps by using the DRCs obtained from the same
time points.
Evaluation
Uncertainty of dose conversion
To evaluate the errors from dose conversion, the uncertainty of the dose converted from the measured
R2 maps by using the DRCs was calculated. Dose–response relationship, or calibration curve, is a widely
recognized quantitative tool in science and technology. Typically, a single response measurement y is related
i i
i x
y , (1)
where yi is the ith observation of the response to dose xi; β is the intercept; α is the slope; and εi is an
unobservable error term with zero mean and constant variance σ2, i.e., {ε
i :1≦i≦n} is independent and
identically normally distributed as N(0, σ2). In our study, response y is the relaxation rate R2 and the
predictor x is dose D. We seek to fit the n data points (Di, R2i) into the linear model given as follows:
b D a
R2 , (2)
where R2 be the prediction of R2, a is the least squares estimator of the slop, and b is the least squares
estimator of the intercept. The standard error of R2 is the appropriate quantity to use for error bars on R2
values obtained from the best fit in the least squares. The standard error of R2 at D = Dp can be computed
using the following formula [16]:
n i i p D R D D D D n s R SE 1 2 2 , 2 1 ) 2 ( , (3)where sR2,D is the standard deviation of R2(D) and is defined by
n i i i D R R R n s 1 2 , 2 2 2 2 1 . (4)The inverse of this problem is a point of interest. In reverse regression, we regard D as the response and R2
as the predictor. In our study, the values (R2i, Di) comprise a set of n data pairs in which we wish to fit the
reverse regression model. We express our estimated model [17] with
R2 R2
D , (5)
n i i n i i i R R D D R R 1 2 1 2 2 2 2
. (6)This method disregards the simple linear regression assumption that the predictor is measured with a
negligible error (Parker et al., 2010). For a future observed value of R20, the standard error of D0 using
reverse regression is as follows:
n i i R D R R R R n s D SE 1 2 2 0 2 , 0 2 2 2 2 1 1 ) ( , (7)where sD,R2 is the standard deviation of D(R2) and is defined by
n i i i R D D D n s 1 2 2 , 2 1 . (8)In our study, the standard errors of the parameters a and b (Δa and Δb), and the mean standard errors of the
dose conversion from using the DRCs (mean ΔD) were calculated for each measured time point.
Evaluation of measured dose distribution
In this study, the gamma evaluation proposed by Low et al. [18] was used to evaluate the dose maps
measured using NIPAM gel with MR readouts. The gamma evaluation comprises both dose difference and
distance-to-agreement (DTA) comparison criteria for comparing two dose maps. The gamma index
quantitatively represents the difference between dose maps and can be calculated using Eqs. (1)–(4).
rm min
r rm, c
rc , (9)
2
2
2
2
, , , m c m c , m c M M d r r r r r r d D (10) where
m, c
c, m r r r r r (11) and
r rm, c
D rm
m D rc
c , (12)where rm and rc are the spatial locations of the dose pixels in the measured and calculated dose maps,
respectively. The terms d and δ respectively denote the spatial distance and dose difference between pixels,
and ΔdM and ΔDM represent the DTA and dose difference comparison criteria, correspondingly. A pixel with
a gamma value lower than 1 indicates that the combined errors of the spatial distance and dose difference of
the pixel were lower than the predefined criteria, thus passing the evaluation. By contrast, a pixel with a
gamma index greater than 1 corresponds to the locations where the measured value does not satisfy the
criteria. Finally, the pass rate of a gamma map was calculated using the number of passed pixels divided by
the pixel number of the gamma map and multiplied by 100%. The pass rate therefore represents the
percentage of a dose map satisfying the evaluation criteria. In this study, the dose maps measured using
NIPAM gels were compared with those from the TPS by using the criteria of a 3% dose difference (ΔDM)
and 3 mm DTA (ΔdM), which are the most frequently used criteria in published comparisons of treatment
plans [19].
In addition to the gamma evaluation, DVH, which is generally used to analyze the 3D dosimetry and
and TPS. The relative volume (RV) covered by an absorbed dose was calculated from 0% to 100% of the
prescribed dose with an interval of 1%. The percent RV differences between the dose volumes from the TPS
and the measurements across a dose range from an absorbed dose starting at 0 Gy to the prescribed dose
were also calculated using the following equation:
,
% , % , % % , TPS s p m t s p RV m s p RV D D RV D D d RV D D , (13)where dRV% is the percent RV differences, RVTPS and RVm represent the relative volumes calculated from the
dose volumes of the TPS and the measurements, Ds is the starting dose of the dose range, Dp is the
prescribed dose, and t denotes the measurement time.
Results and discussion
Characteristics of gel dose response
Fig. 2 shows T2-weighted images of the irradiated NIPAM gel phantom from axial, coronal, and sagittal
perspectives. The outer lanes in the axial images are 11 inserted tubes, three of which were filled with pure
water and eight were filled with NIPAM gels for dose calibration. Two calibration tubes were unirradiated
reference tubes (0 Gy) and six were irradiated tubes with absorbed doses of 1, 2, 5, 8, 10, and 12 Gy,
separately. The contrast in the T2-weighted images can be interpreted as a dark image resulting from the
dose absorbed by the NIPAM gel. The values corresponding to short T2 represent a high absorbed dose. The
DRCs of the NIPAM gel dosimeters from 2, 5, 12, and 24 h measurements are shown in Fig. 3. The fitting
parameters and linearity of the DRC fits are listed in Table 1. The linearity of four DRCs was higher than
significant sensitivity difference among the four readout time points. The temporal instability is mainly
caused by continuous slight polymerization in normoxic polymer dosimeters after irradiation. The 12 and 24
h DRCs were highly matched for absorbed doses higher than 2 Gy.
Uncertainty of dose conversion from using dose response curves
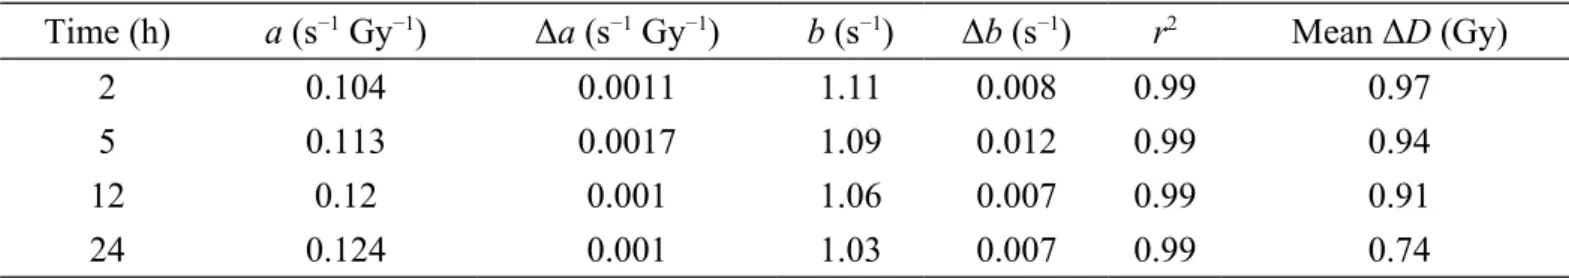
Table 2 lists the values and standard errors (Δa and Δb) of the fitting parameters a and b as well as the
linearity of DRC (r2). The mean standard errors of the dose conversion using the DRCs (mean ΔD) are also
listed. For all the measured time points, Δa and Δb are lower than 0.002 s−1 Gy−1 and 0.015 s−1, respectively,
which indicates that the DRCs fit well. In addition, the mean ΔD of all the measured time points is lower
than 1 Gy, which demonstrates that the dose conversion that uses the DRCs is accurate and reliable for all
the measured time points.
Temporal stability of dose distributions in the cylindrical gel phantom
Figure 4 illustrates the DVH and the percent RV differences between the dose volumes from the TPS
and the measurements. When the starting dose was below 2.1 Gy, the differences between the 2 h and 5 h
dose volumes were higher than 8%. When the initial dose exceeded 2.6 Gy, the differences decreased and
were lower than 5%. By contrast, the differences between the 12 h and 24 h dose volumes were lower than
5% for volumes with an absorbed dose lower than 4 Gy. When the starting dose exceeded 4 Gy, the RV was
lower than 2.1%, and the percent RV differences increased to over 5% for all the measured time points. The
absolute mean percent RV differences between the 2, 5, 12, and 24 h dose volumes and that of the TPS were
Table 2 lists the mean pass rates and standard deviations of the three orthogonal dose maps calculated
from the three gel phantoms. In the 2 h and 5 h dose maps, the pass rates were lower than 95%. The poor
performance of the 2 h and 5 h measurements was mainly attributed to a continuous polymerization reaction
surrounding the irradiated region where the absorbed dose was lower than 50% of the prescribed dose, as
observed in the DVHs of the measured dose volumes and TPS (Fig. 4). The pass rates of the dose maps
increased as time elapsed and became stable after 12 h. The pass rates of 12 and 24 h dose maps were higher
than 0.97, which is a common acceptable criterion for dose delivery in clinical practice. The gamma maps of
the 24 h dose maps with 3%/3 mm criteria are shown in Fig. 5. The gamma values of most of the dose points
were lower than 1, thus passing the evaluation. A few failed points appeared at the edges of the sagittal and
coronal dose maps. These failed points may be attributable to the image noise.
In the gamma evaluation, the mismatch between the dose maps from the NIPAM gel and TPS could also
reduce the pass rates. The pass rates of a measured dose map converted from the R2 maps shown in Fig. 2(a)
were calculated using the original simulated map and the maps before and after the original map. On the
basis of the 3%/3 mm criterion, the pass rates of the measured dose map to the previous, original, and
subsequent simulated maps were 79.14%, 83.13%, and 81.47%, respectively. The results indicate that a poor
mismatch among the dose maps strongly influences and degrades the pass rate of the dose maps. To ensure
that the spatial location of the measured and simulated maps was as close as possible, the slice location and
thickness of the MR scans were set to match the values used in the CT scans. On the basis of the
MR-acquired dose map, the closest simulated dose map was used for gamma evaluation. The differences
De Deene et al. showed that most of the polymerization reactions occurred within the first 24 h after
irradiation, with some lasting up to 30 days [20]. The stabilization of polymerization could be observed in
the slope difference per hour of the DRC with time. The slope differences per hour between the DRCs of 2 h
to 5 h, 5 h to 12 h, and 12 h to 24 h were 3×10⁻³, 1×10⁻³, and 3.3×10⁻⁴ s−1 Gy−1 h−1, respectively. After 22 h,
the slope difference was reduced tenfold, which indicated that the polymerization had stabilized. However,
the results of the DVHs showed that the NIPAM gel dosimeters with an absorbed dose higher than 2.8 Gy
could be stabilized after 2 h post-irradiation. This finding confirmed that the polymerization reaction of the
NIPAM gel dosimeters could be completed within a short post-irradiation period, as previously reported in
[21]. This result was probably attributed to the intensive radicals produced at this dose level, which rapidly
depleted most of the monomers in the NIPAM gels to form stable polymer structures for accurate dose
readouts. By contrast, the NIPAM gels with an absorbed dose lower than 2.8 Gy retained a sufficient
number of monomers to form relatively larger polymer structures than the initial ones. In addition, the
production rate of radicals under such dose level was low. Consequently, stable polymer structures could not
be formed instantly, which caused the errors in the 2 h DVH and the failure in the low-dose region during
the gamma evaluation. In this case, the continuous reactions that occur in the NIPAM gels until 12 h
post-irradiation are crucial to determine the low-dose region accurately. In this case, continuous reactions
occurred in the NIPAM gels until 12 h postirradiation are crucial for accurately determining the low-dose
region. In addition, the relationship between stabilization time and absorbed dose may be changed with
Conclusion
In this study, the short-term stability of the NIPAM gels with MR readouts was evaluated using a clinical
IMRT case. The results demonstrate that the NIPAM gel dosimeter with MR readouts could accurately
provide the entire dose volume after a 12 h reaction time. In addition, volumes with an absorbed dose higher
than 2.8 Gy can be rapidly obtained after a 2 h reaction time. It is therefore concluded that NIPAM gel
dosimeters with MR readouts could be useful and convenient in dose verification of clinical IMRT.
Acknowledgments
This research was funded by the Central Taiwan University of Science and Technology
(CTU105-P-04).
Author Contributions
Conceived and designed the experiment: KYC. Performed the experiment: KYC LLH CTS. Analyzed
the data: KYC LLH CTS. Contributed reagents/materials /analysis tool: LLH. Wrote the paper: KYC LLH.
References
1. Buonamici FB, Compagnucci A, Marrazzo L, Russo S, Bucciolini M. An intercomparison between film
dosimetry and diode matrix for IMRT quality assurance. Med. Phys. 2007;34: 1372–1379.
2. Gore JC, Kang YS, Schulz RJ. Measurement of radiation dose distributions by nuclear magnetic
resonance (NMR) imaging. Phys. Med. Biol. 1984;29: 1189–1197.
3. Hoecker FE, Watkins IW. Radiation polymerization dosimetry. Int. J. Appl. Rad.Iso. 1958;3: 31–35.
4. Hill B, Venning A, Baldock C. The dose response of normoxic polymer gel dosimeters measured using
5. Choa KH, Choc SJ, Leed S, Leee SH, Mina CK, Kima YH, Moona SK, Kima ES, Chang AR, Kwon SI.
Dose responses in a normoxic polymethacrylic acid gel dosimeter using optimal CT scanning
parameters. Nucl. Instrum. Meth. A. 2012;675: 112–117.
6. Cho YR, Park HW, Kim AR, Park CH, Bong JH, Lee JC, Kwon SI. Fabrication of a Normoxic Polymer
Gel Dosimeter and its Dose Distribution Characteristics. J. Korean Phys. Soc. 2012;59: 169–175.
7. Crescenti RA, Bamber JC, Oberai AA, Barbone PE, Richter JP, Rivas C, Bush NL, Webb S.
Quantitative Ultrasonic Elastography for Gel Dosimetry. Ultrasound Med. Biol. 2010;36: 268–275.
8. Baldock C, De Deene Y, Doran S, Ibbott G, Jirasek A, Lepage M, McAuley KB, Oldham M, Schreiner
LJ. Polymer gel dosimetry. Phys. Med. Biol. 2010;55: R1–R63.
9. Vandecasteele J, De Deene Y.On the validity of 3D polymer gel dosimetry: III. MRI-related error
sources. Phys. Med. Biol. 2013;58: 63–85.
10. Senden RJ, De Jean P, McAuley KB, Schreiner LJ. Polymer gel dosimeters with reduced toxicity: a
preliminary investigation of the NMR and optical dose response using different monomers. Phys .Med.
Biol. 2006;51: 3301– 3314.
11. Chiang CM, Hsieh BT, Shieh JI, Cheng KY, Hsieh LL. An approach in exploring the fundamental
dosimetric characteristics for a long shelf life irradiated acrylamide-based gel. J. Radioanal. Nucl. Chem.
2013;298: 1435–1445.
12. Jirasek A, Hilts M. Dose calibration optimization and error propagation in polymer gel dosimetry. Phys.
Med. Biol. 2014;59: 597–614.
13. Shih CT, Hsu JT, Han RP, Hsieh BT, Chang SJ, Wu J. A novel method of estimating dose responses for
14. Chen YL, Hsieh BT, Chiang CM, Shih CT, Cheng KY, Hsieh LL. Dose Verification of a Clinical
Intensity-Modulated Radiation Therapy Eye Case by the Magnetic Resonance Imaging of
N-Isopropylacrylamide Gel Dosimeters. Radiat. Phys. Chem. 2014;104: 188–191.
15. Yblonskiy DA, Haacke EM. An MRI Method for Measuring T2 in the Presence of Static and RF
Magnetic Field Inhomogeneities. Magn. Reson. Med. 1997;37: 872–876.
16. Montgomery DC, Runger GC. Applied statistics and probability for engineers. John Wiley & Sons;
2010.
17. Parker PA, Geoffrey VG, Wilson SR, Szarka III JL, Johnson NG. The Prediction Properties of Inverse
and Reverse Regression for the Simple Linear Calibration Problem. 2010.
18. Low DA, Dempsey JF. Evaluation of the gamma dose distribution comparison method. Med. Phys.
2003;30:2455–2464.
19. Low DA, Morele P, Chow P, Dou TH, Ju T. Does the γ dose distribution comparison technique default
to the distance to agreement test in clinical dose distributions. Med. Phys. 2013;40: 656–661.
20. De Deene Y, Pittomvils G, Visalatchi S. The influence of cooling rate on the accuracy of normoxic
polymer gel dosimeters. Phys. Med. Biol. 2007;52: 2719–2728.
21. Hsieh BT, Chang YJ, Han RP, Wu J, Hsieh LL, Chang CJ. A study on dose response of NIPAM-based
List of tables
Table 1. Standard errors of the parameters a and b (Δa and Δb), linearity of the DRC (r2), and the mean standard errors of the dose conversion from using the DRCs (mean ΔD).
Time (h) a (s−1 Gy−1) Δa (s−1 Gy−1) b (s−1) Δb (s−1) r2 Mean ΔD (Gy)
2 0.104 0.0011 1.11 0.008 0.99 0.97
5 0.113 0.0017 1.09 0.012 0.99 0.94
12 0.12 0.001 1.06 0.007 0.99 0.91
24 0.124 0.001 1.03 0.007 0.99 0.74
Table 2. Means and standard deviations of pass rates of axial, coronal, and sagittal dose maps acquired at 2, 5, 12 and 24 h after dose delivery.
Time (hr.) Pass rate (%)
Axial Coronal Sagittal
2 83.5 ± 0.9 90.6 ± 1.4 88.9 ± 0.5 5 85.9 ± 0.6 94.5 ± 0.7 93.4 ± 0.5 12 98.7 ± 0.3 97.6 ± 0.4 98.6 ± 0.9 24 98.5 ± 0.9 97.6 ± 0.6 98.9 ± 0.8
List of figures
Figure 1. (a) MRI scanner for dose readout of NIPAM polymer gel dosimeters. (b) Scanning position of the customized acrylic holder in a head coil.
Figure 2. (a) Axial, (b) sagittal, and (c) coronal T2-weighted images of the irradiated NIPAM gel phantom. The poured materials and absorbed doses of the calibration tubes are labeled in (a).
Figure 3. DRCs determined from 2, 5, 12, and 24 h T2-weighted images.
Figure 4. (a) DVH calculated from TPS and 2, 5, 12, and 24 h dose volumes. (b) Percent RV differences (dRV %) between the dose volumes from TPS and those from 2, 5, 12, and 24 h dose volumes.
Figure 5. (a) Axial, coronal, and sagittal gamma maps calculated from 24 h dose maps. (b) Failed point maps, denoted in red.