行政院國家科學委員會專題研究計畫 期中進度報告
子計畫五:消費者的網路資訊搜尋、處理與使用行為(2/3)
計畫類別: 整合型計畫 計畫編號: NSC94-2416-H-004-004- 執行期間: 94 年 08 月 01 日至 95 年 07 月 31 日 執行單位: 國立政治大學企業管理學系 計畫主持人: 別蓮蒂 共同主持人: 樓永堅,張愛華 計畫參與人員: 林育則,夏康寧 報告類型: 精簡報告 報告附件: 出席國際會議研究心得報告及發表論文 處理方式: 本計畫可公開查詢中 華 民 國 95 年 6 月 19 日
行政院國家科學委員會補助專題研究計畫期中進度報告
消費者的網路資訊搜尋、處理與使用行為
計畫類別:整合型計畫
計畫編號:NSC94-2416-H-004-004
執行期間:93 年 8 月 1 日至 96 年 7 月 31 日
計畫主持人:別蓮蒂
共同主持人:樓永堅、張愛華
計畫參與人員:林育則、夏康寧
成果報告類型(依經費核定清單規定繳交):完整報告
本成果報告包括以下應繳交之附件:
□出席國際學術會議心得報告及發表之論文各一份
處理方式:除產學合作研究計畫、提升產業技術及人才培育研究計畫、
列管計畫及下列情形者外,得立即公開查詢
□涉及專利或其他智慧財產權,□一年□二年後可公開查詢
執行單位:
國立政治大學企業管理學系
中
華
民
國
95
年
5
月
30
日
行政院國家科學委員會專題研究計畫期中報告
消費者的網路資訊搜尋、處理與使用行為
Consumers' Information Searching, Processing, and Usage Behavior on the
Internet
計畫編號︰NSC94-2416-H-004-004 執行期間︰2004 年 8 月 1 日至 2007 年 7 月 31 日 主持人︰別蓮蒂教授 國立政治大學企業管理學系 說明:本研究案已完成第一部分「消費者 網路拍賣的『贏家詛咒』心態」與第二部 分「消費者網路拍賣的『輸家詛咒』心態」 研究,已投稿國外 SSCI 級期刊送審中, 請參附件一;另外,「消費者的網路資訊搜 集行為研究」已完成資料搜集與初步分 析,結果如附件二;並已完成消費者網路 拍賣的實驗法研究的第一階段實驗,將在 今年下半年再進行後續實驗。附件一
TO WIN OR TO LOSE –IT IS A MATTER OF YOUR PROSPECT
ABSTRACT
Most people think that the winners will be happy and the losers will feel disappointed
about the outcome of an auction. However, the bidders are very likely to experience regrets,
which are called “the winner’s curse”and “the loser’s curse”, after the auction events no
matter whether they win or lose the bids. This study investigates the major contributions to
the level of winner’s and loser’s curses. Instead of employing the price difference as the
proxy of the curse in previous econometrics research, this study measures bidders’feelings of
regrets directly. In addition, the nonlinear relationship of the price difference and the level
of bidders’curses are discussed based on the Prospect Theory. The results indicate that the
determinants of the winner’s curses are the price differences between the end prices and their
estimated reasonable prices, as well as the uncertainty toward the bid. However, the number
TO WIN OR TO LOSE –IT IS A MATTER OF YOUR PROSPECT
INTRODUCTION
Online auctions have recently gained widespread popularity and are one type of the most successful electronic commerce. Buyers and sellers of various products consider eBay auction website a viable marketplace in the United States. For example, at least 30 million people bought and sold more than $20 billion in merchandise on eBay in 2003 (Hof, 2003; Lucking-Reiley, 2002). This is more than the gross domestic product (GDP) of all but 70 of the world's countries (Aldridge, 2004). Somewhere between 150,000 and 200,000
entrepreneurs earn a full-time living via selling something from new and used underwear to BMWs on eBay (Adler, 2002; Bradley and Porter, 2000; Hof, 2003). In fact, more
automobiles are now sold on eBay than are sold by Auto Nation, the leading volume car dealer in the United States (Aldridge, 2004; Bold, 2004; Hof, 2003). In Taiwan, the biggest auction website Yahoo! Taiwan reported that the revenue from its online auction business accounted for more than 90% of its total e-commerce transactions revenue (IDIC, 2005).
The proliferation of online auction users has attracted the attention of many researchers, who primarily focused on the bidder behavior, such as herding behavior (Dholakia and
Soltysinski, 2001), the influence of reserve prices (Jap 2002), the impact of expertise (Wilcox, 2000), and the effects of auction formats (Lucking-Reiley, 2000). However, contrary to the plenty research efforts of the bidder’s behavior, the exploration of the bidders’attitudes and perceptions is rather limited.
Considering the competition in an auction, it is usually assumed that the winner would be happy and satisfied with the result, and the loser should feel bad about the outcome. However, the bidders are very likely to experience regrets or disappointments after the auction events no matter whether they win or lose the bids. This phenomenon is termed as the “winner’scurse”or“loser’scurse”in economicliteratures on auction (e.g., Capen, Clapp, and Campbell, 1971; Holt and Sherman, 1994; Milgrom 1989).
Some researchers have explored the bidders’regret feelings from the economic perspective; thus measured the “curse”in monetary amounts which were the difference between the price the bidders bid and the price that bidders believed to be reasonable (Bajari and Hortacsu, 2003; Thaler, 1992). When adopting the measure of economic perspective, although it is convenient to employ the data from auction sites (e.g., e-Bay), it is susceptible that the monetary amount can truly reflect the sense of regrets. The implicit assumption behind the economical measurement is that the curse is linearly correlated with the amount of extra monetary sacrifice. From the perspective of Prospect Theory (Kahneman and Tversky, 1984), it is likely that the degree of regrets (or disutility) may not be linearly related to the amount of perceived monetary loss. In other words, the difference of paid price and expected price is just one factor that influences the sense of regrets; thus taking mere
monetary terms as the proxy of the real feelings of consumers may not be proper. Therefore, this study proposes to probe the consumers’feelings of regrets directly and to discuss the relationship of the price difference and the sense of regrets based upon the Prospect Theory.
In summary, the purposes of the present study for the on-line auction have three folds: 1) to directly measure bidders’feelings of regrets without applying the price difference as a proxy measure, 2) to explore the relationships between the degree of regrets and the price differences, and 3) to investigate the factors that are influential on the level of bidders’curses. In the following sections, we will first introduce the concepts of bidders’curses and review
Prospect Theory to derive our research hypotheses. A survey of the actual on-line bidders is employed to collect data to examine the hypotheses and to achieve implications.
LITERATURE REVIEW AND HYPOTHESES
Winner’sCurseand Loser’s Curse
The concept of “bidder’s curse”wasfirstmentioned by Capen,et al., (1971) while discussing the bidding for oil leases. It describes the bidder’s regrets or disappointments about the bidding decision whether s/he wins or loses the bid. Two kinds of curses were defined: the winner’s curse and the loser’s curse. The winner’s curse indicates the situation in which the bidder wins the auction, but they may feel regrets because they overestimate the value of the commodity (Thaler, 1992). In this situation, the winner of the auction is just like a loser and the “winner’scurse”phenomenon occurs(Capen, et al., 1971). In addition to bidding too high, the bidder may also underestimate the product’s value or bid in a conservative way then lose the bid. This unexpected failure in closing a bid is called the loser’scurse(Holtand Sherman, 1994).
Thewinner’scursecannotoccurifallthebiddersarerational(Cox and Isaac, 1984) since the rational bidder would not bid a price over the true perceived value. However, most consumers are bounded rational; thus, the bidder’s curse is a general phenomena (Thaler, 1992) for both experts and novices (Bazerman and Samuelson, 1983; 1985). Moreover, the bidder’s curse has been demonstrated that it exists not only in the laboratory but also in the real world (Cassing and Douglas, 1980; Kagel and Levin, 1986). In addition to the nature of the bounded rationality, some other factors may influence the bidder’s curse additionally, for example, the number of bidders (Capen et al., 1971) and the uncertainty (Bazerman and Samuelson, 1983). It seems that more bidders and higher uncertainty about the item quality may lower down bidders’rationality.
Most of the previous studies discussed this issue via econometric models (eg., Bajari and Hortacsu, 2003; Bazerman and Samuelson, 1983; Cassing and Douglas, 1980; Cox and Isaac, 1984; 1985; Kagel and Levin, 1986) and were fraught with problems of measurement. In these studies, the curse was measured by the price difference, which is the gap between the final bid and the estimated price. It is doubtful that the price difference can properly represent the bidder’s feeling of regrets. A proxy of price difference for the curse is not as insightful as a direct measurement of regret feeling. Furthermore, few of these studies explained the reasons of the curse with theorems.
In the present study, the extents of the winner’sandthe loser’sreal psychological states about the feeling of regrets are directly measured based on a perceptual viewpoint. The relationship of the curse and price difference is also investigated based on Prospect Theory. In the following sections, Prospect Theory is introduced to explain the phenomena of the winner’sand loser’scurse, and to induce relevant hypotheses.
Winner’sCurse,Loser’sCurse, and Reference Point
Kahneman and Tversky (1979) proposed Prospect Theory to describe an individual’s choice under uncertainty. The essential feature of Prospect Theory is that the people’s perceived value is based on the changes of welfare rather than final states. In other words, people’s perceptual apparatus is attuned to the evaluation of changes rather than to the evaluation of absolute values; and the magnitude of the change is a relative concept been compared with the base amount. For example, it is easier to discriminate the change from
$5 to $10 than the change from $955 to $960. Therefore, the concept of a reference price is introduced into the value function for discussing the effect of the price on purchase decision. Consumers compare the purchase price with their reference price to form the feeling of a gain or loss. While spending more than the reference price, consumers perceive a loss; whereas spending less than the reference price, they sense a gain. Similarly, in an online auction, the bidder’s gain or loss results primarily from the comparison between the bidder’s final price and the price his/her estimates to be reasonable, that is the bidder’s internal reference price. If the winner offers a final price higher than his/her reasonable price set originally, he/she tends to feel a loss. If the winner’s final price is lower than the reasonable price in his/her mind, he/she must feel a gain. On the other hand, if the loser bids a price which is a little lower than his/her reasonable price and doesn’t win the bid eventually, he/she may sense a loss and regret. On the contrary, if the loser bids a price which is much higher than the reasonable price but doesn’t win the bid at the end, the loser may receive a feeling of gain.
Part of the bidder’s pleasure or discouragement results from the bidder’s gain or loss, but not solely based on winning or losing the bid. If the bidder won a bid with a price higher than his/her expectation, he/she would not feel too happy about the win, but might start to wonder if he/she had irrationally over-estimated the value of the product, and then regretted. Since the winner must have offered a price higher than others, it almost likes a signal that the value of the product was perceived lower by other bidders. The very likely regret feeling is like a curse to the winner, and very hard to avoid. For the loser, if he/she played
conservative, didn’t offer what he/she really estimated the value of the product and lost the bid at the end, the regret feeling would be strong. Especially, someone else would rather put a higher bid and won, which implied that the product was worth more. Actually, the loser tends to think that he/she might underestimate the value of the product due to losing it to the winner even though he/she has offered what he/she expected at the beginning. This is a curse to the loser. The regret of not putting a higher bid, or say the curse, would be strong if the final price is so close. However, if the winner uses a price much lower than his/her expectation to win the product, he/she would be happy due to the extra gain compared with his reference price. On the other hand, if the loser has provided a price higher than what he/she expected to be but lost, he/she should not feel any sorry for losing it. The above discussion leads to the following hypotheses.
H1a: The winner’s regret level (i.e., winner’s curse) increases as the difference between the end price and the estimated reasonable price increases.
H1b: The loser’sregret level (i.e., loser’s curse) increases as the difference between the loser’s bid price and the estimated reasonable price decreases.
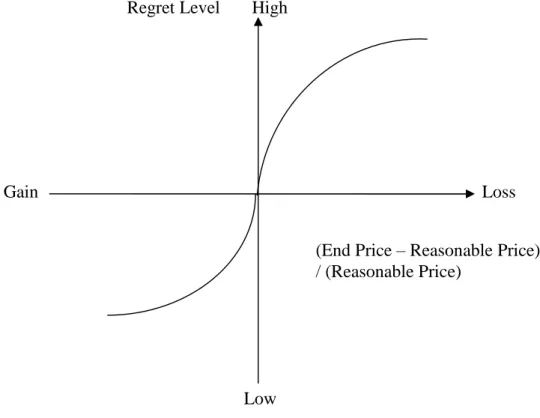
According to Prospect Theory, the value function is a concave line for gains and a convex line for losses (Kahneman and Tversky, 1979). The difference between a gain of $10 and a gain of $20 appears greater than the difference between a gain of $110 and a gain of $120. Similarly, the difference between a loss of $10 and a loss of $20 appears greater than the difference between a loss of $110 and a loss of $120. Thus, it is reasonable to believe that both the winner’s and loser’s curses should also follow the convex line for losses and the concave line for gains. Therefore, the bidder’sfeeling of loss increases convexly with the extra cost of the product, and the bidder’s feeling of gain increases concavely with the extra saves. Figure 1 and 2 illustrate our proposed shapes of the winner’s and the loser’s regrets, respectively. Be aware that the x-axis in these two figures is the price different ratio and the larger value of x-axis means unwise bid which may cause some monetary loss. Also, the y-axis in these two figures is the regret level, which is somehow the opposite of “value” perception by Kahneman and Tversky (1979). In Figure 1 for the winner, the net positive
value on x-axis represents that the end price is higher than the estimated reasonable price, which also means an unwise overbid. Then, when this value of price gap is positive, the winner loses in the monetary term. Based on Prospect Theory, the increase rate of the winner’s regret level should decreases with the magnitude of the price difference increases. Figure 1 is similar to the mirror impression of Prospect Theory in both x-axis and y-axis.
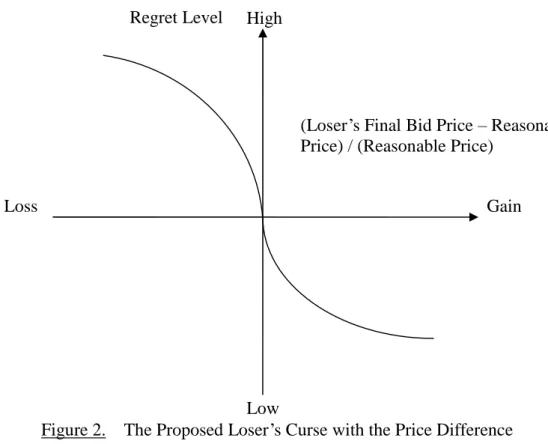
On the other hand, the loser is less likely to feel regrets if his/her final bid price is higher than the estimated reasonable price. It is then like a gain to the loser since he/she lose the bid and does not actually pay anything for the item. The money saved can be considered as a gain to the loser on the x-axis. The loser should regret more if he/she dose not offer the price higher than his/her estimate reasonable price and loses. Also, the regret level increases quickly while the loser’s final bid price is far less than his/her reasonable price increase. Therefore, Figure 2 is similar to the mirror impression of Prospect Theory in the y-axis.
H2a: The marginal value of the winner’sregret level (i.e., winner’s curse) decreases with the magnitude of the price difference between the end price and the estimated reasonable price increases.
H2b: The marginal value of the loser’s regret level (i.e., loser’scurse)decreases with the magnitude of the price difference between the loser’s bid price and the estimated reasonable price increases.
Figure 1. The Proposed Winner’s Curse with the Price Difference (End Price –Reasonable Price) / (Reasonable Price) Regret Level Low Loss Gain High
Figure 2. The Proposed Loser’s Curse with the Price Difference
Situational Factors
Many researchers have proposed some situational factors that influence the attitude and behavior of consumers in an on-line auction. Among these situational factors, degree of competition and divergence of opinion are two major factors that impact the magnitude of the winner’s curse (Varaiya, 1988). The degree of competition is closely related to the number of bidders; while the divergence of opinion may result in the feeling of uncertainty.
When the number of bidders increases, the participants of the auction perceive stronger threats of losing the bid. Therefore, they tend to raise the price during the bid, and the auction would have a higher probability of success and even with a higher end price (Hansen 1985; Vincent 1995; Wilcox 2000). Within a situation of stronger competition, the bidders are likely to overestimate the value of the item (Capen et al., 1971) since “many bidders”is like a signal of the quality of the item. Therefore, Thaler (1992) suggested that the bidder should take into consideration the presence of other bidders and the information revealed from their bidding in order to avoid the winner’s curse. However, it is difficult to keep rational because the increasing number of bidders easily leads to the perception that the competition is getting intense. It is especially true for an online auction that more bidders also imply the auction object to be highly desirable while the auctioned item is usually with ambiguous value. The intense competition can lure the bidders to be more involved and bid aggressively to win the bid (Ariely and Simonson, 2003). Therefore, the winner is likely to overbid and regrets after the closure of the bid when there are more bidders participating. Similarly, the losers may also feel that the item is great and perceive stronger regrets about not offering a higher price when there are many bidders. The above discussions lead to the following hypotheses.
H3a: The winner’s regret level increases as the number of bidders increases. H3b: The loser’s regret level increases as the number of bidders increases.
Regret Level
Gain Loss
(Loser’s Final Bid Price –Reasonable Price) / (Reasonable Price)
High
The conflict of various information sources, or called divergence of opinions, makes the bidders uncertain about the quality of item on auction. Uncertainty makes the bidder hard to estimate the proper price to offer during the auction, and then very likely results in a bipolar reaction, either heavily overestimate or strongly underestimate the value of the item. Wang and Zender (1998) showed that risk-averse investors shaded their bids more when there was a greater uncertainty in the absence of private information. On the other hand, if a bidder desires a product deeply, it is hard for the bidder to evaluate the true value of it rationally. Then, both uncertainty and unsatisfied desire turn the bidder overestimate the value of the item and sink into the winner’s curse. Under this situation, the losers also tend to regret more because after the auction is closed, they are more likely to believe the value of the item is higher than their expectations due to the uncertainty. The following hypotheses are proposed:
H4a: The winner’s regret level increases as the level of uncertainty increases. H4b: The loser’s regret level increases as the level of uncertainty increases.
METHOD
The real bidders on the Yahoo! Auction were the sampling frame of this study. Data were collected from two resources: one was to collect bidders’regret levels and attitudes directly through a survey; the other was the record of corresponding bids.
Because the purpose of this study is mainly about the auction price and the regret, the item for bid is not the focal consideration. Therefore, almost all the items were accepted in this study. The criteria of an eligible auction were that 1) the closing time was between 10:00 a.m. on February 25 and 1:00 a.m. on March 1, 2005; 2) the items were not tagged with a “Buy Now”price which sent out a strong signal of the ideal price from the seller; 3) real estates, automobiles, motorcycles, and items related to stars or idols were not included due to the possible bias from the extremely high price of the first three categories and unnecessary external influence from the idols in the last category; 4) an auction with more than one same item was excluded since it could be sold by a professional seller; and 5) a valid record must have more than one bidder.
Questionnaire Design
An electronic questionnaire was designed to collect the bidders’attitudes toward the bids right after the auctions were closed. The first section of the questionnaire was about the general attitudes toward the very bid, including satisfaction, desire for the goods, and worry about the possibility of failure. The second part was the measurement of regret level. The third section asked respondents to estimate the reasonable price and memorize how many sincere bidders participating in the auction. The last section was about the respondent’s background information, including demographic profiles and experiences with the Internet and e-auction.
Record of Bid
Other than the survey, the history and other related information of each bid were also recorded during the bid and after the bid closed. The recorded information includes the item on auction, new or used, with or without photo, reserved price or not, seller’s id, seller’s positive and negative ratings, buyers’ids, total participants, total bids, starting price, and ending price.
Process of Data Collection
All eligible auctions were identified before the set closing time. Right after the closing time of each auction, all necessary information about the auction was recorded and the email survey invitation was sent out to the winner and the loser with the second highest bid. Only the losers with the second highest bid were eligible for this study because their bidding action revealed that they were sincere about the auction. The web-survey started from 10:00 a.m. on February 25 and closed at 5:00 p.m. on March 1. During this time period, the bidders receiving the email invitation could link to the website and filled the questionnaire. Valid respondents could receive a coupon of 7-Eleven with a face value of NT$200 (NT $31 = US $1) as the compensation.
Within these five days, 1089 auctions were recorded and 2066 invitation emails were sent out. After cross checking the respondents’ids with the auction participants’ids and deleting incomplete responses, 330 valid samples were kept out of the 455 respondents. Among the 330 samples, 192 were winners and 138 were losers. Next, 8 winner outliers and 9 loser outliers whose price difference was greater than triple standard deviation were deleted. The final valid sample size was 184 for winners and 129 for losers.
Definition of Variables
The dependent variables of this study are the winner’s curse and the loser’s curse. These two variables are directly measured by the regret levels of the winner or loser. Comparing to previous researches which measured curse in monetary amounts, the current study suggests that measuring the psychological feeling can probe winner’s and loser’s curse more thoroughly.
The measurement of regrets was adapted from two previous scales for the regret of purchase experience (Creyer and Ross 1999; Inman and Zeelenberg 2002). These two scales were combined and revised to fit the bidding decisions. After deleting repeating items in these two scales, 10 items remained in the questionnaire as a set to measure respondents’regrets of bidding price and bidding decision. The final scale included the regret about the bidding price, the action, and the decision in the auction in a 7-point Likert-type scale. The Cronbach’s alpha for the reliability of this scale was 0.81.
The major independent variables were the price difference, the number of bidders, and the perceived uncertainty. For the winner, the price difference was defined as the difference between the end price of a bid and the estimated reasonable price divided by the estimated reasonable price. For the loser, the price difference is the loser’s final bid price (i.e., the second highest price) minus the estimated reasonable price then divides by the estimated reasonable price. The information of the end price, the second highest price, and the number of bidders were directly captured from the auction record on Yahoo! The estimated reasonable price was collected through the survey.
The perceived uncertainty about an auction is the bidder’s attitude to how unsure the bid is and how desire for winning the auction before the bid was closed. It was measured in two 5-point Likert-type scales from 1 as totally certain/not very desired to 5 as strongly uncertain/very desired. The desire level was treated as the weight of the uncertainty based on the rational in the hypothesis. These two measures were also collected through the survey. The controlled variables in the model were the starting price, gender, age, educational level, new or used items, and hours of using Yahoo auction per day. These were exogenous variables in the models to control the variance because they might relate with the bidder’s regret level.
RESULTS
Demographic Profiles of the Respondents and the Eligible Auctions
Among the 313 valid respondents, females are slightly more than males; 53% of the bidders are females. Fourteen percent of the respondents were under 19 years old, 54 percent of the respondents were 20-29 years old, 25 percent of the respondents were 30-39 years old, and only seven percent of the respondents were older than 40. The education levels ranged from high schools to graduate schools. Twenty-five percent of the respondents were with high school educational level. Nineteen percent of the respondents indicated attainment of a college degree; 49 percent with a bachelor degree; eight percent with a master or Ph.D. degree. The average time that the respondents spend on Yahoo auction is 2.62 hours per day.
The most popular auction items are 3C products, female clothing, and female accessories. More than half (55%) of the auction items are used. The price range of these items is wide, ranged from NT $11 to $11,000. The average number of the bidders for each auction is 6.26 (SD=3.83).
The price difference is defined as the ratio of the price gap relative to estimated reasonable price. The average ratio is -0.08 (SD=0.32) for the winner group and -0.16 (SD =0.42) for the loser group. The range of price difference ratio of the winner group is from -0.92 to 1.06; and 57.07% of the price differences are less than zero which means these winners estimate the reasonable price lower than the end price. The range of price difference ratio is from -1.00 to 2.32 for the loser group and 61.24% of the losers estimate reasonable prices lower than their bidding prices.
The winner’s range of the regret is from 1.18 to 5.96, and the average regret level is 3.32 (SD =0.86) out of 7-point scale. The loser’s average regret level is 3.58 (SD=0.91) with a minimum value of 1.36 and maximum 6.20. The losers seem experience lightly more regret feelings than the winners. However, since the neutral level is 4, most winners and losers do not feel too sorry about the auctions.
Winner’sCurse
A general linear model is applied to examine the determinants of the winner’s curse. To illustrate the nonlinear relationship between the regret level and the price difference of the end price and the reasonable price, both square and cube terms of the price difference are added in the model to reflect a cumulative effect and hypothesized S curve in Figure 1 and 2. The dependent variable is the winner’s regret level, and the independent variables are price difference, the square of price difference, the cube of price difference, the degree of uncertainty, and the number of bidders. The model is significant at the =0.01 level with F=3.03.
Hypothesis 1a states that the winner’s regret level increases as the difference between the estimated reasonable price and the end price increases. As shown in Table 1, when the end price is higher than the estimated reasonable price, the winner is more likely to feel regretful (β=1.57, F=21.11, p<0.01). In addition, hypothesis 2a indicates that the marginal valueofwinner’scursedecreases as the difference between the end price and the estimated reasonable price increases. The result shows that when the square of the price difference ratio increases, the regret level also increases (β=0.67, F=4.51, p=0.04). Furthermore, the significance of the cube of the price difference ratio (β=-1.49, F=7.39, p<0.01) and negative
coefficient indicate that the shape of the regret function is like an S, which is steep in the middle and flat at the extremes. Therefore, the larger the price gap is, the greater the regret is perceived, and with a negatively accelerative accumulation rate. Both hypothesis 1 and 2 are supported.
Hypothesis 3a asserts that the winner’s regret level increases as the number of bidders increases, which is not significant (F=0.00, p>0.05). Hypothesis 4a suggests that the winner’s regret is positively related to the level of uncertainty, which is supported (F=5.72, p=0.02). The perceived uncertainty and desirability appear to influence the level of the winner’s curse. When the uncertainty is higher, the winner is more regretful.
Table 1.
TheFactorsofthe Winner’sCurse(N=184)
Source
Hypothesized
Direction Coefficient (std err) DF F Value
Price Difference Ratio + 1.57 (0.34) 1 21.11 **
(Price Difference Ratio)2 + 0.67 (0.32) 1 4.51 *
(Price Difference Ratio)3 - -1.49 (0.55) 1 7.39 **
Uncertainty + 0.03 (0.01) 1 5.72 *
Number of bidders + 5.30 (6.74) 1 0.00
Starting price -0.00 (0.00) 1 0.87
New/used item 1 0.38
Used (versus New) 0.08 (0.13)
Gender 1 0.27
Female (versus male) 0.07 (0.13)
Age (versus 50 to 59 Years) 4 1.48
Younger than 19 years 0.20 (0.46)
20 to 29 years 0.56 (0.43)
30 to 39 years 0.49 (0.43)
40 to 49 years 0.17 (0.46)
Educational level (versus College) 4 3.02 *
University -0.16 (0.17)
Source
Hypothesized
Direction Coefficient (std err) DF F Value
Senior high school -0.03 (0.21)
Junior high school 0.79 (0.33)
Hours of using Yahoo auction 4 1.56
Model 20 3.03**
Note 1. Thepricedifferenceforthewinner’scurseistheend price of the auction minus the winner’sestimated reasonableprice.
Note 2. ** denotes the=0.01 significant level and * denotes the =0.05 significant level. Loser’sCurse
The data of losers is analyzed in the way similar to the winners’. The dependent variable is the loser’s regret level, and the independent variables are the same: the price difference, the square of price difference, the cube of price difference, the degree of uncertainty, and the number of bidders. The price difference is the gap between loser’s final bid, which is also the second highest bid, and the reasonable price estimated by the loser. The model is significant at the=0.05 level with F=1.79.
The loser’sregret level is hypothesized to increase as the difference between the loser’s final bidding price and the estimated reasonable price decreases (H1b) in a non-linear form (H2b). However, the variable of price difference ratio itself is not significant (F=0.01, p>0.01). Both square and cube terms of price difference ratio are tested to exam the shape of the regret function. The result shows that when the square of the price difference ratio increases, the regret level also increases (β=-0.73, F=4.49, p=0.04). Nevertheless, the cube of the price difference ratio is not significant (F=2.26, p>0.05). The relationship between the loser’s regret level and the price gap is non-linear, but not the S-shape as proposed in Figure 2. Taking account only the significant square term, it implies that the losers regret less when their final bidding prices exceed their estimated reasonable prices too much or when their estimated reasonable prices are extremely larger than their final bidding prices. The former situation suggests that the losers might feel compensated while they have bid much higher than their original plan. They tried and without regrets. The latter situation means that the losers might give up the auction quickly so they bid much less than their estimates at the beginning. In this case, they don’t feel strong regrets about losing the bid. The losers are regretful only when their final bid prices are just less than their estimated reasonable a little. They would wish that they should have bid higher.
Hypothesis 3b indicates that theloser’sregretlevelincreasesasthenumberofbidders increases, which is supported (F=4.46, p=0.04). Hypothesis 4b is also supported that the loser’sregretlevelincreasesasthelevelofuncertainty increases(F=14.46, p<0.01). The perceived uncertainty and desirability are related to the level of the loser’s curse. When the uncertainty is higher, the loser is more regretful for losing the bid.
Table 2.
Source
Hypothesized
Direction Coefficient (std err) DF F Value
Price Difference Ratio - -0.04 (0.35) 1 0.01
(Price Difference Ratio)2 - -0.73 (0.34) 1 4.49 *
(Price Difference Ratio)3 + 0.31 (0.21) 1 2.26
Uncertainty + 0.06 (0.01) 1 14.46 **
Number of bidders + -0.01 (0.02) 1 4.46 *
Starting price -0.01 (0.00) 1 0.35
New/used item 1 0.34
Used (versus New) -0.10 (0.18)
Gender (versus Male) 1 0.35
Female 0.10 (0.17)
Age (versus 50 to 59 Years) 4 0.29
Younger than 19 years -0.35 (0.67)
20 to 29 years -0.46 (0.64)
30 to 39 years -0.30 (0.64)
40 to 49 years -0.20 (0.77)
Educational level (versus College) 4 1.48
University -0.10 (0.22)
Master or Ph. D. -0.92 (0.39)
Senior high school -0.17 (0.28)
Junior high school -0.22 (0.52)
Hours of using Yahoo auction 4 0.38
Model 20 1.79 *
Note 1. The price difference for the loser’scurseisthesecond highest price of the auction minus the loser’sestimated reasonableprice.
Note 2. ** denotes the=0.01 significant level and * denotes the =0.05 significant level.
This study investigates the factors that influence the winner’s and loser’s curse. Instead of using the monetary loss as a proxy of the curse in previous studies, we directly measure the perceived regret level to estimate the psychological state of the winner’s and loser’s curses. The monetary loss became one of the causes of the bidder’s curse as its rational position, and then the relationship between the price gap and the feeling of curse can be properly revealed..
Conclusions and Discussions
The results suggest that the factors that impact the winner’s curse and the loser’s curse are different. For the winners, the uncertainty and the price differences between the end prices and their estimated reasonable prices are critical to the degree of the curse feeling. For the losers, however, the uncertainty and the number of the bidders are the most important factors that result in the loser’s curse, and the price gap doesn’t influence them as
significantly as it does for the winners. Therefore, the influence of price gap on winners versus losers should be discussed separately.
For the winner, the primary contributor to the winner’s curse is the price difference of the estimated reasonable price and the end price. The results show that the level of regrets is not linearly related to the price difference, which has not been dealt in economic theory on auction. This study suggests that the level of regrets increases acceleratively as the difference between the end price and the estimated reasonable price increases. It is consistent with Prospect Theory which posits that consumers respond more to the perceived changes than to the absolute monetary levels.
The insightful meaning of this finding of the winner’s curse is that the price gap or monetary loss can be as a proxy of the winner’s curse. However, it should not be simply treated as a linear term as what have been done in previous auction studies based on the economic viewpoint. According to our findings, the nonlinear relationship between the monetary loss and the regret feeling should be considered while using it as the proxy of winner’s course.
On the other hand, the price difference of the second highest price and estimated
reasonable price negatively relates to the loser’s curse with an accelerate rate. It causes the losers regret at the end while they bid conservatively and near below the reasonable price. Either the losers bid too high and exceed the reasonable price or the losers quit the bid soon and bid far below the reasonable price that makes the losers regret less at the end. It seems that not trying hard enough causes the losers regret more if the product is truly desired. Their targets of regret could be more on losing the products rather than losing hypothetical bid price since they do not actually pay. The above inference could be indirectly enhanced by another finding that the number of bidders is one of the major key factors related to the loser’s regret level. It was very likely that the number of bidders sent out the signal of the quality or adorability of the item. Many bidders might make the losers wonder if they underestimate the true value of the item, and then regret that they did not bid higher. For the winners, on the contrary, since they have won the bid and owned the item, they don’t care how many people were in the game. The primary concern or source of their regrets after winning is that they might have overpaid for the item.
Although the losers were hypothesized to feel regrets that they did not bid high enough, especially when just adding a little bit could win, the fact that the losers do not pay anything at the end. In other words, the losers may not code the price difference as a loss at the auction. Then, the hypothesized relationship between the loser’sregret level and the difference between the estimated reasonable price and the second highest price based on
Prospect Theory cannot stand.
The results of this study also indicate that both the winner’s and loser’s curse are impacted by the uncertainty of the bidders. This finding is consistent with the previous researches on the winners (e.g., Bazerman and Samuelson 1983; Nyborg, Rydqvist, and Sundaresan 2002). Furthermore, the relationship between the uncertainty and the regret level of losers is also observed, which has not been examined before. When the bidders want the product badly and are worried about being unable to win the product, their losses significantly strike them more, i.e., they regret more about not bidding high enough after losing. It is also worth to notice that this research addresses a broader scope of uncertainty, including the degree of uncertainty about the product and about wining the product; but previous researches aimed at the uncertainty about the value of the item only.
Implications
The price difference and uncertainty are the major factors that impact thewinner’sregret. Winner’s regret is very like a curse since the winner has to bid higher than all other losers, so the winner realizes that the value of the auction item is lower in other bidders’minds at the end. This may also explain the bidding pattern of “snipers”. Snipers don’t make any offer at first, and wait until the last minute. They then bid the price only slightly higher than the second highest price to win at just seconds before the auction is closed. Using this tactic, snipers can reduce their winner’s curse due to the price difference to minimum. In order to reduce the winner’s curse, consumers should also keep their reasonable price in mind and bid carefully. Consumers may search more information to reduce the uncertainty of the product quality, especially for second-hand products, such as used computers, used brand accessory. If the quality and price are estimated accurately, bidders should be able to think rationally and will not regret too much.
For the losers, the number of bidders and uncertainty are the main determinants of the loser’s regret level. Bidders should realize that the number of bidders is an unreliable indicator of the quality or desirability of a product because it is very easy to be manipulated by the sellers or other bidders. If the bidders can play safely without influenced by other bidders or own uncertainty toward the item, they would not too regret even when they lose the bid.
Limitations and Suggestions to Further Research
Most of the limitations of this study are related to the difficulties in the research execution. The feeling of the curse or say, regret, is not expected to hold too long. According to Balance Theory, bidders have to reduce their post-auction dissonance to reach a new balance status. This adjustment starts right after the auction closed for both winners and losers. The research process of this study was designed to distribute the invitation emails to the bidders immediately after the auction was closed and the bidders should be still online. However, the bidders might not respond instantaneously. In order to control the delay reply which causes the regret feeling declines, future studies may employ experimental design and recruit bidders into the lab. The bidders can report their feelings during and right after the auction that, more prompt reactions can be observed. Of course, an experimental design may provide an unreal environment for participants and lose the external validity.
In the past research on the bidder’s curse, the focus is often on the monetary loss without discussing bidders’psychological states. This study provides another view to examine the curses and wishes that both economics and psychology perspectives of the curses will be fully investigated in the future.
REFERENCE
Ariely, Dan and Itamar Simonson. 2003. Buying, Bidding, Playing, or Competing? Value Assessment and Decision Dynamics. Journal of Consumer Psychology, 13(1): 113-123. Bajari, Patrick and Ali Hortacsu. 2003. The Winner’sCurse, Reserve Prices, and Endogenous Entry: Empirical Insights from E-bay Auctions. The Rand Journal of Economics, 34 (2) 329-355.
Bazerman, Max H. and William F. Samuelson. 1983. I Won theAuction ButDon’tWantthe Prize. Journal of Conflict Resolution, 27(4): 618-634.
Capen, E. C., R. V. Clapp, and W. M. Campbell. 1971. Competitive Bidding in High-Risk Situation. Journal of Petroleum Technology, 23(6): 641-653.
Cassing, James and Richard W. Douglas. 1980. Implications of the Auction Mechanism in Baseball’sFreeAgentDraft.Southern Economic Journal, 47(1): 110-121.
Creyer, Elizabeth H. and William T. Ross, Jr. 1999. The Development and Use of a Regret Experience Measure to Examine the Effects of Outcome Feedback on Regret and Subsequent Choice. Marketing Letters, 10 (4): 379-392
Cox, James C. and R. Mark Isaac. 1984. In Search of the Winner's Curse. Economic Inquiry, 22 (4): 579-592.
Dholakia, Utpal M. and Kerry Soltysinski. 2001. Coveted or Overlooked? The Psychology of Bidding for Comparable Listings in Digital Auctions. Marketing Letters, 12 (3): 225-237 Hansen, Robert G. 1985. Empirical Testing of Auction Theory. The American Economic
Review, 72(2): 156-159.
Holt, Charles A. and Roger Sherman. 1994. The Loser's Curse. The American Economic
Review, 84(3): 642-652.
IDIC. 2005. Yahoo! Taiwan Ups E-Commerce Target to NTD 25 Billion for 2005. Industrial Development and Investment Center, MOEA, News and Events, Retrieved March 14, 2005. Http://Investintaiwan.Nat.Gov.Tw/En/News/200502/2005020702.Html
Inman, Jeffrey and Marcel Zeelenberg. 2002. Regret in Repeat Purchase Versus Switching Decisions: The Attenuating Role of Decision Justifiability. Journal of Consumer
Research, 29 (1): 116-128.
Jap, Sandy D. 2002. Online Reverse Auctions: Issues, Themes, and Prospects for the Future. Journal of the Academy of Marketing Science, 30 (4): 506-525.
Kagel, John H. and Dan Levin. 1986.TheWinner’sCurseand Public Information in Common Value Auctions. The American Economic Review, 76(5): 894-920. Kahneman, Daniel and Amos Tversky. 1979. Prospect Theory: An Analysis of Decision
Under Risk. Econometrica, 47(2): 263-291.
Lucking-Reiley, David. 2000. Auction on the Internet: What’sBeing Auctioned,and How?
Journal of Industrial Economics, 48(3): 227-252.
Milgrom, Paul. 1989. Auctions and Bidding: A Primer. The Journal of Economic Perspectives, 3 (3): 3-22.
Nyborg, Kjell G., Kristian Rydqvist, and Suresh M. Sundaresan. 2002. Bidder Behavior in Multiunit Auctions: Evidence from Swedish Treasury Auctions. The Journal of
Political Economy, 110 (2): 394-424.
Samuelson, William F. and Max H. Bazerman. 1985.TheWinner’sCursein Bilateral Negotiation. Research in Experimental Economics, 3(1): 105-137.
Thaler, Richard H. 1992. The Winner's Curse Paradoxes and Anomalies of Economic Life. New York: Maxwell Macmillan International.
Varaiya, Nikhil P. 1988. The Winner's Curse's Hypothesis and Corporate Takeovers.
Managerial and Decision Economics, 9 (3): 209-219.
Vincent, Daniel R. 1995. Bidding off The Wall: Why Reserve Prices May be Kept Secret.
Wang, James J. D. and Jaime F. Zender. 2002. Auctioning Divisible Goods. Economic
Theory, 19(4): 673-705.
Wilcox, Ronald T. 2000. Experts and Amateurs: The Role of Experience in Internet Auctions.
附件二
Individual Differences on the Searching Behavior of Internet Information: A Study ofInternetUsers’Individualistic-Collectivistic Orientation,
Self-Monitoring, and Heuristic-Systematic Thinking Styles
Abstract
This project explores consumers’information search and processing behavior on the Internet. The purpose is to understand the determinants and mechanism of information search and process. From the perspectives of cognitive, personality, and social psychology, this project will investigate how the individualistic-collectivistic orientation, self-monitoring, and heuristic-systematic thinking relate to the online information evaluation. Current study investigatesindividualdifferencesthatinfluenceconsumers’behaviorofinformation search on the Internet.
A web-based survey is designed to investigate the information research of different product categories, names search goods and experience goods. The results demonstrated that individuals of collectivistic orientation have higher self-monitoring traits and are more likely to use a heuristic thinking style in both condition for the purchase of search goods and experience goods. Second, theinfluencesofconsumers’self-monitoring and thinking styles on information evaluation on the Internet are moderated by product types. In the condition for purchase of search goods, heuristic thinking orientated consumers value other consumers’ information as the most important information among other online information. Compare to purchase of experience goods, high self-monitoring consumers value the some sources of information as higher level for purchase of search goods. Consumers’degreesof self-monitoring and thinking styles are the mediators of the influences
collectivistic-individualistic orientation on the information evaluation on the Internet.
Keywords: Search Goods, Experience Goods, Individualistic-Collectivistic Orientation, Self-Monitoring, Heuristic-Systematic Thinking Styles
INTRODUCTION
According to the survey result from Focus on Internet News Data (FIND, 2005), only 400 thousand people use the Internet in Taiwan in 1996, while more than 9.59 million people in the end of 2005-around 42% of Taiwan population (FIND, December 31, 2005). The amazing jump of the Internet usage rate means the importance of Internet to consumers.
Easy to access product price and related information is one of the advantages of Internet. Consumers not only can shop online, but also can collect information on the Internet, and then go back to physical shops or retailers to purchase products. The report of American Interactive Consumer Survey in 2003 showed American consumers conduct online search, and then purchase products or service they search in the physical stores. There is 137.6 billion dollars product by this purchasing process (The Dieringer Research Group, September 8, 2003). Thus, the characteristic of Internet is interaction and no boundary restricted between buyers and sellers. It provides a brand new channel to collect product information, and is very different from traditional product information collection.。Traditional offline information source include ads on mass media, store visit or discuss with sales people, discuss with friends or family members, and magazine articles. However, how consumers select and evaluate Internet information still remained unknown.
Current research focus on explore how consumers conduct the information search and process on the Internet. Product characteristic, search goods or experience goods, as the moderated variable. Furthermore, we take socio-psychology perspective to discuss what different kinds of consumers use different types of Internet information and how this process influenced by personal different factors, Individualistic-Collectivistic Orientation,
Self-Monitoring Level, and Heuristic-Systematic Thinking Styles, and the interaction effects between them.
LITERATURE REVIEW AND HYPOTHESES
In this research, the individual difference on the searching behavior of the Internet information is explored. Based on the concepts from social, personality, and cognitive psychology, such as individualistic or collectivistic orientation, self-monitoring, heuristic or systematic thinking styles, the effects of individual differences on the information searching behavior on the Internet are investigated. Since the scope of this article is to compare the searching behavior under the condition of search goods and experiences goods, we discuss the two kinds of goods in the first section.
Search and Experience Goods
Empirical studies indicated that consumers rely more on word-of-mouth
communications,other’sevaluationsand individualorgroup judgmentaboutthequality of the products while purchasing experience goods (King and Balasubramanian, 1994; Hill, King, and Cohen, 1996). Recent studies also showed that consumer’sperceived importance of difference information sources, such as from retailers/manufacturers, from consumers, and from neutral sources on the Internet, differs depending on the product types (i.e., search or experience goods) this consumer search for. The information regarding the product quality of search goods is usually more concrete and available from retailer or manufacturer websites. Consumers can judge and compare different product models from these data, thereby
reducing their information dependency on other consumers (Widdows, Bei, and Chen, 2004). However, the information of product attributes for experience goods is not likely to be objective since it has to be consumed to confirm. On the Internet, searching information from other consumers costs relatively less than in the real world, which encourages consumers rely more information from other consumers for search goods (Rha, 2002; Widdows, Bei, and Chen, 2004).
Collectivistic versus Individualistic Orientation
Individualism-collectivism is perhaps the most widely used dimension among the suggested Hefstede’s(1990)measurementsofculturevariability (Aakerand Maheswaran, 1997; Sternberg, 1997). This dimension is the extent to which a given culture encourages and supports the needs and desires of the individual for himself or herself over the needs and desires of a society. Members of individualistic cultures tend to view themselves as separate and autonomous entities. They focus on their own internal attributes and uniqueness.
Members of collectivistic cultures, on the other hand, tend to view themselves as interconnected with other members in the society. They focus on social context, relationships, and opinions of others.
These essential differences also make the members between individualistic and
collectivistic cultures think and behave differently. Sternberg (1997) believed that in some cultures, children are taught not to question too much, and so parents reward children with conservative attitudes and punish liberal ones. These societies turn out emphasize
conformity and tradition. In some other cultures, children are encouraged to question much of what they are taught. Liberal and independent thinking is developed in these cultures (Sternberg, 1997). The former ones can be related to the root of collectivism, while the latter ones are the foundation of individualism. Furthermore, the development of cognitions that refer to a group is encouraged to build up a collective self in a collectivistic culture; while the development of cognitions that involve the personal traits and states is supported to shape a private self in an individualistic culture (Trafimow, Triandis, and Goto, 1991;
Triandis, 1989). In the present study, the tendency of higher independent self-construal is named individualistic orientation, and the tendency of higher interdependent self-construal is named collectivistic orientation.
According to Singelis (1994), people of individualistic orientation focus more their own abilities, attributes, characteristics or goals rather than other’sthoughts,feelingsand actions. They also think about others in the same way rather than the relational or contextual factors. In contrast, people of collectivistic orientation gain their self-esteem from the harmonious interpersonal relationships and the ability to adjust to various situations. Their selves and others are thus intertwined.
Self-Monitoring
People of individualistic orientation are more independent and self-oriented, whereas people of collectivistic orientation are more dependenton others’opinionsand more society-oriented. People with independent selves attend more onto their internal feelings and behave on their personal needs or principles. In contrast, people with interdependent selvesallow others’attitudesdeterminant their own behavior and attend less on internal feelings (Markus and Kitayama, 1991). This personality tendency has been defined as self-monitoring by Snyder (1974). Self-monitoring of expressive behavior is the extent of self-observation and self-control guided by situational cues to social appropriateness. People with high self-monitoring tend to concern for social appropriateness and be highly sensitiveto theexpressionsofothersin socialsituations. They considerothers’behavioras the cue of social appropriateness of self-expression and use it as the guideline for monitoring and managing self-expression and expressive behavior (Snyder, 1974). People of
individualistic orientation are more dominant by the interdependent self-construal, which will induce their traits of self-monitoring than that of collectivistic orientated people.
H1: Individuals of collectivistic orientation have higher self-monitoring traits in both
condition for the purchase of search goods and experience goods. Heuristic-Systematic Model
In the cultural level, previous research supported the relationship of individualism-collectivism with the extension to which people use the contextual cues to form their attitudes
(Cousins,1989). Otherpeople’sopinionsareweighted heavily in collectivistic cultures, but notin individualisticcultures. Itissupported by Cousins’(1989)study thatmembersin collectivistic cultures are more likely to use contextual factors, which are others in the situation, to form their attitudes toward a target person than members in individualistic cultures do. Individualist people judge a target solely based on dispositional traits, while collectivist people use both dispositional traits and contextual factors to form attitudes (Cousins, 1989).
Cousins’(1989)findingscan befurtherlinked to Heuristic-Systematic Model (HSM) of dual thinking process (Chaiken, 1980; 1987) and how the thinking styles are influenced by the tendency of self-concepts. Dual process reasoning roots in social psychology that has been used to examine how contextual and cognitive style differences influence an
individual’sinformation processstyleand socialjudgment(Epstein,Lipson,Holstein,and Huh, 1992; Evans and Over, 1996; Sloman, 1996). Heuristic route of thinking is relatively automatic and relies more on contextual cues of a problem. Individuals who use a heuristic thinking process can make inferences about the issue or task without examining the material in details. On the other hand, systematic route of thinking involves a more analytic
information process. Individuals who adopt a systematic thinking process tend to engage in a discreet analysis of the information with more intelligent activities (Chaiken, 1980; 1987; McElroy and Seta, 2003).
As reviewed before,collectivisticindividualsconsiderotherpeople’sopinion more, which is one kind of contextual effects, to form attitudes and judgments. It is then believed that a collectivism oriented individual tend to value contextual cues of a problem with a heuristic thinking style. In contrast, individualistic people tend to isolate the issue itself from contextualinformation,such asotherpeople’sattitudes,butprefersystematicand diagnostic information. Their thinking style is more close to a systematic process. Therefore, the thinking style tendencies of the individualism oriented individual are hypothesized to be different.
H2: Individuals of collectivistic orientation are more likely to use a heuristic thinking style in
both condition for the purchase of search goods and experience goods. Information Evaluation in Purchase Decisions on the Internet
Applying past conclusions in social psychology and cognitive psychology to consumer behavior on the Internet, consumers with collectivistic versus individualistic orientation should rely on different types of information to make purchase decisions. During a
purchase decision, information about product attributes is indeed directly related to the issue. However,otherinformation,such asotherpeople’opinions and evaluations, endorsed by famous people, brand image, and atmosphere, are considered as contextual cues. Pervious researches (Hoffman & Novak, 1995; Ward & Lee, 2000; Bickart & Schindler, 2001) mentioned that there are three online information sources: information from retailers or manufacturers, from other consumers, and from neutral information. Since the concept of information from retailers or manufacturers is too broad, we can divide it into two
subcategories, image and advertisement.
Online information sources from other consumers become important for experience product because the Internet provides a forum to gain more personal information from online consumer network (Klein, 1998). Rha (2002) found that consumers who searched for experience products’information ranked the information from other consumers to be more important; whereas for search products, consumers tended to rank retail sources to be more important. By the same token, neutral product evaluation information is more important for experience products than for search products because consumers can relatively easily make a quality comparison based on the information from retailers and manufactures. The cost of searching for neutral product evaluation through the Internet is less than in the real world.
Therefore, online sources containing “neutral”assessments, such web articles form consumer product reports, may be even more important for the consumers of experience products.
Based on the premise that product types may influenceconsumers’evaluation on different online information, this study argues that product types will moderate the relationship proposed above. In other words, as supported in previous study, high
self-monitoring and heuristic thinking consumers are tend to use more contextual information than consumers who are low in self-monitoring or with systematic thinking style. However, this study suggests that this difference is more obviously for search goods than for experience goods on the Internet because consumers will use consider contextual information for
experience goods no matter what.
H3: Theinfluencesofconsumers’self-monitoring and thinking styles on information
evaluation on the Internet are moderated by product types.
H3a: In the condition for purchase of search goods, heuristic thinking orientated consumers
value other consumers’information as the most important information among other online information.
H3b: In the condition for purchase of experience goods, heuristic thinking orientated
consumers value the information of retailers’or manufactures’image and ad as more important information than other online information.
H3c: Compare to purchase of experience goods, high self-monitoring consumers value the
four sources of information as higher level for purchase of search goods.
Furthermore, the differences in evaluating information between different self-concept orientationsarebased on consumers’degreeofself-monitoring and thinking styles.
Therefore, the direct individual difference should diminish under the control of self-monitoring and thinking styles.
H4: Consumers’degreesofself-monitoring and thinking styles are the mediators of the
influences collectivistic-individualistic orientation on the information evaluation on the Internet.
METHOD
Mobile phone and digital camera were selected as the search goods, while tour package and dining at a new restaurant were select as the experience goods. Rha (2002) selected travel package and dinner as the representative products in her study. An electronic questionnaire was designed for these four products and distributed via e-mail.
The pretest was conduct to confirm the validity and reliability of these three Chinese version measurements, individualistic or collectivistic orientation scale, self-monitoring scale, and heuristic or systematic thinking styles scale, which were designed in a 7-point Likert-type scale. After few times of Chinese to English back translation, fifty student samples were selected and asked to finish the questionnaire in a paper-pencil base. The average score for the individualistic orientation, collectivistic orientation, self-monitoring, heuristic thinking style, and systematic thinking style were 4.33, 5.83, 3.79, 5.24, and 4.29, respectively.
Participant
Since the collected sample was a large amount, we random selected 4 sample sets, around 200 samples as one sample set, from the age range of 18 to 25 and the proportion of gender is half-half. The first sample set from search goods and experience goods was used to conduct confirmatory factor analysis (CFA), whereas the second sample set was used to conduct full model.
Measurement
The scales of individualistic or collectivistic orientation, self-monitoring, and heuristic or systematic thinking styles were from previous researches. We adopted the
more detailed.
Collectivistic versus Individualistic Orientation Scale
Singelis (1994) developed 24 items for self-construal scale which was formed in 5-point Likert-type scale. He found two factors model, interdependence and independence,
presented better goodness-of-fit index than one factors, and to have satisfactory reliability and validity. After pretest, 13 items, 7 items for interdependence and the other 6’s for independence, were included in this research. The anchor arranged in 5-point Likert-type (1=strongly disagree, and 5=strongly agree).
Self-Monitoring Scale
Snyder (1974) developed 25 items for self-monitoring scale which was formed in yes/no questions. Current research would translate this scale to Chinese, though some Chinese scales did exist. After pretest, 14 items were included in this research. The anchor arranged in 5-point Likert-type (1=strongly disagree, and 5=strongly agree).
Heuristic-Systematic Thinking Style
Zenhausern (1978) proposed 20 items for heuristic-systematic thinking style scale which was formed in two versions, yes/no questions version and 10-point Liket-type scale.
McElroy and Seta (2003) took this scale in marketing research to analysis consumers’ thinking styles. After pretest, 14 items, 7 items for heuristic thinking and the other 7’s for systematic thinking, were included in this research. The anchor arranged in 5-point Likert-type (1=strongly disagree, and 5=strongly agree).
Information Evaluation in Purchase Decisions on the Internet
Pervious researches mentioned that there are three online information sources: information from retailers or manufacturers, from other consumers, and from neutral information. We modify Bei, Chen, and Widdows’(2004) measurement of perceived importance of information sources. We separated the information from retailers or
manufacturers into image and advertisement. After pretest, 9 items, 3 items for information from other consumers, each 2 items for it from neutral source, ad, and image, were included in this research. The anchor arranged in 5-point Likert-type (1=strongly disagree, and 5=strongly agree).
Data Analysis Method
This research adopted two-step structural equation procedure (Jöreskog and Sörbon, 1989) proposed by Anderson and Gerbing (1988). Two-group confirmatory factor analysis (CFA) was conduct to evaluate construct validity and to test the equality of the measurement models across two product categories. Moreover, we used CFA with partial disaggregation (Bagozzi and Heatherton, 1994; Dabholkar, Thorpe, and Rentz, 1996). The partial
disaggregation modified the traditional structural equations approach which used each item as a separate indicator of the related construct. Although the traditional approach provides the more detailed level of analysis for construct testing, it is unwieldy to deal with the condition of likely high levels of random error in typical items and the many parameters that must be estimated (Bagozzi and Heatherton, 1994).
Partial disaggregation is accomplished by randomly aggregating items that relate to a given construct so that there are fewer combined indicators instead of original single-item indicators (Dabholkar, Thorpe, and Rentz, 1996). Bandalos (2002) called this technique “item parceling,”and revealed that the use of item parcels resulted in better fitting solutions.
We took sample 1 (Nsearch goods= 200, Nexperience goods= 201) to test measurement model,
and sample 2 (Nsearch goods= 200, Nexperience goods= 200) to test structural model. We
performed two-group structural analysis to test whether the structural coefficients were unequal between these two groups.
Confirmatory Factor Analysis (CFA)
Since heuristic-systematic thinking style scale and collectivistic-individualistic orientation scale are two factor constructs, we conducted CFA of these two construct in advance, and then conducted the CFA of all constructs. Moreover, we adopted two-group CFA to accomplish the purpose of this study which is comparison of two different product categories.
Heuristic-systematic thinking style scale included heuristic and systematic factors, and each factors included 7 items. Partial disaggregation of this model yielded acceptable fit, χ2
(14)= 21.09, Root Mean Square Error of Approximation (RMSEA) = 0.053, Normed Fit
Index (NFI) = 0.90, Non-Normed Fit Index (NNFI) = 0.87, Comparative Fit Index (CFI) = 0.93. We also conduct partial disaggregation of collectivistic-individualistic orientation scale, and yielded acceptable fit (χ2(6)= 25.35, RMSEA=0.13, NFI=0.82, CFI=0.84). After
checking these two constructs have passed the second-order CFA tests, we then conducted CFA which included individualistic-collectivistic orientation, self-monitoring,
heuristic-systematic thinking, and information source from others customers, neutral report, and ad and image of retailers and manufacturers . Since self-monitoring scale includes 14 items, we deleted 3 items which was high cross-loading with other constructs and left 11 items in this scale. The results also showed acceptable measurement model fit, χ2(166)=
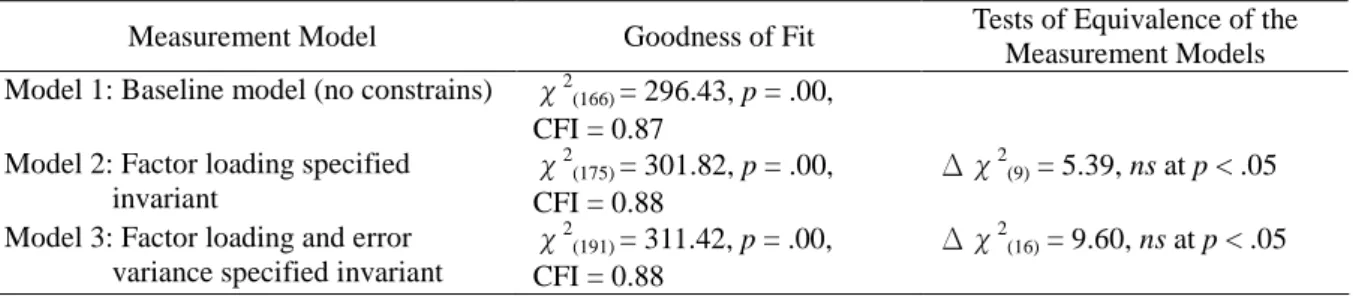
296.43, RMSEA=0.063, NNFI=0.82, CFI=0.87. Equivalence of Measurement Models: Two Groups
In order to test factor loading invariance, we constrained the factor loading equal across groups. The nonsignificant difference in chi-square between this model (model 2 in Table 1) and baseline model indicates that the factor loading of the two measurement models were invariant, ∆χ2(9)= 5.39, ns at p < .05. The next step was to test the equality of error
variances of the latent variables across the two groups. The nonsignificant difference in chi-square between this model (model 3 in Table 1) and model 2 indicates that the error variances of the two measurement models were invariant, ∆χ2(16)= 9.60, ns at p < .05. The
above results reveal that the measurement models of factor loading and error variances between search goods and experience goods were invariance. This measurement model with loading and error invariance was subsequently used in the structural model analysis (Chiou, Droge, and Hanvanich, 2002).
Table 1 insert here
The validity of the final model was then evaluated. An examination of the final model (see Table 2) indicated that substantial amounts of variance in the measures were captured by the latent constructs because all loading except one path were significant. This shows the convergent validity of this measurement is acceptable.
Table 2 insert here
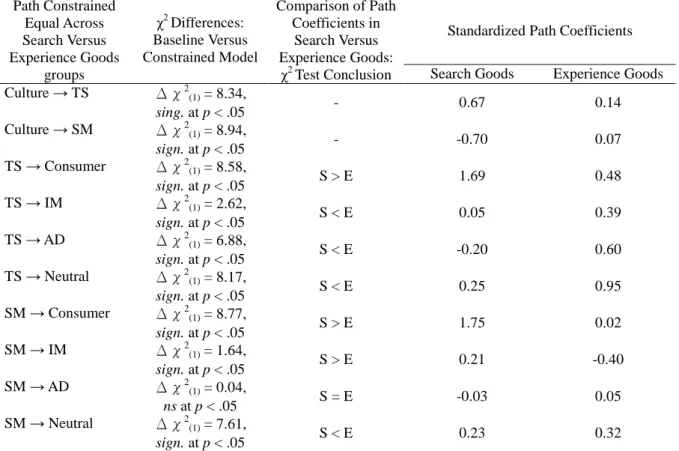
The Structural Model and Hypothesis Testing
Individualistic-collectivistic orientation and heuristic-systematic thinking scale were composition of two factors. In order to test the hypothesis and explain the relationships with other variables, we took the ratio of individualism and collectivism to instead the original raw score of culture dimension. In the same token, the ratio of heuristic score and systematic scores was taken to instead the original raw scores of thinking style dimension. The results of the baseline two-group model with no structural constrains were χ2(90)= 125.39,
RMSEA=0.044, NNFI=0.89, CFI=0.93. After checking the model which is achieved good model fit, we then tested equality of structural paths by systematically constraining