國
立
交
通
大
學
科技管理研究所
碩
士
論
文
可靠度與壽命分析-美國與歐洲重型卡車製造商與顧客
Reliability and Durability of Heavy-Duty Trucks
- Implications for American and
Western European Manufacturers and Customers
研究生: 約可博
指導教授:虞孝成 教授
Reliability and Durability of Heavy-Duty Trucks
- Implications for American and
Western European Manufacturers and Customers
研 究 生:約可博 Student:Jacob Lindmark
指導教授:虞孝成 Advisor:Dr. Hsiao-Cheng Yu
國 立 交 通 大 學
科技管理研究所
碩 士 論 文
A Thesissubmitted to the Institute of Management of Technology College of Management
National Chiao Tung University in partial fulfillment of the requirements
for the Degree of
Master of Business Administration
January 2008
Hsinchu, Taiwan, Republic of China
i
Reliability and Durability of Heavy-Duty Trucks
- Implications for American and
Western European Manufacturers and Customers
Student:Jacob Lindmark Advisors: Dr. Hsiao-Cheng Yu
Mr. Per M Johansson
Institute of Management of Technology
National Chiao Tung University
ABSTRACT
This Master’s Thesis focuses on the reliability of Heavy-Duty Trucks and how this affects satisfaction and brand image among customers. A considerable share of the thesis is concerned with quantitative analyses, founded on regression analysis, with the objective of measuring how strong the reactions of customers in Western Europe and the US are to changes in reliability. The thesis provides measures of how well changes in customer satisfaction with reliability and reliability image can be predicted by changes in reliability performance.
Seven face-to-face interviews were also carried out with managers of Swedish truck fleets in order to understand better how customers acquire, utilise and diffuse information about reliability and durability.
Finally, the thesis deals with economical aspects of durability, which initially was supposed to be the focus of this thesis and which is also closely connected to reliability. A model is created to describe my understanding on the issue and the constituents of the model are discussed.
The report is made together with the Institute of Management of Technology at National Chiao Tung University, Taiwan, and the Department of Technology Management and
Economics at Chalmers University of Technology, Sweden.
ii
Acknowledgements
Writing this thesis has been an exciting experience. I have learned a lot and it has increased my interest in the transportation industry. The thesis could not have been done without the valuable support of my advisor Yu Hsiao-Cheng, who has given me valuable comments and encouraged me to pursue my IMBA degree. The insightful comments from Prof. Kay Lee and Professor Grace Lin have also been necessary to get the state of this report to where it is today. My time in Taiwan would not have been as fantastic as it was without the valuable support from Mr. An and Ms. Wang at the International Service Center. Cindy at the MOT office has also helped me out a lot and deserves my deepest gratitude. I would also like to thank all others that I have met during my time in Taiwan. The Taiwanese people I have met are incredibly helpful and friendly and I truly wish that there were more of this warmth around the world. Thank you all for your hospitality and for your kind help!
Gothenburg, Sweden, January 9th 2008.
iii
Contents
ABSTRACT………i ACKNOWLEDGEMENTS………...ii CONTENTS………..iii LIST OF TABLES………...v LIST OF FIGURES………...vi 1 INTRODUCTION ...1 1.1 BACKGROUND...1 1.2 OBJECTIVES...3 1.3 MOTIVATION...4 1.4 DELIMITATIONS...7 1.5 ORGANISATIONAL PRESENTATION...8 2 THEORETICAL FRAMEWORK...10 2.1 QUALITY...10 2.2 RELIABILITY...13 2.3 THE CUSTOMER CONCEPT...142.4 CUSTOMER SATISFACTION AND LOYALTY...15
2.5 BRAND IMAGE...18
2.6 PRIORITIES OF TRUCK CUSTOMERS...19
2.7 THE IMPACT OF QUALITY ON BUSINESS IMPORTANCE...21
2.8 OPTIMAL RELIABILITY...22
2.9 DURABILITY AND ECONOMIC LIFE...23
2.9.1 Classic durability economics theory………...26
2.9.2 Potential implications of durability on business………...28
3 METHODOLOGY ...30 3.1 METHODOLOGICAL CONSIDERATIONS...30 3.1.1 Research question 1 (RQ1)……… 30 3.1.2 Research question 2 (RQ2)………34 3.1.3 Research question 3 (RQ3)………36 3.1.4 Research question 4 (RQ4)………36 3.1.5 Research question 5 (RQ5)………37 3.1.6 Research question 6 (RQ6)………38
3.2 SECONDARY DATA ANALYSIS...38
3.3 CAUSALITY ANALYSIS. ...39
3.4 REGRESSION ANALYSIS...40
3.4.1 Multivariate regression analysis………...41
3.5 LONGITUDINAL DATA...44 3.6 INTERVIEWS...44 3.6.1Structuredinterview………...44 3.6.2 Unstructured interviews……….45 3.6.3 Semi-structured interviews………45 4 RESULTS...46
4.1 MEASURES OF FAILURE FREQUENCY AND UNSCHEDULED DOWNTIME (RQ1) ...46
iv
4.1.2 Western European market……….56
4.2 SATISFACTION SENSITIVITY (RQ2) ...64
4.2.1 US market……….66
4.2.2 Western Europe………...76
4.3 IMAGE SENSITIVITY (RQ3) ...80
4.4 THE ROLE OF SERVICE SATISFACTION (RQ4) ...84
4.5 GENERATION AND DIFFUSION OF KNOWLEDGE AND IMPRESSIONS (RQ5) ...90
4.5.1Sample……….91
4.5.2Trackingproblems……….93
4.5.3 The use of knowledge about reliability and durability………...94
4.5.4 Communication within the industry………95
4.5.5 The importance of personal relations………..97
4.5.6 Building an impression………..99
4.5.7 Acceptance……….101
4.6 ECONOMICAL ASPECTS OF DURABILITY (RQ6) ...103
5 DISCUSSION...117
5.1 CONCLUSIONS...117
5.2 METHODOLOGICAL VALIDITY AND RELIABILITY...120
5.2.1 Validity………...120
5.2.2 Reliability………...121
5.3 USING CORRELATION FOR RATING IMPORTANCE...123
5.4 SUGGESTIONS FOR FUTURE RESEARCH...125
5.4.1 Customer reactions to changes in reliability………125
5.4.2 Economical aspects of durability………...125
LIST OF REFERENCES ...128
APPENDIX 1: ABBREVIATIONS AND KEY CONCEPTS...135
ABBREVIATIONS...135
KEY CONCEPTS...135
APPENDIX 2: IMPORTANT TECHNICAL COMPONENTS ...137
APPENDIX 3: BASIC TYPES OF TRUCKS AND TRAILERS...138
APPENDIX 5: INTERVIEW GUIDE (ENGLISH)...139
APPENDIX 6: DURABILITY ECONOMICS ...144
APPENDIX 7: TECHNOLOGY DISCRIMINATING REGULATIONS ON IN-USE TRUCKS ...147
Emission tolls………147
Restricted access zones and retrofit requirements and incentives………..149
v
List of Tables
Table 1: The priorities of Scania R143 customers………. 20
Table 2: Potential consequences of an extended design lifetime………....29
Table 3: Reliability measures………..31
Table 4: Correlation coefficients of dynamic relation between measures of reliability and measured customer satisfaction with reliability………55
Table 5: Correlation coefficients (Pearson r) between the X’s………56
Table 6: Multiple correlation coefficients………56
Table 7: Correlation coefficients of dynamic relation between measures of reliability and measured customer satisfaction with reliability………....61
Table 8: Correlation coefficients (Pearsonr) between the X’s……….61
Table 9: Multiple correlation coefficients………....62
Table 10: Regression of absolute changes………....70
Table 11: Regression of change factors………....71
Table 12: Regression of absolute changes………....73
Table 13: Regression of change factors………....74
Table 14: Regression of absolute changes………....76
Table 15: Regression of change factors………....78
Table 16: Regression of absolute changes………....81
Table 17: Regression of change factors………....82
Table 18: Mean ratings of repurchase intention and willingness to recommend per group………..86
Table 19: Some technological advances with potential effect on fuel efficiency…………...109
vi
List of Figures
Figure 1: The business areas and business units of the Volvo Group………8
Figure 2: The concepts that constitute dependability………...…14
Figure 3: The Kano model………18
Figure 4: Reliability cost/reliability worth concept………..22
Figure 5: An example of a lifetime percentile curve………26
Figure 6: Ballantine for X1 and X2 with Y……….. 42
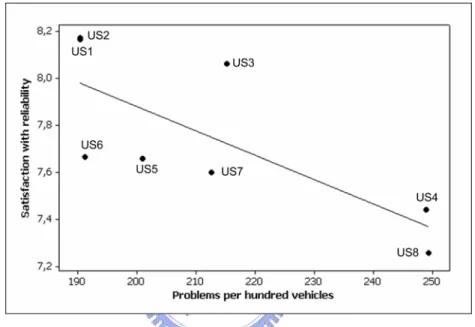
Figure 7: Cross-sectional relation between Y, customer satisfaction with reliability and dependability and X1, Problems per 100 vehicles………50
Figure 8: Cross-sectional relation between Y, customer satisfaction with reliability and dependability and X2, Problems per 10.000 miles………...51
Figure 9: Cross-sectional relation between Y, customer satisfaction with reliability and dependability and X3, Times with unscheduled downtime………..51
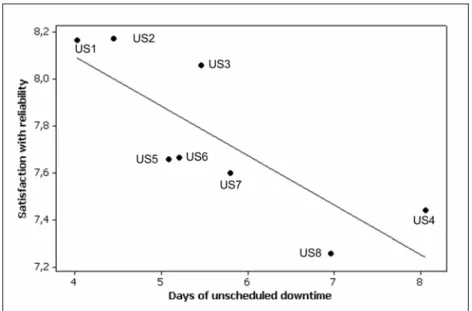
Figure 10: Cross-sectional relation between Y, customer satisfaction with reliability and dependability and X4, Days with unscheduled downtime………51
Figure 11: Dynamic relation between customer satisfaction with reliability and dependability and problems per hundred vehicles……….52
Figure 12: Dynamic relation between customer satisfaction with reliability and dependability and problems per 10.000 miles………52
Figure 13: Dynamic relation between customer satisfaction with reliability and dependability and times with downtime……….53
Figure 14: Dynamic relation between customer satisfaction with reliability and dependability and days with downtime ………...53
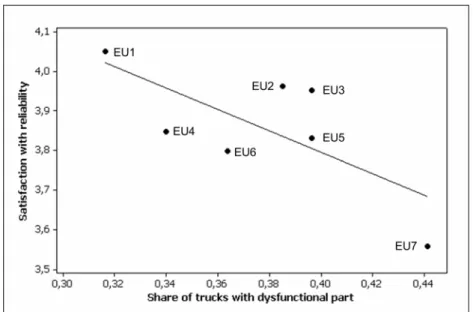
Figure 15: Cross-sectional relation between customer satisfaction with reliability and share of trucks with dysfunctional part………..57
Figure 16: Cross-sectional relation between customer satisfaction with reliability and average number of problems among trucks with problem(s)………...58
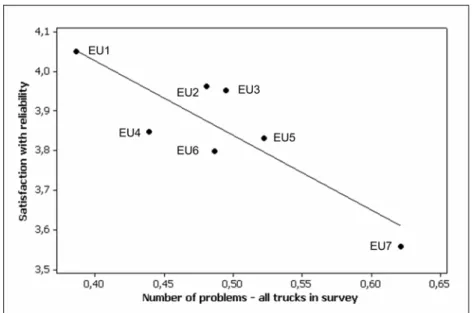
Figure 17: Cross-sectional relation between customer satisfaction with reliability and average number of problems among all trucks………58
Figure 18: Dynamic relation between customer satisfaction with reliability and share of trucks with some dysfunctional part………60
Figure 19: Dynamic relation between customer satisfaction with reliability and the average number of problems among dysfunctional trucks………..60
vii
Figure 20: Dynamic relation between customer satisfaction with reliability and
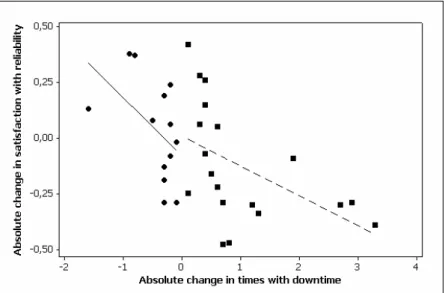
average number of problems among all trucks………..61 Figure 21: Absolute change YtY of satisfaction with reliability and dependability
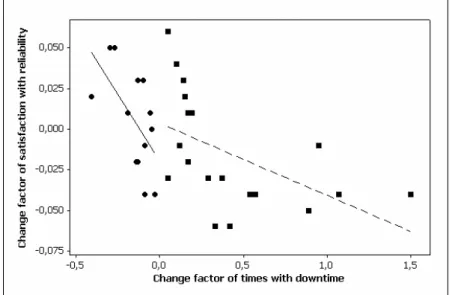
vs. change factor of times with downtime ……….67 Figure 22: Anscombe´s quartet………...68 Figure 23: Grouping of data points, absolute changes………69 Figure 24: Change factor YtY of satisfaction with reliability and dependability vs.
change factor of times with downtime………70 Figure 25: Absolute changes YTY in satisfaction with reliability and dependability vs. absolute changes YTY in problems per 100 vehicles……….73 Figure 26: Change factor YTY of satisfaction with reliability and dependability vs.
change factor of problems per 100 vehicles………...74 Figure 27: Absolute changes YTY in satisfaction with reliability vs. absolute changes
YTY in number of problems per vehicle………....76 Figure 28: Grouping of data………76 Figure 29: Change factor YTY of satisfaction with reliability vs. change factor of
problems per vehicle………..77 Figure 30: Absolute changes in image vs. absolute changes in failure frequency………….81 Figure 31: Change factors of image vs. change factors of failure frequency………..82 Figure 32: Groups of ratings for service satisfaction and reliability satisfaction…………...85 Figure 33: Mean ratings of repurchase intention per group………...87 Figure 34: Mean ratings of willingness to recommend per group………..87 Figure 35: Fleet sizes………..90 Figure 36: The shares of different brands of all trucks in the fleets of our interviewees……91 Figure 37: Approximate shares of fleets per transportation type………91 Figure 38: Service and repairs location and service contracts………91 Figure 39: Inputs to impressions about the reliability and durability of truck brands
and models………..99 Figure 40: Driveline durability and some possibly affected attributes from a
manufacturer’s perspective………103 Figure 41: Principle examples of driveline lifetimes in relation to lifetime of chassis
and cab………105 Figure 42: Driveline components………...137 Figure 43: Types of trucks and trailers………...138
1
1 Introduction
1.1 Background
I will start this report by introducing the reader to how this topic “Reliability and Durability of Heavy-Duty Trucks – Implications for American and Western European Manufacturers” was chosen. It puts the contents of the thesis into context and also raises some ideas on future research which will be elaborated in the discussion section.
The idea for this thesis originates from a concern at Volvo Powertrain Corporation in Gothenburg, Sweden. There was a need for further knowledge in the area of product durability. More specifically, the company wanted to know more about how product durability affects the business economically, through aspects such as customer satisfaction, company image and the aftermarket business. The actual impact of changes in product durability on the aftermarket is not clear and needs to be analysed and further explored. On one hand, one can argue that with more durable trucks there is more time to sell spare parts and provide repair services. On the other hand it might be so that more durable trucks are generally more reliable and there would thus be fewer repairs needed.
There are many characteristics of the truck industry that make this kind of studies complex. For instance, in some markets the sales of original spare parts end long before the trucks stop being useful, due to the presence of unauthorized workshop services and non-original parts that are competitive in price. Furthermore, a large share of the trucks are sold to large fleets and they tend to keep trucks only for a few years, while the reliability is very high, causing them not to notice an improved durability. It soon becomes clear that these issues are very hard to penetrate. Although the great complexity of this area, my supervisors and I decided that I should proceed with the task, although not attempting to provide a complete picture. A brief overview of the subject with some new understanding would provide great value for the organization, while the current knowledge is very limited.
However, it became clear after a while, that many of the analyses were impossible to carry out. Not because the knowledge and data was not located at one single place, but rather because it did not exist anywhere in the corporation. Therefore the focus on durability moved to
2
reliability, an area in which the data is much more accessible. My focus on the driveline also had to broaden so that I whenever necessary look at the complete vehicle instead of only the driveline.
The next step was to make a brief pre-study on customer satisfaction and reliability and the connection between them. It soon became evident that the commercial customer surveys that are purchased by the organisation are a great resource and provide studies on many relevant factors with relatively large samples. Therefore, there is a relatively large focus on these studies and the new conclusions that they can facilitate. In order to gain some more qualitative and rich knowledge through this thesis, I have also performed a set of interviews with fleet managers with the objective of getting input about how customers might reason about reliability and durability and how knowledge and impressions on the topic are utilised and diffused within the industry
3
1.2 Objectives
We know that the quality dimension reliability is important for the overall satisfaction of customers and for their loyalty to brands. However, there is much yet to find out about how customers reason and how strong their reactions might be to changes in reliability. The objective of this thesis is to create some quantitative base for the sensitivity of customers to changes in reliability and what factors we should look at when we try to measure it through surveys. Besides this, we will try to get a more nuanced picture of how customers reason regarding the reliability and durability of trucks. The thesis will analyse some features of reliability and more closely look at how changes in reliability might affect customer satisfaction and image. The research can be described more concretely by the following research questions:
Research question 1
What market research measures of reliability available to the Volvo Group have the largest explanatory power for the customer satisfaction with reliability?
Research question 2
How clearly are changes in product reliability on US and Western European markets reflected in customer satisfaction with reliability? Is there a difference between improved and worsened reliability?
Research question 3
Different customers have different images of the ability of truck manufacturers to provide reliable trucks. How are these images affected by changes in truck reliability?
Is there a difference between reliability improvements and reliability deteriorations concerning the size of the effects that they have on image?
Research question 4
Can good1 service compensate for poor reliability?
1 With good service, we mean service that makes customers satisfied. The service satisfaction is in this thesis measured through a sum of several service ratings. This is further explained in section 3.1.4.
4
Research question 5
How is knowledge about the reliability and durability of truck models generated and diffused among truck customers? What importance does it have when making decisions about replacements of trucks?
Research question 6
What are possible economical effects for Volvo of a changed durability of driveline components?
1.3 Motivation
Reliability is a quality dimension that has large importance in most industries. The heavy-duty truck industry is one where its importance almost can not be overestimated. Reliability is in a major European customer satisfaction survey listed as the most important factor for customer retention, both as stated by customers and as a result of correlation studies between customer repurchase intentions and satisfaction with different factors2. Furthermore poor reliability is often mentioned as the main reason not to repurchase a truck of the same brand. Also in studies of the US market, the importance of reliability is emphasized. For instance, reliability has a large share of the customer satisfaction index constructed by JD Power and Associates, which is based on customer statements. According to Brian Etchells, senior research manager in the commercial vehicle group at J.D. Power and Associates3 “Performance and quality account for 65 percent of total product satisfaction, so it’s easy to see how problems quickly erode owner satisfaction”. He elaborates “Time is money in the trucking business, and when a truck is in for service, it impacts the fleet’s bottom line,”
In line with the great importance of reliability for a truck manufacturer, there are a lot of efforts in Volvo as well as its competitors to keep a good reliability that will make the customers satisfied and make them loyal to their brands. However, there are many and large areas in which the knowledge can be further extended.
2 Correlation between factors does not imply a cause-and-effect relationship, but it can support such hypotheses based on other arguments such as, in this case, statements by customers. A discussion about the use of
correlation studies to show importance can be found in Section 5.1.
3 Press Release: Class 8 Truck Quality Declines Due to More Problems with Low-Emission Engines (16 August 2006). Available: <http://www.jdpower.com/press-releases/pressrelease.aspx?id=2006136> (2007-08-17)
5
Reliability and even more so durability are areas that need to be evaluated during a relatively long period of time and therefore they are not as well analysed as are features that can be evaluated more or less instantly, such as aesthetics or user-friendliness. Any added knowledge in these areas is therefore valuable, even if it might be on a seemingly basic level. During the warranty period, the monitoring of reliability is usually good, however, after this period the knowledge is limited. Also, there are still opportunities for improvements when it comes to connecting the reliability to the reactions of the customers. This thesis can provide benefits to Volvo, in terms of some added understanding of how customers respond to product reliability. Being more specific, I will explain why I believe that the listed research questions are interesting. We know that reliability is a very important feature for trucks customers. The reliability of trucks has, when looking a few decades back improved tremendously. It is clear that technical progress can improve reliability in the long run. However, in the short run, it is commonly so that technical innovations can lead to deteriorated reliability due to new concepts and components being introduced. New technology causes uncertainties in both the development and in the production. When the root causes of the problems have been found, they can generally be solved and after a while the production becomes more stable, yielding more reliable products.
So we have a situation where technical development is generally positive for the reliability in the long run but often negative in the short run. Some innovations and improvements are necessary in order to be competitive at all, some might be necessary only if one wants to provide state-of-the-art technology. How innovative one chooses to be has an impact on reliability in both the short and the long run, and it would be interesting to know the impact better. One important aspect is whether the deteriorated reliability early after a new technology introduction can be compensated for with improved reliability later. The more specific question that we ask is if there is a difference in the size of the reactions in customer satisfaction from reliability changes between deteriorations and improvements (Research question 2). If there is no such difference, we can reason that even though our technological advances might have a negative effect on reliability in the short run, the satisfaction will recover when the better reliability as a result of the innovation is seen. If the reliability deteriorations have a much bigger effect on the satisfaction than the improvements do, then we might need to be careful with having a reliability that jumps up and down.
6
It is also interesting to look at the same question for the image, which is done through research question 3. Do deteriorations and improvements have the same power in affecting image? One major difference between image and customer satisfaction is that only those who own a truck of a certain brand can be satisfied or dissatisfied with it, but everyone who has heard of a make can have their own image of it. Therefore, while looking also at image, it would be relevant to know how customers acquire information about other trucks than their own and how they discuss the reliability of trucks with others (Research question 5).
The first research question is necessary to facilitate research questions 2 and 3, where we need to have the best measure of reliability for which we study the effects in satisfaction. RQ1 also has relevance in itself. The commercial surveys that many manufacturers buy provide several measures of the product reliability. In many cases there is a relatively large correlation between these measures, but sometimes they give completely different pictures. It is then valuable to know which of these measures that generally best describe reliability in the sense that it has a high correlation with the satisfaction with reliability stated by the customers. Research question 4 came up as something we wanted to test after hearing from one customer after another in our interviews that problems happen to everyone, the important thing is how they are solved. We interpreted this as if they were saying that quite a few problems can be acceptable as well as they are solved well and fast. It would be very interesting to test this hypothesis on a large sample.
7
1.4 Delimitations
Due to methodological reasons we make several delimitations concerning geographical coverage. Research questions 1-4 are all concerned with quantitative analysis of secondary data from commercial customer satisfaction surveys. Such studies available to the Volvo Group provide a good picture of the Western European and US markets, which together comprise about 70% of the sales of Volvo Trucks. In other markets, the sales are substantially lower and the coverage of detailed customer satisfaction surveys is limited. Therefore, we limit ourselves to the US and Western Europe. For research questions 3 and 4 we have furthermore excluded the US market, leaving only Western Europe. For RQ3, the reason is that there are no questions about image in the survey of the US market that could access and in the case of RQ4, there was a need to access the responses on an individual level rather than at a brand or model level as was the case for the data available to me for the US market. The time periods on which quantitative analyses have been made are 2000-2007 for Western Europe and 2002-2006 for the US. Research question 5 has been investigated through face-to-face interviews. Therefore we chose to limit ourselves to the Swedish market to satisfy the time constraint present.
The countries that in this thesis represent what we refer to as Western Europe are Germany, the United Kingdom, the Netherlands, Belgium, France, Spain and Italy. This list of countries is based on the scope of the customer survey that we have used for secondary data analysis and we have not had any possibility to affect it, except for the option to exclude countries. We believe that these countries give a fair representation of Western Europe.
The trucks that the secondary data, and thereby also my analysis is confined to is, for the US, Heavy Duty Trucks, more specifically Class 8 vehicles, i.e. less than five-axle tractor4/single trailer for medium-haul delivery5 The vehicle are of model year two years prior to the year that the survey is carried out. For Western Europe, the trucks are Heavy Duty Trucks with a
4 See Appendix 1: Abbreviations and Key for a verbal description of a tractor truck and Appendix 3: Basic types of trucks and trailers for a picture.
5 US Department of Transportation. FHWA Vehicle Classes (Electronic).
8
Gross Vehicle Weight6 of 16 tons or more that have been delivered during the last 6 - 24 months when survey is carried out.
1.5 Organisational presentation
“The Volvo Group is one of the world’s leading manufacturers of trucks, buses and construction equipment, drive systems for marine and industrial applications, aerospace components and services”7.
The group has approximately 82,000 employees and its net sales in 2005 amounted to 23 billion Euro8. Volvo Powertrain is a business unit in the Volvo Group and has about 8000 employees. They provide integrated powertrain systems comprising diesel engines, transmissions and drive shafts for the end products of the Volvo Group. In the 9–18 liter classes, Volvo Powertrain is the world’s largest producer of heavy diesel engines9.
Figure 1: The business areas and business units of the Volvo Group10
6 “The maximum loaded weight (including the vehicle itself, passengers, and cargo) for which a vehicle is
designed, as specified by the manufacturer. Often used as a criterion of vehicle size for the purpose of legislation; the exact definition may vary depending on the jurisdiction”.
DieselNet, Glossary (Electronic). Available: <http://www.dieselnet.com/gl-e.html> (2007-11-18) 7 Volvo Homepage (2007)
8 Ibid.
9 Uniform Power (2006). Information leaflet. Available:
<http://www3.volvo.com/investors/finrep/ar06/eng/volvopowertrain/pops/printable/16_volvo_powertrain.pdf> (2007-07-03)
9
The business areas are the divisions that provide products and services to external customers. Volvo Powertrain, as indicated in Figure , providing driveline components for the four truck brands: Mack Trucks, Renault Trucks, Volvo Trucks and Nissan Diesel. It further delivers components to buses, construction equipment and marine applications through Volvo Penta.
10
2 Theoretical Framework
2.1 Quality
Most companies of today recognise the importance of quality, whether they are providing products, services or both. However, what quality actually means is in many cases a matter of interpretation biased by the objectives of the observer. For instance, a common situation according to Garvin (1984) is that marketing departments focus on quality to satisfy customers and thereby increase sales. Manufacturing departments on the other hand, see the main benefits of quality as lowering costs of scrap and rework. We need to be aware that there are different views and that this affects our business. Garvin (1984) has identified five main approaches to quality, some with their own objectives.
The transcendent approach
Quality is ”innate excellence”. This view implies that there is no precise definition and Garvin draws parallels between the transcendent approach to quality and Plato’s discussion of beauty, where Plato says that one can understand beauty only by being exposed to a series of objects that have the characteristic.
The product-based approach
In this view quality reflects the quantity of some desirable ingredient. This view could for instance imply that a digital camera with many pixels is of higher quality than one with fewer pixels.
A problem with the product based approach is that one must know the desired ingredients that in many cases can differ greatly between different users. It is also common that an increased quantity of an ingredient can have a positive effect on the performance of a product only within some interval, and that it outside the interval have no effect at all or even a negative effect. A consequence of the product based approach is that increasing the quantity of some desirable ingredient is often costly and it therefore implies that quality improvements need to be costly.
11
There are many definitions of quality that fall into this category. One of them is that of Bergman & Klefsjö (2003). “The quality of a product is its ability to satisfy, or preferably exceed, the needs and expectations of the customers”. In this view quality is subjective. An important feature of this view is that quality can be improved by better understanding the needs and wants of the customers and it therefore does not necessarily have to be costly. If considering the potential for increased sales that a better understanding of the customers will yield, there is of course no cost at all; rather, quality improvements are sources of increased profitability.
The manufacturing-based approach
With this approach, the measure of quality is conformance to specifications. High quality products are those that are produced as specified and for which the variation between individual units are low. This view takes the customer into account to some extent, while it is assumed that products outside specifications generally perform less good than those within and that variation in itself can have a negative effect on customer satisfaction. The main focus, however is reducing costs of scrap and rework by doing things right the first time.
The value-based approach
The unique characteristic of this approach is that it takes price into account. A high quality product is one that performs well at an acceptable price. A problem with this view is that we equate quality with the extent to which it is worth its price. It makes practical considerations regarding quality improvements hard and it becomes hard to judge the difference in quality between two products. In some cases a small quality increase is irrelevant, but in some cases it is very important and worth paying extra for.
There appears not to be one definition that suits all products and conditions. Rather we should have different foci, depending on our current objective. The overall main concern for a corporation however, must however always be to satisfy their customers. In general, one can see a trend that companies are moving more and more towards customer focus. The marketing guru Philip Kotler (2003), puts the need of increased customer focus into words by saying that
“If your people are not thinking customer, they are not thinking. If they are not directly serving the customer, they'd better serve someone who is. If they don't take care of your customers, someone else will.”
12
Or as someone at Ford supposedly once said (Kotler, 2003): “If we're not customer driven, our cars won't be either”
Garvin (1984) furthermore names eight dimensions of quality. They are • Performance, • Features, • Reliability, • Conformance, • Durability, • Serviceability, • Aesthetics, • Perceived quality,
Whether this is an exhaustive group or not and whether these are more important dimensions than others can be discussed, but the list helps us to think about what aspects there can be of quality. Furthermore, this set of dimensions has been accepted by many and is generally considered a “seminal work in the area of strategic quality management” (Curkovic, 1999).
13
2.2 Reliability
It is important that we have a clear picture of what we mean by reliability. Most definitions are essentially in line with that of O’Connor (2001), stating that reliability is
“...the ability of an item or of items to keep operating, or to be available for operation, over a period of time without failing”.
The most common measures of reliability are mean time between failures, mean time to first failure and failure rate per unit time(Garvin, 1984), the latter which is a probability distribution rather than a deterministic number.
That reliability is important is commonly accepted and this usually holds also for people who are not actively working to promote prioritising of quality efforts on the manufacturer side. As consumers, we constantly experience the drawbacks of poor reliability. We expect our consumer electronics, our transportation, and our kitchen appliances etc. to work and when they do not, they often create large distractions and dissatisfaction. One side of it is that we often are burden with a cost when for instance our car breaks down. Another side is that we loose our trust in our products. When using them, we need to feel certain that they can provide us with the services that they are supposed to. Poor reliability can on top of cost also create risks to our safety, as in the case of car brakes loosing its function or the material defects making buildings or bridges collapse. For the manufacturer, poor reliability causes costs of scrap and rework in production, warranty costs and bad reputation among other things.
A concept with close ties to reliability is that of dependability. The factors that comprise dependability are (Bergman & Klefsjö, 2003): reliability, maintainability and maintenance support. Reliability is as defined above, the ability of a unit to keep operating without failing. The maintainability describes how easy the problems in the unit can be found and fixed. Finally, the maintenance support refers to the availability of a service organisation. Obviously, the worse the reliability is the greater is the need for the other two factors to be satisfactory. For many customers in the truck industry, it is the time that the truck is not available for service that is the greatest problem, rather than the cost of the repairs themselves. Therefore, the concept of dependability is highly relevant for the studied topic.
14
Figure 2: The concepts that constitute dependability. Adapted from Bergman and Klefsjö (2003)
2.3 The customer concept
In the case of the heavy-duty truck industry, the customer concept is multifaceted. There are people who pay for the trucks and there are people who use them; sometimes they are the same, sometimes not. Those who own and drive their own vehicles are commonly referred to as owner/operators, whereas trucks who are owned and driven by different people, in most cases belong to so called fleets. The lion’s share of all trucks are owned by fleets11. For the owner/operators businesses it is easy to know who to ask about satisfaction. In the case of fleets on the other hand, it is hard. Large fleets usually have a high number of drivers, a president of the business, one or several owners of the business, a manager of maintenance etc. In the customer satisfaction studies made for Volvo on the US market, they ask what they call the principle maintainer. What they mean is the person that knows the most about the maintenance of the truck. In the case of fleets, it is usually the Manager of Maintenance or similar. An interesting aspect of this is that it means that in many cases, the one who is asked about his satisfaction with driving experience, repurchase intention etc. is neither the user, nor the owner of the truck. Studies like the ones analysed in this thesis are far reaching and treats multiple areas, such as the sales experience, the truck itself and the workshop experience. Thus, one would like to ask questions to several different people to get the full picture. However, this is probably not possible, due to cost and time of both the survey company and the participating company. It is hard to avoid this problem, but it is something that we must be aware of. If the respondents were chosen among drivers, the driving comfort might be rated as more important than when asking the principle maintainer and if asking the one who purchases trucks, the stated importance of the behaviour of sales staff would probably be increased.
15
The most important person for the manufacturer of trucks is probably the one who makes the purchasing decision. As long as they continue to buy trucks, the manufacturing firm will prosper. Obviously there will be some communication between the one with the purchasing responsibility, the one with the maintenance responsibility, the drivers etc. and therefore we have to assume that the answers from one of them is a relatively good approximation for how the manufacturers products and services are perceived at the customer business. When referring to customers in a general sense in this thesis we most often mean the ones making the purchasing decisions. When referring to surveys, however, we mean the respondents of the survey, assuming that they can give a relatively good view also of the experiences and feelings of the purchasers and drivers.
2.4 Customer satisfaction and loyalty
Juran and Godfrey (1999) defines customer satisfaction as “A state of affairs in which customers feel that their expectations have been met by the product features.”
In the view of Szwarc (2005),
“customer satisfaction is how customers view an organization’s products or services in light of their experiences with that organization (or product), as well as by comparison with what they have heard or seen about other companies or organizations.”
Szwarc (2005) means that while the customer satisfaction is based partly on what they have heard or seen of other companies and products, these impressions of others should be included in customer satisfaction research, something that is very commonly overlooked.
The attention to customer satisfaction grew slowly during the 1960’s and 70’s before accelerating in the 80’s and taking off in the 90’s. Before the 80’s, there was little focus on customer service and customer satisfaction and the discussion was rather about whether customers bought products or if the products were sold to them (Szwarc, 2005). In the 1980’s, people like William E Rothschild of the US General Electric Corporation realised that customer service could not only be a support for business, it could be a strategic advantage. Market research methods started to emerge, increasing the focus on customer satisfaction. (Szwarc, 2005). At the same time, the Japanese got recognition for their efforts towards increased customer satisfaction and lowered costs through keeping defects at a minimum. The
16
efforts of the Japanese had begun already in the 50’s however, inspired by Joseph M. Juran and others (Kondo & Kano, 1998). The awareness of the importance of customer satisfaction was spreading at several fronts, although the driving forces were different in nature in different places. In the 90’s there was a further push forward through the concepts of balanced scorecards and customer relationship management (CRM) (Szwarc, 2005). The balanced scorecards allow managers to take customer satisfaction into consideration as a key indicator of business performance, instead of as traditionally just monitoring financial measurements. CRM made it possible to, through improvements in IT technology, keep records of customer behaviour and thereby customize offers and communication. Today, many corporations have realised the importance of the customers and become customer-centric. When working with improving the satisfaction of our customers, one challenge is how to evaluate it. What methods should be used and what are the important measures.
Bäckman and Olin (1995) state that one should not stay with evaluating customer satisfaction. They mean that a satisfied customer is one whose expectations are met. If the expectations are low, it will not be enough to meet the customer’s expectations. Instead, one needs to incorporate loyalty into the analysis.
When talking about repurchase intentions of customers, there are two terms that commonly appear: loyalty and retention.
“Loyalty is about a customer’s intention or predisposition to buy, but retention is the actual act of buying again. Retention is a stronger measure than loyalty. It can also be measured using internal company data, while loyalty usually has to be measured through market research surveys.”
Johnson and Gustafsson (2000)
An interesting feature about customer satisfaction and loyalty was found by Xerox corporation who, by analysing customer surveys including over 500 000 responses, found that loyalty rates were six times higher for customers who were completely satisfied (5 on a scale from 1 to 5) than for those who were only satisfied (4 on a scale from 1 to 5) (McCarthy 1997, see Szwarc 2005). Szwarc (2005) further elaborates on the results from McCarthy (1997) that satisfaction does not necessarily mean that customers are loyal and will stay with the
17
company. It simply means that they do not have any negative feelings about the company providing the product and they do not have any special reason to leave them.
A significant contribution to the research on customer satisfaction was made by Noriaki Kano, who proposed a way of categorising different types of quality attributes. It was introduced in Kano et al (1984) and has since been discussed by many (see for instance Bergman and Klefsjö, 2003). Following Bergman and Klefsjö, the Kano model is based on three main categories of quality attributes: attractive quality, expected quality and must-be quality. The must-be attributes are things that the customer takes for granted and therefore will not ask for. In the case of a new car today, an air condition system is must-be quality. If the must-be attributes are not there, the customer probably would be very dissatisfied, but if they are, they would not create very high satisfaction.
The second category contains the expected quality attributes. These are things that one knows can differ between products and that one is likely to ask for. If they are there and good, they can create high satisfaction and if they are not there, they will create dissatisfaction. The fuel consumption of a truck could be an example of expected quality. The better it is, the more satisfied you get.
Finally, attractive quality attributes are things that are positive, but that we would not have thought about and therefore not asked for. These attributes are often new technologies or new applications, but they could also be simple product or services. Attractive quality on a modern car could be for instance a USB memory in the key or some new type of compartment, but it could also be a free car cleaning kit or pre-programmed radio stations. The absence of this kind of factors will generally not create dissatisfaction, but having them can create very high satisfaction and they have a great potential of being mentioned to acquaintances of the customer.
The different categories are visualised in Figure, where one can see how the satisfaction depends on the degree of fulfilment for the different categories.
18
Figure 3: The Kano model. Adapted from Bergman and Klefsjö (2003).
Ideas originally proposed by Kano (1984)
2.5 Brand image
First of all, what is a brand? The concept is not very easily defined and most efforts to define it end up with some list of key elements or some general sentence that still does not say very much. I believe that Niall Fitzgerald, chairman of Unilever hit the spot when she said that a brand is “a storehouse of trust” (Kotler, 2003). I find it particularly accurate for the truck industry, where productivity is of very high priority and it is important to be able to trust that the truck will provide you with service as intended and not brake down. By staying with a brand that has proved itself before, the owners can minimise the risk of unexpected problems. The concept of image can be seen in several ways and there are many concepts that fall close to it in our reference frame (such as reputation and impression). Marconi (2001) means that reputation and image are two different things. Image, he explains is a perception of a company or a product that a customer can acquire quite fast. Through heavy advertising, a highly promoted event, or a primetime appearance, one can deliver a message that creates an
19
image among customers. A reputation, on the other hand, Marconi claims, can not be achieved solely through advertising and it takes a long time to foster. When it comes to destroying a reputation, however, the situation is different. Even a reputation that has been built up through a century of persistent efforts and good performance, can be reduced to nothing instantly (Marconi, 2001). There seems to be no general agreement with Marconi’s differentiation between image and reputation; rather, image is commonly used to describe what Marconi defines as reputation. In this thesis, we choose not to separate the two, but let us remember the point that a brand image (reputation) can be destroyed instantly, a point that is well publicly accepted.
There seems to be a trend towards trying to appeal the hearts of the customers instead of their heads (see for instance Kotler, 2003 and Gobe, 2001). Kotler (2003) means that the traditional benefit marketing, such as saying that “Volvo is the safest car” have played out their role. He means that the competition has more or less caught up with the brands that used to be much better than others in some aspect. The new thing is to create feelings about a brand and sell it as a feeling or a lifestyle rather than just a product. We believe that this observation is correct when it comes to consumer (B2C) marketing, but maybe not for Business-to-business (B2B) marketing. For the large truck fleets the purchases of new trucks are made by purchasing professionals and it seems likely that they are still appealed by promises about benefits, such as good reliability, low fuel consumption etc. However, for the owner/operators, especially in the cases where the owner of the truck sleeps regularly in the truck and spends most of his/her time on the roads, the truck manufacturer might be better of marketing the truck more through feelings and the lifestyle the brand can be associated with. We will get some input on this issue through the interviews carried out with fleet managers.
2.6 Priorities of truck customers
In an analysis made in a Master´s Thesis at Scania Trucks (Ivarsson & Johansson, 1996), one can see how Scania customers in Sweden rate different factors associated with problems and their resolution. The questions were asked through a questionnaire that was sent to 200 customers in 1995. As a part of the questionnaire, the customers were asked to rate six factors where a 1 is appointed to the most important factor and a 6 to the least important factor. 90 customers responded to that specific question. The mean ratings and the 95% confidence intervals for these factors are presented in Table. The presented means are estimations of the mean of the entire population for which the sample is expected to be representative, i.e.
20
Swedish owners of Scania trucks of type R143 and with axle configuration 6x2, running in long haul traffic. The confidence interval describes the interval in which we can expect the true mean of the population to lie if the customers in the sample are randomly picked from the population we want to analyse.
Table 1: The priorities of Scania R143 customers (Ivarsson & Johansson, 1996). The
factors are translated from Swedish. For the factors in Swedish, please refer to Appendix 7
Factor Mean 95% confidence interval of mean
Few breakdowns 1.99 1.73-2.24
Few repairs 2.61 2.40-2.83
Durable components 2.92 2.62-3.23 Low repair costs 3.32 3.00-3.64 Easy to repair 4.77 4.57-4.96 Easy to locate problems 5.39 5.16-5.61
21
2.7 The impact of quality on business importance
Several previous studies are concerned with the relation between quality and business performance. Curkovic (2000), provides an empirical study of suppliers to the three large American car manufacturers: GM, Ford and Chrysler. Through principal components factor analysis he first groups quality attributes into core factors. Founded on his empirical results as well as previous research he presents two core factors: product quality and service quality. Product quality incorporates four sub-factors, namely design quality, conformance to specifications, product reliability and product durability. Among these factors, product reliability and product durability are found to be the main contributors to the impact of the core factor product quality on business performance. Service quality consists of pre-sale customer service, post-sale customer support and responsiveness to customers. Both product quality and service quality are found to be positive contributors to business performance. This is shown for asset based (Return on assets pre- and post-tax ) and investment based measures (Return on Investments pre- and post-tax) as well as market share based measures. Whereas the significant relations with market share measures seem to suggest that quality generally increases market share, the investment and asset based measures furthermore suggest that there are not costs incurred by quality efforts that substantially offset the gains produced by quality. These empirical results support the classic quality ideas that quality does not have a net cost, but rather improve financial performance.
In a study of many different industries, Buzzell and Wiersema (1981) looks at the association between change in market share and different potential causes. Results include, for industrial products, a correlation of 0.2 between change in quality and change in market share. Under the hypothesis that the true value of the correlation coefficient is zero, the probability of yielding this sample estimate of the correlation coefficient is calculated to be 1% suggesting that the association between market share change and quality change is significant.
I want to raise a warning flag though for being to confident that these results actually do anything more than suggest the mentioned implications. That there is a strong relation between quality and business performance does not prove that it is quality that is the cause and business performance that is the effect. There might be, to varying extents in different cases, an effect that firms that perform well have enough resources to produce high quality items. This reasoning does not mean that I do not believe that quality has a net cost, but
22
building up competence, using better components, developing better processes etc. might require an investment. I believe that the results of these studies are indicative and to a high extent representative although the methodologies used limit the reliability of the results.
2.8 Optimal reliability
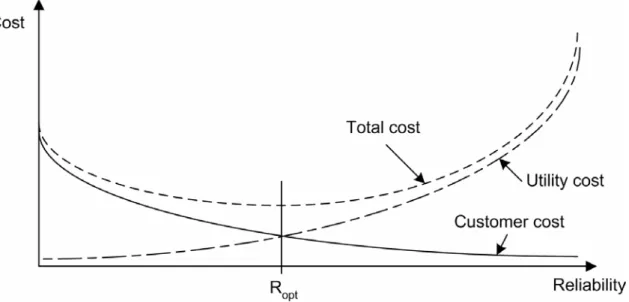
Improving reliability generally improves customer satisfaction, but whether efforts to improve reliability will improve the profitability of a manufacturer or service provider depends on the relation between costs of the efforts and the financial benefits of them. This relation is discussed by Chowdhury et al (2004), who build their reasoning on a graph, Figure 42, showing costs for the manufacturer or service provider and the customers respectively.
Figure 42: Reliability cost/reliability worth concept. Adopted from Chowdhury et al (2004)
The line referred to as customer cost shows how the cost for the customer that is incurred by failures depends on the reliability. The utility cost represents costs that are assumed to be necessary in order to achieve different reliability levels. The total cost is the sum of the two costs and according to Chowdhury et al (2004), this sum is what we need to minimize. The reliability corresponding to the minimum of the total cost is considered to be optimal reliability, marked in the figure as Ropt. The utility costs of different efforts are relatively easy
to calculate. It is harder to know in advance how much they will improve reliability. Therefore, the relation between utility cost and reliability is anything but easy to estimate before the efforts are done and one can study the effects. While the model is concerned with how to find optimal reliability, one needs to estimate these connections before taking the decision whether to implement an effort. In order to estimate the customer costs we need to
23
survey the customers and ask them to estimate their costs due to failures in product or service (Chowdhury et al, 2004 and Sullivan et al, 1996)).
This approach can be a good starting point when discussing optimal reliability. In order to fully understand what reliability that would be optimal for a specific product however, there are many factors that need to be investigated. This will only briefly be discussed in the general discussion section of the final report.
2.9 Durability and economic life
Durability is a quality dimension which I believe most people have a similar view of, but which is hard to formally define and therefore can be defined in many different ways. O’Connor (2001) defines durability as an item’s ability to “withstand wear out mechanisms, such as fatigue, wear, etc”. For non-repairable products this view gives a simple and convenient approach.
When looking at repairable products, the situation becomes more complex. Garvin (1984), defines durability for repairable products as “…the amount of use one gets from a product before it breaks down and replacement is regarded as preferable to continued repair.” This view implies that the durability is to some extent based on decisions made by the user. The decision whether to repair a product or to buy a new one would, Garvin elaborates, be based on such factors as repair costs, personal valuations of time and inconvenience, downtime losses and relative prices. Taking the decisions made by the user into consideration, as Garvin does, is in my opinion very relevant. We must be aware that the period during which a product will be used is limited not only by technical aspects.
I find it necessary to use two different properties, one which I refer to as durability and one which I call economic life. I define economic life to facilitate my analysis of external factors that affect the choice regarding when to replace trucks. For practical reasons, I use the Volvo definition of durability, a definition from 2004 that has been agreed upon by Volvo 3P, Volvo Powertrain, Volvo Truck Corporation and Renault Trucks. This definition is specific for trucks and would need to be adjusted to be applicable also for other products.
24
Durability is the products ability to perform its required function under stated conditions of use, and under stated conditions of maintenance, until the failure of a component, which has a significant cost compared to the expected residual truck value, and which needs to be overhauled12 or replaced.
Economic life is the period during which it is considered attractive, according to the owner’s business conditions, to have the product in use.
The customer I refer to is the one who pays for the usage of the truck, whether it is a purchase or a lease. For a private customer the attractiveness can be decided by such factors as comfort, fuel consumption, if the customer feels proud of the truck etc. For commercial customers however, who comprise the lion’s share of the truck market, the truck is a tool used for providing services that generate revenue. For them the economic life will be decided largely by the ability of the product to provide service at a profitability level that is competitive with the main alternative which is buying a newer truck. When it is considered smarter to replace it, the product most often still has a value, at least a selvage value, but the economic life is considered to be over.
The difference between the durability and economic life, in my view, is that durability defines how much use one can get until the cost of getting the truck running is substantial compared to the residual value, while economic life is how much use the an owner gets before he considers it to be better to replace it. Taking the decision to replace it does not necessarily require that it needs to be repaired. For instance, if a product becomes technologically obsolete, because there is a rapid technological development of new products, the product does not become less durable but its economic life might be shortened. Likewise, if you need to pay some fee to use an old product (for instant road tolls), that product does not become less durable, but its economic life is reduced. This view of these attributes implies that durability is largely technical. Economic life on the other hand is unique for each market, segment etc, while they all have different conditions. A product like a truck usually have
25
several users and owners and both needs and wants of the owners and users might vary greatly between different countries, conditions of use etc. When one user decides that it is not profitable to keep using the truck, there is often another user with other needs or a different business model that is willing to buy the truck. I therefore choose to view economic life as a property based on the circumstances each customer act within. Many potential limitations of economic life such as regulatory environment and needs of reliability are different between markets and segments, but often relatively homogenous within them. Thus, when the economic life is over in one market or segment, it may continue in another.
For a product like a truck, built up by a large number of components, it is a matter of interpretation what makes the truck to be “worn out”. If some small and cheap components fail, they can probably be replaced and the truck must not necessarily be taken out of use. If we only need to make small repairs to keep the truck in service for a long time, the truck can be considered as quite durable. However, if we make big repairs, we need to start thinking about whether it really is the same truck as before. If we always change the components that break without any limitations, the truck will of course always be able to provide service. In order to measure durability of trucks we usually measure something like the “technical life” of the truck. We define some unit that we measure it in, for trucks the number of kilometres travelled seems most appropriate. We also need to define clearly what repairs we allow before we consider the “technical life” to be over.
26
Figure 5: An example of a lifetime percentile curve
At Volvo Powertrain the durability of for instance an engine type is generally measured as a mileage at which a certain percentage of the engines in some population have failed. The measure can be applied also on a component level and it is stated as for instance L10 =
800 000 km, meaning that 10% of the units will fail before 800 000 km. Currently there are 12 components for the engine that are defined as “durability components”. The components are based on the criteria that they should either demand a so called major overhaul or have a repair cost exceeding a certain amount. When at least one of these components fails, there is a durability failure and the current mileage is our durability measurement. While also a large number of small failures together can create high total repair costs for the customer and thereby cause the customer to sell the truck earlier than planned, there is currently a discussion in the company about having a durability definition that takes total repair cost into consideration.
2.9.1 Classic durability economics theory
Much of the early research that was done on economical aspects of quality was concerned with product durability and its impact on the profitability of manufacturing companies. However, most of it focused on the question of what durability a manufacturer should have in order to maximise profits in a monopolists market (see for instance Kleinman and Ophir, 1966, Swan, 1970).
27
Some models have also been made to explore optimal durability in a perfect market. Kleinman and Ophir (1966) conclude that an increased interest rate will decrease optimal durability but that the demand of service from the products has no effect on it. These results are though somewhat shadowed by the fact that Swan (1970) proved some assumptions and thereby conclusions in the article to be wrong.
A general feature of the research on durable goods theory is that it so far consists of numerous models, whose assumptions are often arguable and which limit the validity and applicability of the conclusions severely. One of these assumptions (employed in Swan, 1970 and Sieper and Swan, 1973 and criticised by Avinger, 1981 and Waldman, 2003) is that units of service are perfect substitutes in consumption irrespective of the age or durability of the product supplying the services. One can easily see how there could be a difference between the service supplied by a brand new truck and that of an old one. Driving comfort, safety, reliability and fuel consumption are only a few important aspects that could be age-dependent.
Planned obsolescence
One way to create planned obsolescence is to frequently introduce changes in style that increases the difference between new and used trucks (Waldman, 2003). With a bigger difference it is easier to increase the price of new units without having the old ones as competition that is limiting the price.
Adverse selection
The concept of adverse selection applied on the automobile second hand market was described in Akerlof (1970). It is founded on the assumption that there will always be an asymmetry in information when a used product is sold, meaning that the seller has more knowledge about the quality of the individual car than the buyer does. If we assume that the buyer only knows something about the group of cars defined by model, production year etc, this is what will define the price. The consequence is that the sellers that own cars with lower quality than the group average will have the most benefit from selling. The owners of cars with over average quality on the other hand have little incentive to sell while they probably will not be able to get a price reflecting the high quality. The essence of this market mechanism is thus that the majority of the second hand market turnover will consist of cars of relatively low quality and the asymmetric information will overall reduce the activity of the
28
second hand market. The adverse selection, it should be noted, is not as applicable when there are warranties defining a minimum quality level. After the warranty period however, the mechanism is applicable as long as the buyer can not have as much knowledge as the seller about the individual item for sale.
If adverse selection is highly present, then the second hand market will be constrained, leading to a lower pricing of used cars (Hendel and Lizzeri, 1999). A lower second hand price and lower second hand market turnover will naturally effect sales of new goods, but the effect on the new car price from adverse selection is not absolutely clear. The lowered second hand price affects the new good price negatively, while it increases the cost of ownership for the buyer of the new car. On the other hand, a lower quality of the second hand market makes the used cars less substitutable for new ones which allows for higher pricing of new cars (Hendel and Lizzeri, 1999).
2.9.2 Potential implications of durability on business
The most relevant previous work that I have found on this topic is an article by Saleh et al (2006). In his article, Saleh discusses the issue of optimal durability from three different perspectives: the customer, the manufacturer and the society at large. For each interest party he lists a number of things that might be affected by the durability of a system and whether he considers it to be mainly positive or negative for that party. Saleh uses the case of a spacecraft as an example but the ideas are meant to be applicable in a more general sense. I have studied each of the proposed potential consequences of a change of durability and judged whether it may be relevant also for the case of heavy-duty trucks. While most of the consequences of extending the lifetime are reverse when shortening it, I am assigning consequences only to extending the design lifetime. In my view, these potential consequences depend on the actual durability rather than the design lifetime, but the expected value of the durability is the same as the design lifetime.
Potential implications to an extended design lifetime proposed by Saleh that I judge as relevant for trucks can be found in Table.
29
Table 2: Potential consequences of an extended design lifetime (A=Advantage, D=Disadvantage)
Customer’s perspective Manufacturer’s perspective
A: Smaller volume of purchasing D: Lower sales volumes D: Increased risk of technological or
commercial obsoleteness
A: Lower demand for the company to be technically up-to-date and attentive to the voice of the customer D: Longer technology generations,
slowing down improvements of technology based on feedback from customers13
D: Longer technology generations, slowing down improvements of technology based on feedback from customers14
A: Potentially smaller cost per operational day.
A: More opportunities for revenues from services.
D: Extended warranty needed
A: High durability magnifies
reliability as a competitive advantages
I believe that most of these ideas are correct in a general sense. When applied to trucks though, it becomes a little more complex and requires further discussion and unfortunately a lot of information is needed to allow us to judge whether the above stated implications and other potential implications that I will present really apply. A simplified model of how I have come to view the issue of driveline durability is shown in the results section, while it is essentially conclusions based on internal interviews and general industry knowledge, although the ideas of Saleh (2006) are an integral part of the foundation.
13 Saleh mentions as an advantageous effect of shortening the design lifetime that there are more frequent iterations of getting products to the market, getting feedback from customers and solving issues before an improved product is put to the market. It seems reasonable to assume that this would translate to the opposite if the design lifetime is extended.
30
3 Methodology
3.1 Methodological considerations
The methods that are used for answering each research question are presented below.
3.1.1 Research question 1 (RQ1)
What market research measures of reliability available to the Volvo Group have the largest explanatory power for the customer satisfaction with reliability?
Secondary data from customer surveys is analysed comparing different brands as well as different years. Regression analysis is employed.
The surveys are purchased by Volvo from external suppliers and the data is considered to be internal information. Volvo has committed not to use the results for external communication. For this reason, no brand names are disclosed in connection to results from these surveys. Neither are the suppliers mentioned by name.
For the US market we have used data from a survey that covers eight brands in annual studies during the years 2002-2006.
The survey of the Western European15 markets covers seven brands in annual studies carried
out during the years 2000-2007.
The trucks that the data is confined to is, for the US, Heavy Duty Trucks, more specifically Class 8 vehicles, i.e. less than five-axle tractor16/single trailer for medium-haul delivery17. The vehicles are of model year two years prior to the year that the survey is carried out. For
15 For some years, the European study covers also some countries in Eastern Europe. To be able to track markets over time, we have only included countries that are covered all years. Thereby, the results we have used are only valid for Western Europe.
16 See Appendix 1: Abbreviations and Key for a verbal description of a tractor truck and Appendix 3: Basic types of trucks and trailers for a picture.
17 US Department of Transportation. FHWA Vehicle Classes (Electronic).