行政院國家科學委員會專題研究計畫 成果報告
燃燒化學中重要自由基之反應動力學研究(II)
研究成果報告(精簡版)
計 畫 類 別 : 個別型
計 畫 編 號 : NSC 99-2113-M-009-014-
執 行 期 間 : 99 年 08 月 01 日至 100 年 10 月 31 日
執 行 單 位 : 國立交通大學應用化學系(所)
計 畫 主 持 人 : 王念夏
計畫參與人員: 碩士班研究生-兼任助理人員:李佩芳
碩士班研究生-兼任助理人員:李哲昀
大專生-兼任助理人員:吳麗評
公 開 資 訊 : 本計畫可公開查詢
中 華 民 國 101 年 01 月 31 日
中 文 摘 要 : 我們使用衝擊波管-原子共振螢光技術在 1700-2000K 高溫範
圍研究亞甲基(CH2)與氫氣反應動力學,除成功地量得單態態
亞甲基之速率常數為 = (1.27 ± 0.36) ×10-10 cm3
molecule-1 s-1。同時也測得二碘甲烷分解之動力學資
訊:CH2I2 + Ar → CH2I + I + Ar (1a)及 CH2I + Ar →
3CH2 + I + Ar (1b)。反應(1a)極快而(1b)為速率決定步
驟:Ln (k1b/cm3 molecule-1 s-1) = -(17.28 ± 0.79 ) –
(30.17 ± 1.40)×103/T.研究成果已投稿至 J. Phys. Chem.
A,也被接受(JPCA, Just Accepted, 01/20/2012)
中文關鍵詞: 亞甲基,氫氣,二碘甲烷,反應動力學,衝擊波管
英 文 摘 要 :
Study on The Reaction of CH
2with H
2at High Temperature
Pei-Fang Lee, Hiroyuki Matsui*, and Niann-Shiah Wang*
Department of Applied Chemistry, National Chiao Tung University, 1001,
Ta Hsueh Road, Hsinchu 30010, Taiwan
*Corresponding author: Niann-Shiah Wang: [email protected] Hiroyuki [email protected]
Abstract
Thermal decomposition of CH2I2[sequential C-I bond fission processes, CH2I2+ Ar
→ CH2I + I + Ar (1a) and CH2I + Ar → 3CH2+ I + Ar (1b)], and the reactions of3CH2+
H2 → CH3 + H (2) and 1CH2 + H2 → CH3 + H (3) have been studied by using atomic
resonance absorption spectrometry (ARAS) of I and H atoms behind reflected shock waves. Highly diluted CH2I2(0.1 - 0.4 ppm) with/without excess H2(300 ppm) in Ar has
been used so that the effect of the secondary reactions can be minimized. From the quantitative measurement of I atoms in the 0.1 ppm CH2I2+Ar mixture over 1550-2010
K, it is confirmed that two-step sequential C–I bond fission processes of CH2I2, (1a) and
(1b) dominate over other product channels. Decomposition step (1b) is confirmed to be the rate determining process to produce 3CH2 and the least-squares analysis of the
measured rate gives, Ln (k1b/cm3molecule-1s-1) = -(17.28 ± 0.79 ) –(30.17 ± 1.40)×103/T.
By utilizing this result, reactions (2) and (3) are examined by monitoring evolution of H atoms in the 0.2 - 0.4 ppm CH2I2+ 300 ppm H2mixtures over 1850 - 2040 K. By using a
theoretical result on k2(Lu, K. W.; Matsui, H.; Huang, C.-L.; Raghunath, P.; Wang,
N.-S.; Lin, M. C.,J. Phys. Chem. A, 2010, 114, 5493), the rate for (3) is determined as
k3/cm3molecule-1s-1= (1.27 ± 0.36) ×10-10. The upper limit ofk3(k3max) is also evaluated
by assuming k2= 0, i.e., k3max/cm3molecule-1s-1 = (2.26 ± 0.59) ×10-10. The present
experimental results on k3and k3max is found to agree very well with the previous
frequency modulation spectroscopy study (Friedrichs, G.; Wagner, H. Gg.Z. Phys. Chem.
2001, 215, 1601), i.e., the importance of the contribution of1CH2in the reaction of CH2
1. Introduction
The methylene radical, CH2 (
X
~
3B1 anda
~
1A1, represented as 3CH2 and 1CH2,respectively) is regarded as an important reaction intermediate in hydrocarbon combustion. In the standard combustion conditions, CH2radicals are supplied mostly in
the secondary reactions such as CH3 + OH → 1CH2 + H2O and sequential collisional
quenching 1CH2 + M → 3CH2 + M,1-3 therefore, higher the concentration of fuel
species, the importance of the role of CH2increases. Also, it is indicated that1CH2is a
direct product in the thermal decomposition of CH3OH.2,3In this case, CH2radical plays
an important role in the initial stage of the chain branching processes even if concentration of CH3OH is low.
Detection of CH2 radical has been tried by using various techniques (LMR
spectrometers, mass spectrometers, infrared diode laser absorption for3CH2, and LIF
and others for 1CH2); a large amount of information about the rate constants and
reaction mechanism of CH2 radical have been accumulated at low temperature
range.4-21 Also, shock tube works combined with ARAS (atomic resonance absorption
spectrometry) and the frequency modulation spectroscopy have been conducted to explore the CH2reactions above 1000 K.22-25, 36
Main issue of this study is to obtain reliable kinetic information by monitoring evolution of H atoms produced in the reaction of CH2+ H2at high temperature range.
Highly sensitive detection of H atoms (1×10¹¹/cm3) of this study would be efficient to
reduce the effects of the side reactions. In addition, excellent reproducibility of the experimental condition in this shock tube system enables comparative measurement to confirm the concentration of the minor component in the sample mixture, as well as to examine the contributions of the background H atoms.
In most of the previous experimental studies, photolysis or thermal decomposition of CH2CO has been used as a source of supplying CH2. As CH2CO is relatively stable
below 2000 K, it is also the issue of the present study to search a clean source of producing CH2radical at lower temperature range. Therefore, this study is divided into
two main experimental parts. In the first part, evolution of I atoms has been monitored by using VUV absorption at 178.3nm in the mixture of 0.1 ppm CH2I2+ Ar over 1550 –
2010 K to examine the thermal decomposition process (1), i.e.,
CH2I2+ Ar → CH2I + I + Ar (1a)
CH2I + Ar → 3CH2+ I + Ar (1b).
By using the result of thermal decomposition of CH2I2, the reaction of CH2radical
with H2, the reactions
3CH2+ H2→ CH3+ H (2)
and
1CH2+ H2→ CH3+ H (3)
have been examined by monitoring H atoms. Even though 3CH2is expected to be the
main products in (1b), it is important to take into account (3) at elevated temperature condition, as the collisional energy transfer between1CH2and3CH2, (4) is very fast;
1CH2+ M =3CH2+ M (4).
2. Experimental System
Experimental study has been conducted behind reflected shock waves in a diaphragmless shock tube apparatus (length 5.9 m and i.d. 7.6 cm). Details of experiments were described in previous studies.26,27 An atomic resonance absorption
spectrometry (ARAS) detection system has been used for the measurements of temporal profiles of [I] and [H], i.e., resonant atomic absorption of I atoms at 178.3nm (corresponding to transition2P1,3/2-2P0,3/2) and that of H atoms at 121.6nm is monitored
by using a microwave-discharge lamp filtered with a vacuum UV (VUV) monochromator and detected by a solar-blind photomultiplier tube (PMT). Gas mixture of about 1 % I2
and H2 diluted in He of 10 Torr is supplied in the microwave-discharge lamp. VUV
light passes perpendicularly through the MgF2windows at 4 cm upstream of the end
plate of the shock tube. In the measurement of I atoms, solid iodine pellet cooled at 281 K is used to supply I2. Calibration curves for H and I atoms have been constructed by
using decomposition of C2H5I,
and sequential decomposition of C2H5,
C2H5 →C2H4+ H.
Attention has been paid in the optical alignment to keep the sensitivity to be optimized; detection limit of 1011 atom/cm3 for I and H atoms has been attained. In
compensation for the achievement of high sensitivity, the resolution time of the detection is not sufficiently short for the measurements of very rapid reaction phenomena. By monitoring evolutions of I and H atoms in the thermal decomposition of C2H5I at 1900 - 2000 K and 2 atm., the response time of the detection system is
measured to be about 25μs.
However, the reliability of the observed evolutions of the signal intensities can be sufficiently retained (except for the initial 25μs) if proper experimental conditions have been chosen; this is confirmed by analyzing evolutions of H atoms in the reaction of H + O2between 1700 –2000 K in the mixtures of 0.2 - 0.4 ppm C2H5I + 300 - 500 ppm O2.
Present experiment is conducted at very low concentration of sample mixtures, 0.1 - 0.4 ppm CH2I2(and +300 ppm H2) diluted in Ar so as to reduce the influence of the side
reactions, however, the sample mixtures are prepared simply by the measurement of pressure by using combination of Baratron pressure gauges.
He (99.9995%, AGA Specialty Gases) and Ar (99.9995%, AGA Specialty Gases), H2
(99.9995%, AGA Specialty Gases) are used without further purification. CH2I2 (99%,
Sigma-Aldrich, Reagent Plus grade) and C2H5I (99%, Sigma-Aldrich, Reagent Plus
grade) are purified by repeating degassing by successive freezing and pumping cycles.
3. Results and Discussions
3.1 Thermal decomposition of CH
2I
2Almost no kinetic information is available in the past literatures for CH2I2
decomposition. In the study on thermal decomposition of CH2I2, evolution of I atoms in
the 0.1 ppm CH2I2in Ar is monitored behind reflected shock waves over 1550 - 2010 K.
Examples of the observed profile of [I] are demonstrated in Figure 1. As clearly shown, it is indicated that sequential two decomposition steps of C-I bond fission dominate over other product channels since it is shown at high temperature that [I]∞/[CH2I2]0 = 2
(where, [I]∞ and [CH2I2]0 denote the concentrations of final iodine atoms and initial
CH2I2, respectively). Also, the first decomposition step, CH2I2+ Ar → CH2I + I + Ar (1a)
is found to be very fast, in comparison with the second step, CH2I + Ar → 3CH2+ I + Ar
(1b), exhibiting that the reaction intermediate CH2I is stable even in the relatively high
temperature range (T > 1500 K).
For the sequential decomposition of CH2I2, the profile of concentration of I atoms is
analytically given by,
[I]/[CH2I2]0= [1 –exp(-R1t)] + F1[1 –exp(-R1t)] + F2[1 –exp(-R2t)] (I)
where, R1=k1a(Ar), R2=k1b(Ar), F1= R2/(R2-R1), and F2= R1/(R1–R2). Since R1>>R2, the
simple equation (III) is available in the analysis of the present experimental result, [I]/[CH2I2]0= [1 –exp(-R1t)] + [1 –exp(-R2t)]. (II)
The observed initial rise rate of [I] is found to be too fast to evaluate k1a in the
temperature range above 1500 K. From the profile of I atoms in the range 1 < [I]/[CH2I2]0< 2, the rate of (1b) was evaluated by using an estimated rate for R1 into
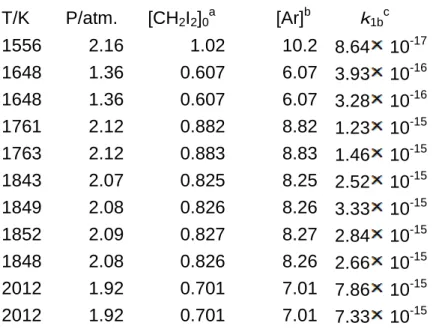
equation (II)28and the result is summarized in Table 1 as well as in Figure 2. Linear
least-squares analysis of the data on k1bgives,
Ln (k1b/cm3molecule-1s-1) = -(17.28 ± 0.79 ) –(30.17 ± 1.40)×103/T (III).
over the temperature range of T = 1500 –2000 K.
The heat of reaction is estimated as H0298 = 51.5 kcal mol-1 and H0298 = 64.4
kcal mol-1 for (1a) and (1b), respectively, based on the recent experimental data on the
heat of formation of CH2I and the C –H bond fission energy.29 The heat of reaction for
other possible 3-centered reactions such as, CH2I2+ M → CHI + HI + M,CH2I2+ M → 1,3CH2+ I2+ M, and CH2I + M → CH + HI + M,is estimated asH0298= 72.5 kcal mol-1,
79.1 kcal mol-1 (for the spin - forbidden 3CH2 formation), and 93.9 kcal mol-1,
respectively.30-33 Therefore, dominance of (1) over other channels, as well as two-steps
production behavior of I atoms observed in this study can be justified thermodynamically. The observed activation energy of 60 kcal/mol for (1b) seems to be consistent with the endothermicity of the reaction.
CH2I2is confirmed to be a clean and better source for supplying3CH2than CH2CO
lower limit for the purpose of quick supply. As (1b) is the rate determining step to produce3CH2, the result (III) is used as the production rate for3CH2in the analysis in
the CH2 + H2 reaction in the following section. More detailed study on thermal
decomposition of CH2I2is now under way and will be presented elsewhere.34
3.2 Reaction of CH
2with H
2Evolution of [H] in the mixtures of 0.2 - 0.4 ppm CH2I2 + 300 ppm H2 in Ar is
monitored over 1850 - 2040 K. In conducting an experiment with very low concentration of sample gas such as employed in this study, it is especially important to examine the validity of the prepared concentration of minor component, as well as to confirm that the reaction system is free from the effect of impurities: these requirements may not be generally so easy to achieve when the concentration of sample gas is extremely low. As described above, validity of the nominal concentration of CH2I2 prepared by pressure
measurement has been confirmed here (since the measured yield of I atoms is equal to 2 times of the nominal concentration of CH2I2for T >1800 K). In addition, measurement
of [H] in the CH2I2 + (excess H2), as described below is useful to confirm this. These
evidences ensure that the loss of CH2I2 should be negligible even for such low
concentration samples.
The experimental condition of the present study is summarized in Table 2. All the data shown in the table are the averages of 2 data points conducted at the same shock wave condition; shot-by-shot fluctuation of the temperature shown in this table is less than ± 5 K. Averaged values are shown for T and P. Repetition of the measurement at the same condition is useful to improve the S/N ratio (by signal averaging), as well as to confirm that reasonable reproducibility of the profiles of H atoms has been attained.
Also all the data shown in Table 2 are associated with blank tests using pure Ar and 300 ppm H2+ Ar (both sample mixtures are prepared in the same condition with
the mixture of 0.2 - 0.4 ppm CH2I2 + 300 ppm H2 + Ar) to confirm that H atom is not
supplied by impurities in Ar, H2nor the shock tube wall. Background H atom produced
in the pure Ar sample was confirmed to be below the detection limit (1 × 10¹¹
atom/cm3) in all the experimental conditions, but small amount of H atom production is observed (up to 5 × 10¹¹
atom/cm3) in the 300 ppm H2+ Ar mixture at the highest temperature of this
study: this is not from the impurities but it can be attributed to thermal decomposition of H2.1,35
An example of the observed profile of H atom produced in the mixtures of 0.2 ppm CH2I2+ 300 ppm H2is shown in Figure 3-A.
Numerical simulations has been conducted to analyze the reaction rates of (2) and (3): however, it is practically impossible to evaluatek2 andk3independently, since the
collisional energy transfer from 3CH2 to 1CH2 (-4) is very fast and quasi-equilibrium
between the two electronic states of CH2is maintained; two kinds of analyses have been
tried in this study to estimatek3by assuming the magnitude ofk2, as described below.
The first approach of the analysis onk3here is to employ the result of theoretical
calculation (ab initio molecular orbital and transition state theory, including Eckert correction) for the reaction (2) expressed as,27
k2/ cm3molecule-1sec-1= 7.32 x 10⁻¹⁹T2.3exp(-3,699/T), T = 200 - 3000 K (IV).
Using (IV) may be justified by the fact that (IV) agrees very well with the semi-empirical data on k2 based on the measurement of Gesser and Steacie12 for the
relative rate constant for the reaction of3CH2with H2(2) against, 3CH2+ CH2CO → 3C2H4+ CO (reference reaction)
combined with computed rate constant for3CH2+ CH2CO27for the temperature range of
230 - 370 K.
By using a reaction scheme shown in Table 3, fitting the numerical simulation to the observed profile was conducted for the evolution of H atoms in the range of initial fast rise for t = 25 –150 μs, where, profile of H atoms is sensitive to the reactions3CH2
+ H2→ CH3+ H (2) and 1CH2+ H2→ CH3+ H (3). The optimized solutions fork3which
give the best fit to the experimental profiles are summarized in Table 3, and an example is shown by the red solid curve in Figure 3-A.
The second approach of the present analysis is the limiting case evaluating the upper limit ofk3, i.e.,k3max, with an assumptionk2= 0. As shown by the black circle in
Figure 3-A, it is possible to achieve good agreement of the numerical simulation to the experimental profile of H atoms even for neglecting the contribution of (2). The results of the analyses onk3maxare summarized also in Table 3.
An example of the computed sensitivity coefficients (non-dimensional) are shown in Figure 3-B. Contributions of the reactions in Table 3 other than (1) - (6) are in fact negligibly small, as the concentration of CH2I2 used in this study is very low.
is significant at the initial stage of the reaction, CH3+ H2→ CH4+ H2(5) dominates for
large t, and the reaction (6) has some sensitivity at high temperature range, T > 2000 K, nevertheless, it is demonstrated that (2) and (3) are sufficiently sensitive to evaluate kinetic rate constant. It is also worthwhile to mention that the numerical simulation can reproduce very well the observed profile of H atoms with using the nominal value of the initial concentration of CH2I2for all the experimental data; computation to estimate
the accuracy for [CH2I2]0has been also performed and the nominal value is concluded to
be reliable with ± 10 % error limit.
The present experimental result for (3) by employing theoretical result for k2can
be expressed as,
k3/cm3molecule-1s-1= (1.27 ± 0.36) ×10-10. (V)
and the upper limit ofk3(k3max) by assumingk2= 0 can be expressed as,
k3max/cm3molecule-1s-1= (2.26 ± 0.59) ×10-10., (VI)
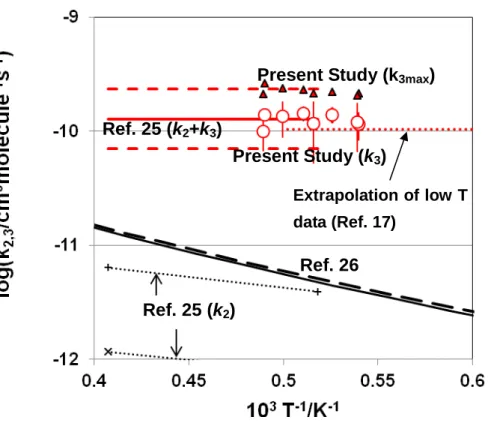
for the temperature range of T = 1850 - 2050 K, here, the error limit is given by 2. The result of the present study onk3is compared with previous works onk2andk3
in Figure 4-A (summary of the data for a wide temperature range), and in Figure 4-B (high temperature data includingk3max).
As shown in Figure 4-A and 4-B, the rate for (3) evaluated in this study is found to agree very well with that of previous shock tube work15, as well as with the
experimental works below 1000 K.17-20 Agreement of the high temperature data onk3
with the experimental result by Gannon et al. conducted between 195 –798 K17implies
that k3 shows almost no temperature dependence. Although the result by Friedrichs
and Wagner25was indicated to bek2+k3, it should be approximately equal to k3, since
the contribution ofk2 is indicated to be minor. Their estimated upper limit fork2+k3
also agrees very well withk3maxof this study.
As for reaction (2), it is difficult to examine k2 precisely only from the present
experimental information. The results on k2evaluated by Friedrichs and Wagner25are
also shown in Figure 4, but it seems difficult to extract reliable estimate because it should be very sensitive to the uncertainty of the magnitude of measuredk3.
The main conclusion of this study, in agreement with Friedrichs and Wagner,25is
that the importance of1CH2in the reaction of CH2+ H2 has been confirmed, i.e., the
to1CH2if the reaction rate of3CH2is not extremely large. The same scenario may hold
for the reactions of CH2with other molecules. Gannon et al.17demonstrated in the study
of 1CH2 + D2 reaction that an insertion reaction can be competitive to the direct
abstraction reaction, since they confirmed that 2/3 of the products of this reaction was H atom. For the molecules other than H2, insertion reaction can still be a part of the main
channels for the thermal reactions of CH2at elevated temperature. Examination of the
relative contributions of 3CH2 and 1CH2 in many of the key reactions in combustion
system seems to be still a challenging task. Acknowledgement
This work was supported by National Science Council of Taiwan under grant no. NSC 99-2113-M-009-014. HM deeply acknowledges the supports by NSC and National Chiao Tung University for a distinguished visiting professorship.
References
1. Smith, G. P.; Golden, D. M.; Frenklach, M.; Moriarty, N. W.; Eiteneer, B.; Goldenberg, M.; Bowman, C. T.; Hanson, R. K.; Song, S.; Gardiner, et al. http://www.me.berkeley.edu/gri mech.
2. Xia, W. S.; Zhu, R. S.; Lin, M. C.; Mebel, A. M.Faraday Discuss.2002, 119, 191-205.
3. Srinivasan, N. K.; Su, M.-C.; Michael, J. V.J. Phys. Chem. A 2007, 111, 3951-3958.
4. Böhland, T.; Temps, F.; Wagner, H. G. Ber. Bunsen-Ges. Phys. Chem. 1984, 88,
455-458.
5. Seidler, V.; Temps, F.; Wagner, H. G.; Wolf, M.J. Phys. Chem.1989, 93, 1070-1073.
6. Böhland, T.; Temps, F.; Wagner, H. G. Proceedings of the 2Ist Symposium (International) on Combustion; The Combustion Institute: Washington, DC, 1988; 841-850.
7. Kraus, H.; Oehlers, C.; Temps, F.; Wagner, H. G.; Wolf, M.Ber. Bunsen-Ges. Phys. Chem.1989, 97, 545-553.
8. Böhland, T.; Heberger, K.; Temps, F.; Wagner, H. G.Ber. Bunsen-Ges.Phys. Chem.
1989,93,80-87.
9. Heberger, K.; Temps, F.; Volker, S.; Wolf, M.; Wagner, H. G.Proceedingsofthe 23rd Symposium (International) on Combustion;The Combustion Institute: Washington, DC, 1991; 29-35.
10. Goldbach, A,; Temps, F.; Wagner, H. G. Ber. Bunsen-Ges. Phys. Chem. 1990, 94,
11. Darwin, D. C.; Young, A. T.; Johnston, H. S.; Moore, C. B.J. Phys. Chem.1989, 93,
1074-1078.
12. Gesser, H.; Steacie, E. W. R.Can. J. Chem. 1956, 34, 113-122. 13. Darwin, D. C.; Moore C. B.J. Phys. Chem, 1995, 99, 13467-13470.
14. Pilling, M. J.; Robertson, J. A.J. Chem. Soc. Faraday Trans.1, 1977, 73, 968-984. 15. Brown, W.; Bass, A. M.; Pilling, M.J. Chem. Phys. 1970, 52, 5131-5143.
16. Tsang, W.; Hampson, R.F.,J. Phys. Chem. Ref. Data, Chemical kinetic data base for combustion chemistry. Part I. Methane and related compounds, 1986, 15, 1087-1279.
17. Gannon, K. L.; Blitz, M. A.; Pilling, M. J.; Seakins, P. W.; Klippenstein, S. J.; Harding, L. B.J. Phys. Chem. A2008, 112, 9575-9583.
18. Böhland, T.; Temps, F.; Wagner, H. G.J. Phys. Chem.1987, 91, 1205-1209.
19. Sosa, C.; Schlegel, H. B.J. Am. Chem. Soc.1984, 106, 5847-5852.
20. Ashfold, M. N. R.; Fullstone, M. A.; Hancock, G.; Ketley, G. W.Chem. Phys. 1981, 55, 245-257.
21. Langford, A. O.; Petek, H.; Moore, C. B.J. Chem. Phys.1983, 78, 6650-6659.
22. Dombrowsky, Ch.; Wagner, H. Gg.; Ber. Bunsenges. Phys. Chem. 1992, 96, 1048-1056.
23. Dombrowsky, Ch.; Hwang, S. M.; Rohrig, M.; Wagner, H. Gg.Ber. Bunsenges. Phys. Chem.1992, 96, 194-198.
24. Frank, P.; Bhaskaran, K. A.; Just, Th.J. Phys. Chem.1986, 90, 2226-2231.
25. Friedrichs, G.; Wagner, H. Gg.Z. Phys. Chem.2001, 215, 1601-1623.
26. Lu, K. W.; Matsui, H.; Huang, C.-L.; Raghunath, P.; Wang, N.-S.; Lin, M. C.,J. Phys. Chem. A,2010, 114, 5493-5502.
27. Wu, C.-W.; Matsui, H.; Wang, N.-S.; Lin, M.C. J. Phys. Chem. A, 2011, 115, 8086-8092.
28. Kumaran, S. S.; Su, M.-C.; Michael, J. V. Int. J. Chem. Kinet. 1997, 29, 535-543. 29. Seetula, J. A.Phys. Chem. Chem. Phys., 2002, 4, 455-460.
30. Lias, S. G.; Bartmess, J. E.; Liebman, J. F.; Holmes, J. L.; Levin, R. D.; Mallard, W. G.J. Phys. Chem. Ref. Data,Suppl. 1, 1988, 17, 1-861.
31. Kudchadker, S. A.; Kudchadker, A. P.J. Phys. Chem. Ref. Data,1976, 5, 529-530.
32. Furuyama, S.; Golden, D. M.; Benson, S. W.J. Phys. Chem., 1968, 72, 4713-4715. 33. Carson, A. S.; Laye, P. G.; Pedley, J. B.; Welsby, A. M.J. Chem. Thermodyn., 1993,
25, 261-269.
34. Lee, P. -F.; Matsui, H.; Chen, W. -Y.; Wang, N.-S., under preparation
Chap. 5.
Table 1. Summary of the experimental condition for thermal decomposition of CH2I2and
the rate constantk1b
T/K
P/atm.
[CH
2I
2]
0a[Ar]
bk
1bc1556
2.16
1.02
10.2
8.64
10
-171648
1.36
0.607
6.07
3.93
10
-161648
1.36
0.607
6.07
3.28
10
-161761
2.12
0.882
8.82
1.23
10
-151763
2.12
0.883
8.83
1.46
10
-151843
2.07
0.825
8.25
2.52
10
-151849
2.08
0.826
8.26
3.33
10
-151852
2.09
0.827
8.27
2.84
10
-151848
2.08
0.826
8.26
2.66
10
-152012
1.92
0.701
7.01
7.86
10
-152012
1.92
0.701
7.01
7.33
10
-15a: in 1012molecule/cm3, b: in 1018atom/cm3, c: in the unit of cm3
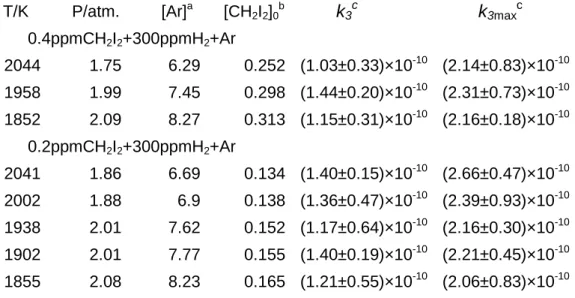
Table 2 Summary of The experimental Conditions for CH2+ H2reaction and
The Measured Rate Constantsk2andk5
T/K P/atm. [Ar]a [CH2I2]0b
k
3ck
3maxc0.4ppmCH2I2+300ppmH2+Ar 2044 1.75 6.29 0.252 (1.03±0.33)×10-10 (2.14±0.83)×10-10 1958 1.99 7.45 0.298 (1.44±0.20)×10-10 (2.31±0.73)×10-10 1852 2.09 8.27 0.313 (1.15±0.31)×10-10 (2.16±0.18)×10-10 0.2ppmCH2I2+300ppmH2+Ar 2041 1.86 6.69 0.134 (1.40±0.15)×10-10 (2.66±0.47)×10-10 2002 1.88 6.9 0.138 (1.36±0.47)×10-10 (2.39±0.93)×10-10 1938 2.01 7.62 0.152 (1.17±0.64)×10-10 (2.16±0.30)×10-10 1902 2.01 7.77 0.155 (1.40±0.19)×10-10 (2.21±0.45)×10-10 1855 2.08 8.23 0.165 (1.21±0.55)×10-10 (2.06±0.83)×10-10
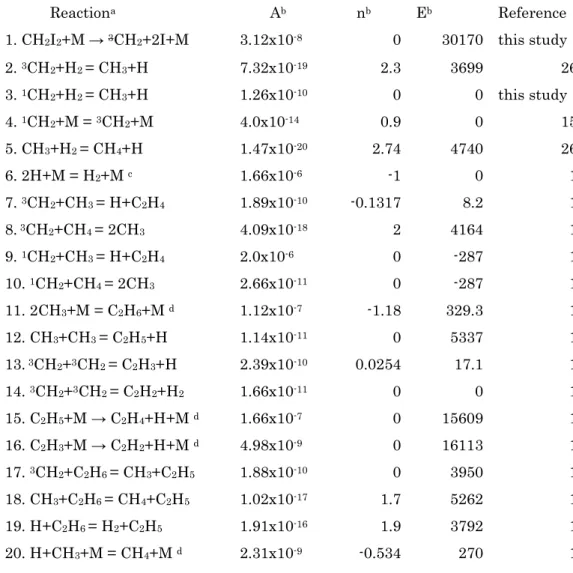
Table 3 Reaction mechanism for analyzing the observed profile of H atom.
a: forward and reverse reactions are considered when connected by”=” b:k= A Tnexp(-Ea/RT) [molecule, cm3, K, cal]
c: third-body collision efficiency for M (= Ar) is taken from Ref. 1.
d: only parameters for high pressure limit are shown but the rate for fall-off region is evaluated by using parameters given in Ref.1
Reactiona Ab nb Eb Reference
1. CH2I2+M → 3CH2+2I+M 3.12x10⁻⁸ 0 30170 this study
2.3CH2+H2= CH3+H 7.32x10⁻¹⁹ 2.3 3699 26 3.1CH2+H2= CH3+H 1.26x10⁻¹⁰ 0 0 this study 4.1CH2+M =3CH2+M 4.0x10⁻¹⁴ 0.9 0 15 5. CH3+H2= CH4+H 1.47x10⁻²⁰ 2.74 4740 26 6. 2H+M = H2+Mc 1.66x10⁻⁶ -1 0 1 7.3CH2+CH3= H+C2H4 1.89x10⁻¹⁰ -0.1317 8.2 1 8.3CH2+CH4= 2CH3 4.09x10⁻¹⁸ 2 4164 1 9.1CH2+CH3= H+C2H4 2.0x10⁻⁶ 0 -287 1 10.1CH2+CH4= 2CH3 2.66x10⁻¹¹ 0 -287 1 11. 2CH3+M = C2H6+Md 1.12x10⁻⁷ -1.18 329.3 1 12. CH3+CH3= C2H5+H 1.14x10⁻¹¹ 0 5337 1 13.3CH2+3CH2= C2H3+H 2.39x10⁻¹⁰ 0.0254 17.1 1 14.3CH2+3CH2= C2H2+H2 1.66x10⁻¹¹ 0 0 1 15. C2H5+M → C2H4+H+Md 1.66x10⁻⁷ 0 15609 1 16. C2H3+M → C2H2+H+Md 4.98x10⁻⁹ 0 16113 1 17.3CH2+C2H6= CH3+C2H5 1.88x10⁻¹⁰ 0 3950 1 18. CH3+C2H6= CH4+C2H5 1.02x10⁻¹⁷ 1.7 5262 1 19. H+C2H6= H2+C2H5 1.91x10⁻¹⁶ 1.9 3792 1 20. H+CH3+M = CH4+Md 2.31x10⁻⁹ -0.534 270 1
Figure Captions
Figure 1. Examples of the observed evolution of I atoms in the 0.1 ppm CH2I2+ Ar
A: T = 1556 K, P = 2.16 atm., [Ar] = 1.02 × 10¹⁹/cm3; B: T = 1761 K, P = 2.12 atm.; [Ar] =
8.82 × 10¹⁸/cm3; C: T = 1848 K, P = 2.08 atm., [Ar] = 8.26 × 10¹⁸/cm3
Calculated profiles of I atoms by using equation (III) is shown by the dotted curve. where, initial rise is given for Figure 1-A, by using k1a= 4.36 ×10⁻⁹ exp(-19858/T)/
cm3molecule-1s-1, (the rate for thermal decomposition of CH3I which has nearly equal
dissociation energy with reaction 1a), and the rise rate given by the response time of the detection system was used for Figures 1B and 1C.
Figure 2. Arrhenius plot of the reaction rate for CH2I + Ar → 3CH2+ I + Ar (1b)
Linear least squares-analysis of the data is given byk1b/ cm3molecule-1s-1= 3.12 × 10⁻⁸
exp(-30170/T) and expressed by the straight solid line.
Figure 3. An example of the observed evolution of H atoms in the highly diluted CH2I2
+ 300 ppm H2in Ar and comparisons with simulations.
A: experimental result is shown by the black solid line; sample gas: 0.2 ppm CH2I2+ 300
ppm H2 in Ar, T = 2002 K, P = 1.83 atm., [Ar] = 6.69 × 10¹⁸/cm3, [CH2I2]0= 1.34 ×
1012/cm3. Kinetic simulations using the mechanism of Table 2 is shown by the red solid
curve and the values for ±30% ofk3are shown by the red broken curves, respectively.
The solution with the best fit ofk3*max(maximum value fork3assumingk2= 0) is shown
by the black open circle,
B: The sensitivity coefficient (non-dimension) for H atoms; SHj, evaluated for the
experimental condition of A.
The number indicated in this figure corresponds to the reaction number in the text and Table 3. The reactions in Table 3 not shown in this figure do not show any sensitivity. Figure 4. Summary of the reaction rates for3CH2+ H2→ CH3+ H (2)and1CH2+ H2
→ CH3+ H (3).
A: k2 (expressed by the black symbols): black solid line and black dashed line: TST
calculation without Eckert correction and TST calculation with Eckert correction, respectively (Reference26),connected by the black broken line; semi-empirical result obtained by the relative measurement of k2 combined with TST/quantum chemical
calculation (Reference 12 and Reference 26),■:Reference 13, ◆: Reference 14, dotted line: Reference 16, × and +; Reference 25.
k3 (expressed by the red symbols): red circle; present study, red solid line and red
dashed line; Reference 25 (k2+k3), red dash-dotted line; Reference 17, red dash line;
Reference 18, red square; Reference 20, red triangle; Reference 21.
B: k2 (expressed by the black symbols): black solid line and black dash line: TST
calculation without Eckert Correction, and with Eckert Correction, respectively (Reference21), × and + with dotted line; Reference 25.
k3(expressed by the red symbols): red circle; present study fork3, red triangle; present
study for the maximum value fork3i.e., k3*max (see text), red solid line; Reference 25
(k2+k3) , where, the upper and lower limit of Reference 25 are shown by the red dash
Figure 3
10
-13[H]
/atom cm
-3SHj
(1)
(2)
(3)
(5)
(6)
A
B
t /
μs
t /
μs
Figure 4-A
10
3T
-1/K
-1k
3Figure 4-B
![Figure 3 10 -13 [H] /atom cm -3 S Hj (1) (2) (3) (5)(6)A B t / μst / μs](https://thumb-ap.123doks.com/thumbv2/9libinfo/8601354.190131/22.892.118.722.265.946/figure-atom-cm-hj-μst-μs.webp)