國
立
交
通
大
學
生化工程研究所
碩
士
論
文
探究造癭昆蟲基因分子演化關係及蟲癭組織蛋白質體組成
-以樟科楨楠屬植物及癭蚋科昆蟲為例
Molecular Phylogenetic Relationships of Cecidomyiidae Gall Midges
and Proteomics of Galls from Machilus Hosts
研 究 生:周韋汝
指導教授:楊裕雄 教授
探討造癭昆蟲基因分子演化關係及蟲癭組織蛋白質體組成-以樟
科楨楠屬植物及癭蚋科昆蟲為例
Molecular Phylogenetic Relationships of Cecidomyiidae Gall Midges
and Proteomics of Galls from Machilus Hosts
研 究 生:周韋汝 Student:Wei-Ju Chou
指導教授:楊裕雄 Advisor:Yuh-Shyong Yang
國 立 交 通 大 學
生 化 工 程 研 究 所
碩 士 論 文
A ThesisSubmitted to Institute of Biochemical Engineering National Chiao Tung University
in partial Fulfillment of the Requirements for the Degree of
Master in
Biochemical Engineering May 2008
Hsinchu, Taiwan, Republic of China
中華民國九十七年五月
探究造癭昆蟲基因分子演化關係及蟲癭組織蛋白質體組成-以樟科楨楠屬
植物及癭蚋科昆蟲為例
學生:周韋汝 指導教授:楊裕雄教授
國立交通大學生化工程研研究所碩士班
摘
要
本論文主要分兩方面探討台灣楨楠屬植物上之雙翅目癭蚋科蟲癭的生
長情況。一由基因序列演化分析探討雙翅目癭蚋科蟲癭彼此間的親源遠近
關係,再利用二維電泳探究蟲癭組織與植物組織當中蛋白質成分的差異,
以期瞭解蟲癭的發生機制。並綜合討論癭蚋分子演化關係、蟲癭型態發生、
與癭蚋外型解剖間相互的關係。本研究取台灣八種楨楠上的九型蟲癭,共
四十種樣本做癭蚋基因演化關係。而蟲癭組織蛋白質分析取三種楨楠、兩
型蟲癭,共六種樣本作蛋白質二維電泳及定序。由造癭昆蟲基因演化分析
得知,造出同型蟲癭的癭蚋,為分類學上較親近的種。種的親緣遠近關係
與寄主植物的種類較無關連。而造莖部癭的癭蚋較造葉部癭的癭蚋早演化
出來。而癭蚋幼蟲解剖分析支持前述推論。植物分類學上,莖部癭所具有
之型態特徵亦被認為是較早出現的形態。由蟲癭組織蛋白質體二維電泳分
析得知,不同型蟲癭彼此間蛋白質差異不大,但蟲癭外型與蛋白質相關。
同型蟲癭在不同楨楠屬植物上的蛋白質差異較前述為大,可能因植物種類
不同,對相似化學物質的反應不同所致。蟲癭組織當中 RuBisCO 蛋白質表
現量較正常植物組織大幅下降,進而推測蟲癭組織已喪失光合作用的功能。
Molecular Phylogenetic Relationships of Cecidomyiidae Gall Midges and
Proteomics of Galls from Machilus Hosts
Student Wei-Ju Chou Advisor: Yuh-Shyong Yang
Institute of Biochemical Engineering
National Chiao Tung University
Abstract
Cecidology is the study of plant galls, where insects and other organisms breed their offsprings. Cecidology crosses multiple areas such as ecology, insect taxonomy, botanical taxonomy, botanic pathology, parasitology, and it’s a special research subject. Little is known regarding the interaction between gall insects and their host at molecular level.
In Taiwan, Machilus (Lauraceae) plants have the widest variety of gall shapes among all plant species. Cecidomyiidae (Dipteria) is the major gall inducing insects on Machilus. To understand the relationship between gall insects and their hosts, we first identified different species of gall insect through insect genomics and the responses of the host were studied through plant proteomics. In insect genomics, we used COI gene to classify 40 unknown species collected from 9 different types of galls on 8 Machilus species. These cecidomyiidae gall inducing midges could be classified into 7 tribes, 11 genus, and 15 species. Our data indicate that insects which make same type of galls are closer species. The anatomical evidence and ecological theories also supports genomic evidence.
In plant proteomics, we found that galls were benignancy tissue growth of plant. Because RuBisCO protein expression in gall tissues was largely decreased, galls might be the storage organisms of plants. Combine genomic and proteomic outcomes, we suggest that same or closer insect species secretes same chemicals to induce same shape of galls, and it has nothing to do with host plants within Machilus genus. Some proteins might also affect the forming of different gall shapes as significant protein variations were observed between gall and normal plant tissues.
誌 謝
這本論文的完成要感謝很多人。 首先感謝的當然是實驗室大家長楊裕雄教授,謝謝老師開放而自由的管理、給我們 最大的支持與幫助,讓我們能夠在實驗上盡情發揮不受限;謝謝林業試驗所的董景生博 士與助理許嘉錦先生,不僅提供我實驗所需的樣本、解答關於蟲癭生態及相關知識的疑 惑,也帶著笨手笨腳的我遠離塵囂上山體驗採樣本的艱辛、順便呼吸新鮮空氣。謝謝林 業試驗所的簡慶德博士與董博士願意遠道下來新竹擔任我的口試委員;謝謝交大生資所 盧錦隆老師在演化分析方面為我指點迷津並擔任口試委員;謝謝實驗室助理 Sonia 接下 繁瑣的管帳工作,讓我能有時間喘口氣。謝謝奇翰學長及郁吟學姐賢伉儷,不僅解答我 很多學業上的疑惑、對學弟妹的生活健康也多所關照。謝謝活潑美麗的小米學姐,能夠 認識個性和我很像的妳,真是件開心的事。謝謝聰明睿智的政哲學長,你一針見血的言 論常讓我們折服;謝謝十八般武藝樣樣精通的淵仁學長,實驗室裡任何工程都難不倒 你;謝謝已經去玩國軍 online 的降平,你是我們班上心地最善良又正直的人,祝你和 中曦永遠幸福。謝謝程允、青辰、志衡、陸宜、昆熹、佩綺、明瑜、美春、秀華、若芬、 家煒、柏翰、音汝、咏馨、妤婷,謝謝大家總是那麼和氣友善幽默風趣,並在彼此有困 難時互相幫忙扶持,能夠認識你們真是我的福氣。 謝謝爸媽生我養我教育我,在我寫不出論文焦急煩躁時為我打氣加油。對你們的感 謝不是三言兩語能說完的,雖然我並沒有常常把愛掛在嘴邊,但你們是我最愛也是最重 要的人。 謝謝所有我愛的和愛我的人。 韋汝目 錄
中文提要
……….. i
英文提要
……….. ii
誌謝
……….. iii
目錄
……….. iv
表目錄
……….. vii
圖目錄
……….. viii
符號說明
……….. iX
一、
Introduction……….. 1
1.1
The importance of correct taxonomy DNA barcode
1
1.2
About gall-inducing insects………..
2
1.3
About plant galls………..
4
1.4 About
Machilus in Taiwan………...
5
1.5
Previous researches and our motivation…………..
7
二、
Materials and Methods………....
9
2.1 Insect
gene
molecular evolution...………...
9
2.1.1
Gall midge sample collection………..
9
2.1.2 DNA
extraction………
10
2.1.3 DNA
analysis………...
10
2.2
Plant proteomics………..
14
2.2.1 Sample
collection……….
14
2.2.2
Plant Gall tissues processing………
14
2.2.3
Plant Leaves processing………...
14
2.2.4
Plant tissue powder preparation………..
15
2.2.5
Protein extraction & assay (phenol extraction) ….
15
2.2.6 2D-electrophoresis………...
16
2.2.7
Protein staining and analysis of 2-DE gels………..
16
2.2.8
Protein identification by MS………
17
三、
Results……….. 18
3.1
Insect gene molecular evolution…….……….
18
3.1.1
Gall Midge COI gene sequence alignment………..
18
3.1.2
Gall midge 12s gene sequence alignment…………
19
3.1.3
Gall midge COI gene evolutionary tree…………...
19
3.1.4
Gall midge 12s gene evolutionary tree……….
21
3.1.5 Gall
midge
evolutionary relationships……….
22
3.1.6
Gall midge larvae morphology anatomy and gene
analysis……….
23
3.2 Plant
Proteomics………..
25
3.2.2
Protein pattern differences between three Machilus
leaves………
25
3.2.3
Protein pattern differences between two types of gall on
single Machilus leaves………
27
3.2.4
Protein pattern differences between bell galls on three
Machilus leaves………...
27
3.2.5
Protein pattern differences between mice galls on three
Machilus leaves………...
28
3.2.6
Common protein pattern differences between gall tissues
and leaf tissues………..
29
3.2.6.1 Protein pattern differences between bell-gall-tissues,
mice-gall-tissues, and leaf tissues of Machilus zuihoensis
var. zuihoensis. (MZ)………
29
3.2.6.2 Protein pattern differences between bell-gall-tissues,
mice-gall-tissues, and leaf tissues of Machilus zuihoensis
var. mushaensis. (MM)……….
30
3.2.6.3 Protein pattern differences between bell-gall-tissues,
mice-gall-tissues, and leaf tissues of Machilus thunbergii.
(MT)………..
30
四、
Discussion.………... 32
4.1
Insect gene molecular evolution……..……….
32
4.1.1
Gall Midge COI gene sequence alignment………..
33
4.1.2
Gall midge 12S gene sequence alignment…………
33
4.1.3
Gall midge COI gene evolutionary tree…………...
34
4.1.4
Gall midge 12S gene evolutionary tree……….
37
4.1.5
Evolutionary relationships of cecidomyiidae
midges………..
39
4.1.6
Gall midge larvae morphology anatomy and gene
analysis……….
41
4.1.7
Summary of gall midge taxonomy relationships…..
42
4.2 Plant
Proteomics………...
45
4.2.1
Comparison of galled and ungalled leaves………...
45
4.2.2
Protein pattern differences between three Machilus
leaves………
45
4.2.3
Protein pattern differences between two types of gall on
single Machilus leaves……….
46
4.2.4
Protein pattern differences between bell galls on three
Machilus leaves………...
46
4.2.5
Protein pattern differences between mice galls on three
Machilus leaves……….
46
4.2.6
Common protein pattern differences between gall tissues
and leaf tissues………..
4.2.6.1 Protein pattern differences between bell-gall-tissues,
mice-gall-tissues, and leaf tissues of Machilus zuihoensis
var. zuihoensis. (MZ)………
47
4.2.6.2 Protein pattern differences between bell-gall-tissues,
mice-gall-tissues, and leaf tissues of Machilus zuihoensis
var. mushaensis. (MM)……….
48
4.2.6.2 Protein pattern differences between bell-gall-tissues,
mice-gall-tissues, and leaf tissues of Machilus thunbergii.
(MT)……….
48
4.2.7
Mass Spectrometric sequencing of proteins……….
49
4.3
Combined discussion of gall midges phylogeny and plant
proteomics………
51
五、
Reference………. 54
Appendix 1 Further analysis of COI and 12S genes……….
115
Appendix 2 COI Gene Sequence Alignment…………..……….
137
Appendix 3 12S Gene Sequence Alignment………
159
Appendix 4 COI Gene Genetic Distances………
175
Appendix 5 12s Gene Genetic Distances……….
209
Appendix 6 COI Gene UPGMA Genetic Distances………
232
Appendix 7 12S Gene UPGMA Genetic Distances……….
266
Appendix 8 Protein identification by MASCOT……….
291
Appendix 9 Protein sequence analysis and identification………
311
表 目 錄
Table 1
The collection and classification table of gall midges
(Cecidomyiidae) on Machilus in Taiwan………...
96
Table
2
Machilus gall midges (Cecidomyiidae) used for
mitochondrial COI sequences………
98
Table 3
The four major morphological types of Cecidomyiidae
larvae in last stage………..
101
Table 4
Characteristics of cecidomyiidae larvae……….
102
Table 5
Taxonomic table of Machilus gall-midge (cecidomyiidae)
by COI gene………
103
Table 6
Taxonomic table of Machilus gall-midge (cecidomyiidae)
by 12S gene………
106
Table 7
Protein pattern differences between bell and mice galls
on single Machilus species………
109
Table 8
Protein pattern differences between bell galls on three
Machilus leaves………..
110
Table 9
Protein pattern differences between mice galls on three
Machilus leaves………..
111
圖 目 錄
Figure 1
Sample locations of cecidomyiidae gall midege in
Taiwan ………...
59
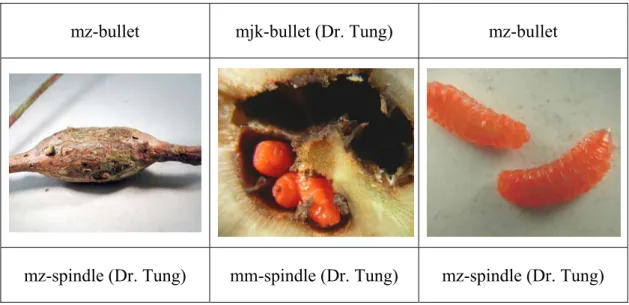
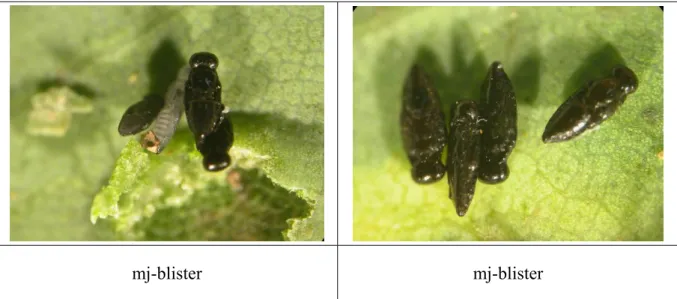
Figure 2
Cecidomyiidae midge larvae and galls………...
60
Figure 3
Parasitized midge larvae……….
63
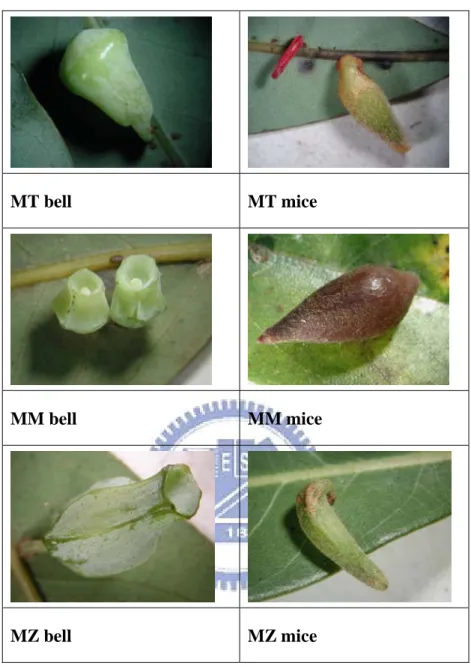
Figure 4
Plant samples………..
66
Figure 5
Cecidomyiidae COI gene sequence alignment…………...
67
Figure 6
Cecidomyiidae 12s gene sequence alignment………
69
Figure 7
Evolutionary tree of gall midge COI DNA with
Neighbor-Joining method………...
71
Figure 8
Evolutionary tree of gall midge 12S DNA with
Neighbor-Joining method………..
73
Figure 9
Evolutionary tree of gall midge COI gene using UPGMA
method………
75
Figure 10
Evolutionary tree of gall midge 12S gene using UPGMA
method………
77
Figure 11
Protein spots which were sent to Mass Spectrometric
Analysis………..
79
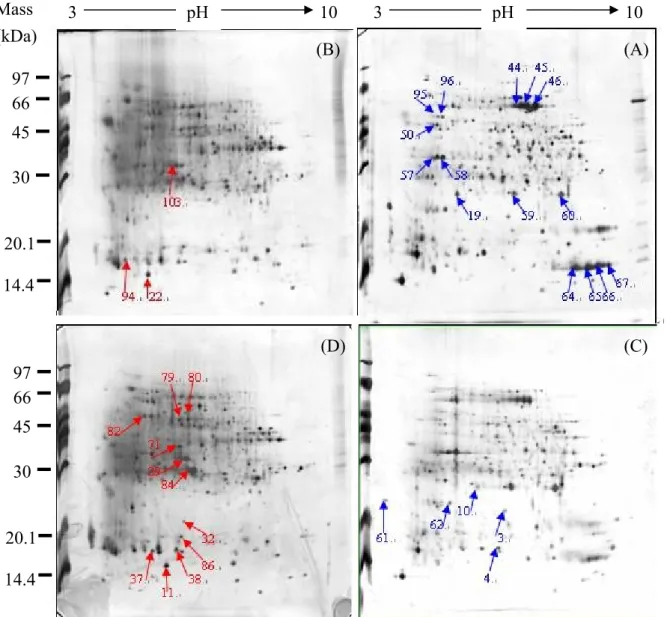
Figure 12
Protein patterns of galled and ungalled Machilus
zuihoensis var. mushaensis leaves………..
80
Figure 13
Protein pattern differences between three Machilus leaves
81
Figure 14
Protein pattern differences between three Machilus leaves
83
Figure 15
Protein pattern differences of two types of galls on same
Machilus species……….
84
Figure 16
Protein pattern differences between bell galls of three
Machilus species……….
86
Figure 17
Protein pattern differences between mice galls on three
Machilus leaves………..
88
Figure 18
Protein pattern differences between bell-gall-tissues,
mice-gall-tissues, and leaf tissues of Machilus zuihoensis
var. zuihoensis………
90
Figure 19
Protein pattern differences between bell-gall-tissues,
mice-gall-tissues, and leaf tissues of Machilus zuihoensis
var. mushaensis………..
91
Figure 20
Protein pattern differences between bell-gall-tissues,
mice-gall-tissues, and leaf tissues of Machilus thunbergii.
92
Abbreviations and Symbols
PCR Polymerase Chain Reaction DNA Deoxyribonucleic acid
NHRI National Health Research Institute COI Cytochrome Oxidase I
UV Ultraviolate
NCBI National Center for Biotechnology Information TFRI Taiwan forest Research Institute
RuBisCO Ribulose-1,5-bisphosphate carboxylase/oxygenase UPGMA Unweighted Pair Group Method with Arithmatic Mean NJ Neighbor Joining
1. Introduction
1.1 The importance of correct taxonomy DNA barcode
Accurate taxonomy plays an important role in ecological, evolutionary interpretation, and many other practical applications. Correct identification of species is an essential part of taxonomy due to the fact that traditional morphology-anatomy-based classification methods have some limitations (Edward, 2006; Gdofray, C., 2004; Samper, C., 2004). First, it might overlook some morphologically similar species, which are familiar to many taxa (M. Alex Smith et al, 2006; Hebert P.D.N. et al, 2004; Jarman et al, J, 2000). Second, it sometimes only works in certain life stages or genders and demands high level of expertise which made classification a long and difficult task (Hebert, P.D.N. et al, 2003). With those limitations, and species around the world are actually disappearing faster than biologists can identify them, there’s a press need for rapid, accurate methods of classifying life (Meter CP, Paul G, 2005).
DNA barcode has recently been proposed as a tool to facilitate species identification and discovery (Hebert, P.D.N. et al, 2003; Blaxter M, 2003). The theory base of DNA barcode is that a short and standardized segment of genome can be regard as a “biological barcode” which can be used in species identification (Marshall, E., 2005). It could be a helpful tool of species recognition because sequence divergences among individuals in the same species are normally much lower than that between related species (Avise, J.C. & Walker D. 1999; Hebert P.D.N. et al, 2003; Moore, W.S, 1995). In prior researches, DNA barcodes has been used to identify species among parasitoid flies (M. Alex Smith et al, 2006), skipper butterflies (Hebert P.D.N. et al, 2004), Lepidoterans (Hebert, P.D.N. et al, 2003), birds (Hebert P.D.N. et al, 2004), and even flowering plants (Kress W. J. et al, 2005).
used (Hwang J.S. et al, 1999; Dorchin et al, 2004; Mollaret et al, 2000), but scientists found that the prevalence of insertions and deletions (indels) of these genes could increase the complexity of sequence alignment and led to constraint on broad taxonomic analysis (Doyle et al, 2000). By contrast, the cytochrome c oxidase I gene segments (COI) has two significant advantages: First, the universal primers for COI are very robust which could recover the 5’ end of most representative species in animal phyla (Folmer et al, 1994; Zhang et al, 1997). Second, because the third-position nucleotides have high rates of substitution which leads to greater molecular evolution rate than 12s or 16s rDNA, and it indicates that COI could possess a better range of phylogenetic signals (Knowlton et al, 1998). Therefore COI has replaced those genes and been used for animal classifications recently [5, 8, 11-13]. Among Diptera insects, COI is wildly used for classification and identify new species (Jin-Sik Bae et al, 2001; James M. Cook et al, 2002; N. Uechi et al, 2003; J. Yukawa et al, 2003; Makoto Tokuda et al, 2004).
The effectiveness and accuracy of COI DNA barcodes has been proved to be as high as 97.9% by testing the 521 recognized species in three different families of Lepidoptera-Hesperiidae (skipper butterflies), Sphingidae (sphinx moths), and Saturniidae (wild silk moths) (Mehrdad H. et al, 2006).
1.2 About gall-inducing insects
Galls are the abnormal growth of plant tissues which can be induced by infections of nematodes, bacteria, fungi, virus, or insect stimulation. Insect galls can be found on angiosperm, gymnosperm, pteridophyte, lichen, algae, but angiosperm are the major gall plants, which has the ratio of 90% and up to all kinds of galls. Galls can be found on any plant species and organisms but 80 % can be found on leaves (Mani, 1964).
most of the gall insects nowadays are evolved from plant-eating and carnivorous insects (Roskam, 1992).
Insect galls develop under the influence of gall-inducing insects. Insect galls are usually induced by the chemicals injected by the larvae or the adults in the plants, either including mechanical damage or not. After the galls are formed, the larvae develop inside until fully grown, at which time they leave, sometimes as adults. In order to form galls, the insects must seize the time when plant cell division occurs at a high speed, the growing season, usually spring in temperate climates, but which can be extended in tropical latitudes. Also, the specific places where plant cell division occurs are needed to induce galls, that is, the meristems. Although insect galls can be found on a variety of parts of the plant, such as the leaves, stalks, branches, buds, roots or even flowers and fruits, gall-inducing insects are usually species-specific and sometimes tissue-specific on the plants they gall. Some insects induce galls on plants similar to each other, frequently within genera or family.
Gall-inducing insects include gall wasps, gall midges, aphids, and psyllids.
In former researches, we know that insect has high specificity of their host plants and organisms that they only make galls on the same host or with in some specific and related species (Dreger-Jauffert & Shorthouse, 1992). Among all the gall-inducing insects, the family Cecidomyiidae (Diptera) is believed to be one of the major groups of gall inducers and most gall midges are highly host specific (Harris, K.M. 1994).
There are over 15,000 species of known gall insects and distributed in 6 orders. Which include: Diptera, Hymenoptera, Lepidoptera, Coleoptera, Hemiptera, Thysanoptera (Meyer, 1987; Williams, 1994).
In Taiwan, Cecidomyiidae (Diptera) is the major gall-inducing insects of the genus
Machilus (Lauraceae) plant, which has the widest varieties of gall forms among all the galled
plants. Cecidomyiidae midges are very fragile small insects usually only 2-3 mm. in length and many are less than 1 mm long. They are characterized by hairy wings, unusual in the Order Diptera, and have long antennae. Unlike some gall-inducing insects of other plant species, most of Cecidomyiidae midges are unknown species and it’s hard to classify them by their appearance. In order to solve this problem, we adopt the molecular classification method, DNA barcode.
1.3 About plant galls
Galls are the abnormal growth of plant tissues which can be induced by infections of nematodes, bacteria, fungi, virus, or insect stimulation. Insect galls can be found on angiosperm, gymnosperm, pteridophyte, lichen, algae, but angiosperm are the major gall plants, which has the ratio of 90% and up to all kinds of galls. Galls can be found on any plant species and organisms but 80 % can be found on leaves (Mani, 1964).
According to the level of diversification, galls are classified in to organoid gall and histoid gall (Kuster, 1911). Organoid galls are the normal changes of plant organs which gall-inducing insects induced, and the original plant organs can still be distinguished. Histoid galls are the abnormal growth or proliferation of plant tissues, which can be divided further into kataplasmatic gall and prosoplasmatic gall.
Normally, galls are classified according to their shape, conformation complexity, and positions on plants. There are many types: filz gall, pit gall, blister gall, pouch gall, roll gall, fold gall, covering gall, mark gall, bud gall, and rosette gall (shorthouse, J.D, 1992). There are also other classification method which according to the forms of insect locules. A single gall with only one insect inside is monolocular gall; many monolocular galls aggregate together
are called gregarious gall; If gall-inducing insect laid many eggs at the same position of plant organ, and developed one gall with several locules, it’s called multilocular gall. (Csoka, 1997)
The mechanisms of insect gall development are not well studied, and they’re still unclear. The possible mechanisms include: 1.Injection of saliva while insects eat plant tissues, there might be some inducer factors in insect saliva. 2.Injection of gall-inducing factors while insects lay their eggs. 3.Gall-inducing factors which exists in insects or larvae’s feces. (Higton, Mabberly, 1994). The most accepted mechanism theory is injection of gall-inducing factors while insects spawning. But gall-inducing factors are still unknown. According to past researches, the possible gall-inducing factor might be some plant growth factors, which includes indole acetic acid (IAA), cytokinins, auxins, and zeatins (Cornell, 1983; Abrhamson, 1997). Other possible gall-inducing-factors might include amino acid (Schaller, 1969), proteins (Higton, Mabberly, 1994).
1.4 About Machilus in Taiwan
The Lauraceae or Laurel family comprises a group of flowering plants included in the order Laurales. The family contains about 55 genera and over 2000 (perhaps as many as 4000) species world-wide, mostly from warm or tropical regions, especially Southeast Asia and Brazil. Most are aromatic evergreen trees or shrubs. There are about 20 genera and over 400 species in China, and about 14 genus 60 species in Taiwan.
The leaves are simple, without stipules, and usually alternate. The androecium most frequently comprises 4 whorls of 3 stamens each, although the inner whorls are often sterile. The flowers are actinomorphic, usually bisexual, and possess a perianth of six, basally connate sepallike segments. The anthers dehisce by means of commonly 4, upwardly opening flaps. The filaments of the inner whorl usually have a pair of enlarged glandular appendages near the base. The fruit is a berry or a drupe, often surrounded basally by the short, persistent perianth cup. The single simple pistil has a usually superior ovary with a single pendulous
ovule in a solitary locule. Unlike other Magnoliidae, the endosperm is completely absorbed by the embryo in Lauraceae. (wikipedia: Lauceae)
Machilus is a genus of about 150 species of evergreen trees belonging to the laurel
family, Lauraceae. It’s classification is Kingdom Plantae, Phylum Magnoliophyta, Class Magnoliopsida, Order Laurales, Family Lauraceae.
They are medium-size trees, 15-30 m tall at maturity. The leaves are simple, lanceolate to broad lanceolate, varying with species from 5-30 cm long and 2-12 cm broad, and arranged spirally or alternately on the stems. The flowers are in short panicles, with six small greenish-yellow perianth segments 3-6 mm long, nine stamens and an ovary with a single embryo. The fruit is an oval or pear-shaped drupe, with a fleshy outer covering surrounding the single seed; size is very variable between the species. (wikipedia: Machilus)
The major distribution of Machilus is in tropical and subtropical zones, especially in East Asia, about 100 species. None of the species is very tolerant of severe winter cold.
There are eight Machilus species found in Taiwan. There are two varieties each were classified for M. japonica Sieb & Zucc. and M. zuihoensis Hay. The two varieties of M. zuihoensis Hay. are M. zuihoensis var. zuihoensis (M. zuihoensis, the acronym is MZ in sample classification table) and M. zuihoensis var. mushaensis (M. mushaensis, MM). The two varieties of M. japonica Sieb & Zucc. are M. japonica var. japonica (M. japonica,) and M. japonica var. kusanoi Hay. (M. kusanoi, MJK). Other species are M. philippinensis Merr. (MP), M. konishii Hay. (MK), M. obovatifolia Hay. (MO), and M. thunbergii (MT). Among these eight species, MZ, MK, MO, and MK are the endemic species of Taiwan. (Miao et al, 2007)
The distributions of some Machilus species within Taiwan are restricted, but others are found throughout large parts of the island. MT MJ and MZ are widespread from subtropical to temperate zones; MJK is also widely distributed but mainly in the low lands near rivers. MK is restricted to the subtropical zone in central and southern parts of Taiwan west of the Central
Mountain Range, and MP is only found in the subtropical southern part west of the Central Mountain Range. MO is only found on the tropical Hengchun Peninsula at the southern tip of the island. . These species have adapted to different edaphic and environmental conditions. (Miao et al, 2007)
1.5 Previous researches and our motivation
There are several researches about gall and plant physiology. For example, some scientists have tested the nitrogen concentration in plant primary metabolites, because nitrogen is usually regarded as the index of whether host plant could provide sufficient nutrition or not. But the outcomes are different among different researches. Hartley (1998) discovered that the nitrogen concentration is higher in Dasineuravicia galls, but not in other Diptera insect galls (Rhopalomyia sp.). Other researches revealed that the nitrogen concentrations are even higher in plant tissues than in gall tissues made by gall wasp, gall fly (Hartly, 1998) and some gall midge (Brewer et al, 1987).
Some researches indicated that there are obvious high concentration of starch, soluble carbohydrate, lipid and proteins in gall tissues. (Shannon 1980; Bronner, 1992; De Bruyn et al, 1998) But there are other researches indicated the opposite situations. (Anderson and mizell, 1987; Conell, 1983, Hartley, 1992, 1998; Yang 1998)
Most of previous researches in Taiwan about galls, focus on the description and comparison of newly discovered galls on plants. (Yang, 1984; Tao 1991; Yang and Tung, 1998). Some researches described more detailed insect life history and related information (Yang, 1996; Tung, 1998, Su 2002). There are also some researches about gall forms and tissues (Su, 2002; Tung, 1997; Liang, 1999; Weng, 2003; Chen, 2004). Other research about plant physiology and ecology includes Yang (1998) discuss the photo pigment and protein complex; Liao 2003 discussed the nutrition adaptation of gall-insects.
attentions and interests on these abundant galls. In our research, we use 2D electrophoresis technique to determine the protein differences between plant and gall tissues, in order to understand the protein changes. And we can provide further information of gall physiology.
We also use DNA barcode to determine gall midge phylogeny, combined with plant gall proteomics and larvae anatomy, in order to contribute some information to Cecidology.
2 .Materials and Methods
2.1 Insect gene molecular evolution
2.1.1 Gall midge sample collection
These samples was collected by Dr. Tung, Mr. Hsu and I. Total 9 morphospecies of galls were collected together with leaves and stems from 8 species of Machilus in Taiwan October 2004 through January 2005. Among these 9 morphospecies of galls, 3 are stem galls and 6 are leaf galls. We gave each plant species and galls a number. Since all midge larvae inside these galls are unknown species, we named these larvae according to plant names, gall types, and serial numbers. Detailed information is shown in Fig. 1 and Table 1.
Galls along with leaves and stems were put in zipped bags in 4℃ refrigerator. Larvae or pupae were picked from galls in two days after collection and preserved in 99.5% alcohol in 4 ℃ for DNA extraction. Every larva or pupae were picked over under dissecting binocular microscope. Larvae and pupae which were distinguishable or suspected parasitized were excluded in order to avoid contamination with internal or external parasitoid larvae in DNA analysis.
The way we treated parasitized larvae:
Cecidomyiidae midge larvae are easily be parasitized by bees or other organisms such as fungi, bacteria…etc. When parasites were inside the larvae, we abandoned these larvae. When parasites were outside the larvae, we picked parasites out from midge larvae. Then we put these once-parasitized larvae into another container, separated from those un-parasitized larvae in order to avoid contamination. We would use these once-parasitized larvae only when we ran out of un-parasitized larvae. In our experiment, we didn’t use these once-parasitized larvae.
2.1.2 DNA extraction
Due to the various body sizes and weights of larvae, an average of total weight 5 mg individuals from respective types of galls and host plants were used for DNA analysis. Detailed data for speciment are shown in Table 1 and Table 2.
Total DNA were extracted from the whole body with QIAamp DNA Mini Kit (Qiagen) according to the steps in manufacturer’s specification. A ca. 430 bp long fragment of the 12S small ribosomal subunit was PCR-amplified using the primers SR-J-14199 (50-TAC TAT GTT ACG ACT TAT-30) and SR-N-14594 (50-AAA CTA GGA TTA GAT ACC C-30) (Kambhampati and Smith, 1995). Another region of cytochrome oxidase subunit I (COI) gene of mitochondria was amplified by using the following primer pair : forward, 5’-GGA TCA CCT GAT ATA GCA TTC CC-3’ (COIS) and reverse, 5’-CCC GGT AAA ATT AAA ATA TAA ACT TC-3’ (COIA) ( Funk, 1995). All PCR mixes had a total volume of 100μl and contained 0.1mM dNTPs, 2μM of each primer, 5-10μl genomic DNA , one unit of TaqDNA polymerase (Protaq), 10μl PCR buffer comes with TaqDNA polymerase (Protaq), and add ddH2O to 100μl. The thermocycling profile consisted of initial step of 5 min at 92℃, followed by 30 cycles of 1 min at 92℃, 1 min at 52℃, and 1 min at 72 ℃, with the final step of 5 min at 72℃. PCR products were electrophoresed in 2.0% TAE agarose gels along with 100bp DNA markers (violet), stained with ethidium bromide, and visualized under UV light. In some cases, the DNA band in agarose gel needs to be purified by GFX PCR DNA and gel band purification kit (Amersham Biosiciences) according to the manufacturer’s instruction. The purified DNA is amplified the same way aforementioned. PCR products of each sample were sequenced then.
2.1.3 DNA analysis
choose from NCBI. These 3 out-group sequences are also in the order Dipteria, but in different families with our sample midges. SeqWeb is provided by NHRI and it’s also the internet surface of Winkinson Package.
Two analysis methods were used in our study, PileUp and Evolution.
Pileup function creates multiple alignments of several sequences. The multiple alignment procedure begins with the pairwise alignment of the two most similar sequences, producing a
cluster of two aligned sequences. This cluster can then be aligned to the next most related
sequence or cluster of aligned sequences. Two clusters of sequences can be aligned by a simple extension of the pairwise alignment of two individual sequences. The final alignment is achieved by a series of progressive, pairwise alignments that include increasingly dissimilar sequences and clusters, until all sequences have been included in the final pairwise alignment. Before alignment, the sequences are first clustered by similarity to produce a dendrogram, or tree representation of clustering relationships. It is this dendrogram that directs the order of the subsequent pairwise alignments.
In our analysis, the gap creation penalty is 5 and extension penalty is 1.
Evolution function investigates the relationships within a group of sequences. DNA sequences were analyzed by neighbor-joining method. (Saiton N, 1987 and UPGMA method. The arithmetic average of evolutionary distance was computed by Kimura 2-parameter. (Kimura, 1980). Several sequences which presumed to be in the same family were used as out
groups from NCBI.
Neighbor-Joining
This method is designed to find an approximation to the minimum evolution tree for a set of aligned sequences, using less computer time than the full algorithm for determining a minimum evolution tree. It works best when the distances are additive.
The neighbor-joining method clusters the sequences in a pairwise fashion. However, instead of picking the next pair to cluster by looking for the smallest distance in the distance matrix, this method seeks to form pairs that minimize the sum of the branch lengths for the entire tree. Therefore at each round of clustering, all possible pairs of entries are considered one at a time and the sum of the branch lengths for the resulting tree is calculated. The pairing that results in the smallest sum is the one that will be used to form the new cluster. This new cluster replaces its two constituent entries in the distance matrix (reducing the dimension of the distance matrix by one), and distances are calculated between the new cluster and the remaining entries in the distance matrix. The process continues until only two entries remain. The resulting tree is an unrooted tree. Because this method attempts to build an additive tree from the data, negative branch lengths may result if the distance data are not exactly additive
UPGMA
This method (Sneath and Sokal, Numerical Taxonomy, Freeman, San Francisco (1973)) can be used to estimate a species tree or gene tree when the expected rate of gene substitution is constant and the distance measure is linear with evolutionary time (for example, distance is measured as amino acid substitutions). The distances must be ultrametric to obtain a correct tree using this method.
The two sequences that have the smallest distance in the distance matrix are combined to form a cluster. That cluster replaces the original sequence pair as a single entry in the distance matrix (reducing the dimension of the matrix by one), and distances between the cluster and the other entries are calculated. The entries in the new matrix that have the smallest distance are combined to form a new cluster, and the process continues until only a single cluster remains. The resulting tree is a rooted tree.
Instead of using a simple average, the UPGMA method calculates the distances between a new cluster and the other entries in the distance matrix based on the total number of sequences in the cluster. If the new cluster C was formed by combining two clusters a and b, cluster a representing N(a) total sequences and cluster b representing N(b) total sequences, the distance
between the new cluster C and another entry k is:
distance(k,C) = [ distance(k,a) * N(a) + distance(k,b) * N(b) ] / (N(a) + N(b))
Kimura Two-Parameter Distance
This method applies only to nucleic acids and takes into consideration the fact that transition substitutions (purine-purine or pyrimidine-pyrimidine) often occur much more frequently than transversion substitutions (purine-pyrimidine). Gap positions and ambiguous symbols other than R (purine) and Y (pyrimidine) are not scored.
P = transitions / positions_scored Q = transversions / positions_scored
distance = -(1)/(2) ln[ (1 - 2P - Q) * sqrt(1 - 2Q) ] M. Kimura, J. Mol. Evol. 16; 111-120 (1980).
This method gives better distance estimates than the Jukes-Cantor method when the rates of transitional and transversional substitutions are different. However, when the substitution pattern is more complex than this, this method underestimates the true distance for distantly related sequences.
SeqWeb http://v8803.nhri.org.tw:8003/mgr.shtml NCBI http://www.ncbi.nlm.nih.gov/
2.2 Plant proteomics
The following plant proteomic experiments ware done by Hung-Pin Chen, my laboratory colleague. I collected and arranged his experimental data, and discuss these data together with my experimental data.
2.2.1 Sample collection:
Both plant galls and Machilus leaves are collected from Taiwan Fu-Shan Research Station (TFRI). Plant galls are commonly found on Machilus zuihoensis var. mushaensis,
Machilus zuihoensis var. zuihoensis, Machilus thunbergii, Machilus japonica, Machilus japonica kusanoi, Machilus philippinense, and Hamamelidaceae in TFRI. There are also
several different types of galls on each plant species as gall midge collection table shows [Table 1]. Among all types of galls and plant species, the most abundant galls are bell galls and mice galls on Machilus thunbergii, Machilus zuihoensis var. mushaensis, Machilus
zuihoensis var. zuihoensis. Therefore, we choose these two types of galls on three plant
species, which equal to six sample category as our material. [Fig. 4]
2.2.2 Plant Gall tissues processing
The freshly collected galls and plant stems including leaves are preserved in zipped bags and quickly sent to 4℃ refrigerator in laboratory. In no more than ten days after collection, we would cut these plant galls by dissection knife and pick out the larvae by needles. We also slice away some plant tissues which near the larvae, in order to reduce the chance of contamination. The processed plant gall tissues can be used in following experiment steps right away or preserved in -80℃ refrigerator for future use.
2.2.3 Plant Leaves processing
-80℃ refrigerator if not being used for 2-D electrophoresis right away. Preserve the stems alone with plant leaves is to maintain the freshness of leaves.
2.2.4 Plant tissue powder preparation
We adapted the method from Wang, 2003, Electrophoresis (Wei Wang, 2003). First we ground our sample tissue with liquid N2 in stainless steel mortar and pestle. Then put 0.2g dry tissue powder into 2.0ml microtubes, added 1-2ml cold acetone vortexing thoroughly for 30s. The mixture was centrifuged at 10000x g for 3 min at 4℃. Pour out acetone and repeat the above-mentioned steps for 2-3 times. The pellet was moved into mortar and dried at room temperature. The dried tissue pellet was ground into finer powder by adding quartz sand and then transferred into new microtubes. The fine tissue powder was sequentially rinsed with 10% cold TCA/acetone 3-4 times or until the supernatant is colorless. The powder was following rinsed with 10% TCA/H2O twice and cold 80% acetone twice. The pallet was vortexed and centrifuged as above-mentioned, and dried at room temperature. The dried powder can be use at following protein extraction and be stored at -80℃ refrigerator for future use.
2.2.5 Protein extraction & assay (phenol extraction) :
The dry tissue powder was resuspended in new 2.0ml microtubes with 0.8ml phenol buffer (Tris-buffered, pH 8.0, Sigma) and 0.8ml dense SDS buffer (30% sucrose, 2% SDS, 0.1M Tris-HCl, pH 8.0, 5% 2-mecaptoethanol), it was vortexed thoroughly for 30s then centrifuged at 10000x g for 3 min. The separated upper layer phenol was removed by pipette into fresh new microtubes, and be sure not to disturb the white interface SDS complex if there appeared any. At least 5-folds volume of cold 0.1M ammonium acetate/methanol was added into the phenol phase and stored in -20℃ refrigerator for 30 min. The precipitated proteins were centrifuged at 10000x g for 5 min to recover, and were poured out the upper layer cold
ammonium/methanol. The pellet was sequentially washed twice each with cold ammonium/methanol and 80% acetone acetate. The protein precipitate was dried at room temperature and dissolve in 2-DE rehydration buffer. (8M urea, 2%CHAPS, 0.5% IPG buffer, 0.002% bromophenol blue stock solution). The concentration of protein extracts were estimated by RC DC protein assay kit (Bio Rad), following it’s manual under 750nm.
2.2.6 2D-electrophoresis
2-DE was performed by a commercially available Ettan IPGphor IEF system and Hoefer SE600 Ruby (gel size 13cm x 15cm) from Amersham. The protein extracts were separated using gel strips and formed and immobilized nonlinear pH gradient from 3-10 (Immobiline Drystrip, pH3-10NL, 13cm, Amersham). Analytical IPG strips were rehydrated for 12h at 20℃ 30V with 250μL of the rehydration buffer including 100μg of protein extracts. IEF was performed at 20℃ in the Ettan IPGphor system (Amersham) for 1h at 500 V, 1h at 1000 V, 1h at 4000 V, and 2h at 8000V. Prior to the second dimension, the strips were equilibrated for 2 x 15 min in equilibration solution containing 6M urea, 75 mM Tris-HCl (pH 8.8), 29.3% v/v glycerol, 2% SDS, 0.002% bromophenol blue. DTT (1% w/v) was added to the first equilibration solution and 2.5 w/v iodoacetamide was added to the second one. For the second dimension, the strips were transferred onto SDS polyacrylamide gels (12.5%) with a run of 50mA per gel for 4-5h at 4℃. The 2DE gels were made in triplicate and sample proteins were from two independent extractions.
2.2.7 Protein staining and analysis of 2-DE gels
After electrophoresis, proteins were visualized by a modified silver-staining kit (Yan, J.S., 2000). Digital images of the gels were obtained by using an ImageScanner and were analyzed using ImageMaster 2D v3.1 elite software (Amersham). The spots were detected and the background was subtracted (mode: average on boundary), and the 2-DE gels were aligned
and matched. A quantitative determination of the spot volumes was performed (mode: total spot volume normalization). Specific spots were described during different treatments when their volumes significantly differed (at least ten-fold in relative abundance). The interesting proteins were identified by ESI-Q-TOF-MS analysis.
2.2.8 Protein identification by MS
For MS analysis, protein spots were excised from the gel and digested with trypsin according to published procedures ( Shevchenko, 1996). 34 labeled protein spots were sent to professor Chao-Hsiung Lin’s laboratory in NYMU for Mass Spectrometric analysis. Proteins were identified by searching the protein databases NCBInr using MASCOT
(http://www.matrixscience.com). To denote a protein as unambiguously identified, the Mowse scoring algorithms were sued. Only proteins whose score exceeded the significance threshold are discussed.
3. Result
3.1 Insect gene molecular evolution
In past studies, scientists regarded cecidomyiidae midges as highly host specific species (Harris, 1994). Cecidomyiidae midges are very fragile small insects usually only 2-3 mm. in length and many are less than 1 mm long. Unlike some gall-inducing insects of other plant species, most of Cecidomyiidae midges are unknown species and it’s hard to classify them by their appearance. In order to solve this problem, we adopt the molecular classification method and use both COI and 12S mitochondria gene.
3.1.1 Gall Midge COI gene sequence alignment
In PileUp dendrogram, Distance along the vertical axis is proportional to the difference between sequences; distance along the horizontal axis has no significance at all. In fig 5, COI sequence alignment, we can see several major clusters. Since it’s PileUp function in SeqWeb, the final output dendrogram is unrooted, and branch length has no meaning. There are 35 sample sequences and 3 out-group sequences. We choose these 3 out-group sequences from NCBI, All insects, which make same type of galls were grouped together. The first is constituted by same out-group species as 12s, Asphondylia sphaera, Asphondylia gennadii, and Asphondylis itoi. Second cluster is 3 blister morphospecies, which includes mj-blister56, mo-blister76, and mt-blister36. The third cluster includes 3 bulb morphospecies, they are mjk-bulb45, mj-bulb55, and m-bulb25. The forth cluster concludes 7 bullet morphospecies, which formed 3 small groups, each are mt-bullet39, mj-bullet59, mz-bulet10, mm-bullet29, mo-bullet79, mjk-bullet49, and mp-bullet69. The fifth cluster is made of 5 mice morphospecies, they are mj-mice51, mjk-mice41, mt-mice31, mz-mice11, and mm-mice21. The sixth cluster is mixed with 4 bell, 5 club, and 1 bird morphospecies. They are mt-bell32, mm-bell22, mjk-bell42, mt-club34, mo-club74, mp-club64, mk-bird83, mz-bell12, mj-club54,
mjk-club44. Although in total they form a big cluster, but each different gall-making midges also grouped together to form smaller clusters. The seventh cluster contains 5 spindle morphospecies, which are mp-spindle68, mt-spindle38, mm-spindle28, mz-spindle18, and mj-spindle58and. The eighth cluster is 2 bud species, mz-bud17 and mt-bud37.
3.1.2 Gall midge 12s gene sequence alignment
In fig 6, 12s sequence alignment, we can see almost all the insects which make same type of galls were also grouped together. There are 28 sample sequences, 3 out-group sequences. All the sequences were clearly divided into 7 big clusters. The first cluster is 2 bud morphospecies grouped together, mt-bud37 and mz-bud37. The second cluster includes 4 spindle morphospecies, mz-spindle28 grouped with mm-spindle28; mj-spindle58, and mp-spindle68. The third cluster is 3 out-groups downloaded from NCBI, and these are also midges in the Cecidomyiidae family. The fourth cluster includes 3 bulb morphospecies, mm-bulb25 grouped with mj-bulb55, and mz-bulb15. The fifth cluster is 5 mice morphospecies, mjk-mice41 grouped with mt-mice31; mj-mice51 grouped with mz-mice11, and mm-mice21. The only exception is group six, which contains both 3 club morphospecies and 4 bell morphospecies while other cluster only contains same midges which made same types of galls. Sequences included in the sixth cluster are mj-club54, which grouped with bell12; mt-bell32 grouped with mjk-bell42 and mm-bell22; mo-clu74 grouped with mt-club34. The last cluster includes 7 bullet morphospecies, mt-bullet39 grouped with mj-bullet59; mz-bullet19 grouped with mz-bullet29; mp-bullet 69 grouped with mjk-bullet49 and mo-bullet79.
3.1.3 Gall midge COI gene evolutionary tree
The “Evolution” function in Seqweb investigates the evolutionary relationships within a group of sequences. It aligns a group of sequences, create a table of pairwise distances based
on the aligned sequences, and create a tree graph representing the sequence relationships. In fig 7, COI gene evolutionary tree, the bar labeled with 10.00 at the bottom is branch length unit, it is a measure unit of all branch length. It means “10 substitutions per 100 residues”. There are 7 major clades and two independent sequences, which are mt-bud37 and mz-bud17. These insects which make same types of galls are grouped together.
The first clade consists of 3 out-group species, Asphondylia sphaera, Asphondylia
gennadii, and Asphondylis itoi. Their sequence divergences are 12.94%, 14.13% and 16.02%.
The second clade consists of all blister morphospecies, which are mj-blister56, mt-blister36, mo-blister76. Their sequence divergences are 22.50%, 19.51%, and 27.95%. The third clade includes all spindle morphospecies, and it can be divided into two small clades. All sequence divergences in this clade range from 0.25% to 11.86%. The first small clade consist of mp-spindle68, mt-spindle38, and their sequence divergence is 0.25%. The second small clade consists of mm-spindle68, mz-spindle28, and mj-spindle58. Their sequence divergences are 0.51% and 2.05%.
The fourth clade consists of all bulb morphospecies, which are mjk-bulb45, mj-bulb55, mm-bulb25. The sequence divergences are 2.83%, 9.43%, 9.73%. The fifth clade consists of all bullet morphospecies, and it can be divided into three small clades. Sequence divergences among all sequences range from 0.51% to 6.65%. The first small clade consist of mz-bullet19, mm-bullet29, and their sequence divergence is 0.76%. The second small clade consists of mo-bullet79, mjk-bullet49, mp-bullet69, and their sequence divergences are 0.76%, 0.76%, and 0.51%. The third small clade consists of mt-bullet39, mj-bullet59, and their sequence divergence is 6.60%.
The sixth clade consists of all sequences of mice morphospecies, which are mj-mice51, mz-mice11, mjk-mice41, mt-mice31, and mm-mice21. Their sequence divergences are 0.25%, 2.58% and 2.84%. The seventh clade consists of three different gall-making midges, which are mt-bell32, mm-bell22, mjk-bell42, mz-bell12, mt-club34, mo-club74, mk-bird83,
mp-club64, mj-club54, mjk-club44. The first three sequences are totally the same, and all sequence divergences range from 0.51% to 2.84%.
3.1.4 Gall midge 12s gene evolutionary tree
Same with 3.1.3 COI evolutionary tree, we used the “Evolution” function in SeqWeb to get our result. The bar labeled with 10.00 at the bottom is branch length unit, it is a measure unit of all branch length. It means “10 substitutions per 100 residues”. In fig 8, 12s gene evolutionary tree, there are 28 sample sequences and 3 out-group sequences, witch constitute seven major clades.
The first clade is made of mt-bud37, mz-bud 17, and their sequence divergence is 0.61%. The second clade has 4 spindle sequences, mz-spindle18, mm-spindle28, mj-spindle58, mp-spindle68, the sequence divergence ranges form 0.31% to 8.12%. It can be divided into two small clades. The first clade consists of mz-spindl18, mm-spindle28, and the sequence divergence is 0.31%. The second clade consists of mj-spindle58, mp-spindle68, and the sequence divergence is 5.76%.
The third clade consisted of 3 out-group sequences, Asphondylia sphaera, Asphondylia
gennadii, and Asphondylis itoi. Their sequence divergences are 14.88%, 15.89%, and 18.33%.
The fourth group consists of three bulb morphospecies, they are mm-bulb25, mj-bulb55, and mz-bulb15. Their sequence divergences are 5.83%, 12.19%, and 16.68%. The fifth clade is bullet morphospecies, which includes mt-bullet39, mj-bullet59, mp-bullet69, mjk-bullet49, mo-bulle79, mz-bullet19, and mm-bullet29. They can be divided into three small clades, and all the sequence divergence ranges from 1.92% to 13.63%. The first small clade consists of mt-bullet49, mj-bullet59, and the sequence divergence is 2.61%. The second small clade consists of mp-bullet69, mjk-bullet49, mo-bllet79, and their sequence divergences are 0.95%, 1.92%, and 2.25%.
mz-mice11, and mm-mice21. Their sequence divergence ranges from 0.95% to 13.63%. It can also be divided into three small clades. The first small clade consists of mjk-mice41, mt-mice31, and the sequence divergence is 0.64%. The second small clade consists of mj-mice51, mz-mice11, and sequence divergence is 3.96%. The last clade is mm-mice21, the average sequence divergence between it among others is about 10%.
The last clade consists of bell- and club morphospecies, they are mt-bell32, mm-bell22, mjk-bell42, mo-club74, mt-club34, mj-club54, and mz-bell12. This clade can be divided further into two small clades, one consists of mt-bell32, mm-bell22, mjk-bell42, and sequence divergences range from 0.63% to 1.59%. The other group consists of mo-club74, mt-club34, mj-club54, and mz-bell12, and sequence divergences range from 2.89% to 4.87%.
3.1.5 Gall midge evolutionary relationships
Besides midge taxonomy, we also want to know the evolutionary relationships between each midge tribe, genus and species. Therefore, we use UPGMA method in evolutionary analysis and get an ultrametric tree. There are differences between NJ-tree and UPGMA-tree. First, ultrametric trees are rooted trees while NJ-trees are unrooted. Second, ultrametric trees are rooted trees in which all the end nodes are equidistant from the root of the tree. The branch length in NJ-tree indicates the genetic change and the relationships between taxa, but the branch length of an ultrametric tree is proportional to the divergent time. Therefore, we use UPGMA-tree to analyse the phylogeny and evolutionary relationship between gall midges.
In figure 9, COI gene evolutionary tree-UPGMA, we added another two Drosophila species as out-group besides the original 3 out-groups we used, in order to identify the root of all gall midges. Generally speaking, midges in the same clade make same type of galls. The root of gall midges is in the middle of blister morphospecies and other gall-making midges. In the compounded group of gall-making midges, the node divided into mt-bud37 and other
gall-making midges, which forms one big clade. Then the big clade divided into two second big clades. One contains spindle morphospecies, mz-bud17, and out-group insects; the other clade contains bulb, bullet, mice, bell, club, and bird morphospecies. Then the bulb morphospecies divided from other gall-making midges. In the remaining clade, mt-bullet39 and mj-bullet59 divided from other gall-making midges. In the remaining clade, there are three major groups: bullet morphospecies, mice morphospecies and a last group, which contains bell, club, and bird morphospecies.
In figure 10, 12S gene evolutionary tree-UPGMA, we also added two Drosophila species as additional out-groups in order to determine the root of gall midges. The outcome is as same as COI gene evolutionary tree-UPGMA, midges in the same clade make same type of galls. The root, which means the ancestral species, diversified into two clades. The clade at right contains bud and spindle-making midges; the clade at left contains other gall making midges and the original out-groups. In the left clade, out-group species diversified first, then diversified bulb morphospecies. In the remaining clade, which contains mice, bell, club, and bullet morphospecies, divided into two little clades. The little clade at left contains all bullet morphospecies. The little clade at right divided into another two little clades, one is mice morphospecies; the other contains bell and club gall making midges.
3.1.6 Gall midge larvae morphology anatomy and gene analysis
In Dr. Tung’s research in TFRI, the anatomical structures of all midge larvae can be classified into 4 types according to their spatula and anus. (Table 3, Table 4) In type I, there are two salient parts on larva’s spatula and no terminal papillae on anus. In type II, the button part of larva’s spatula is healed but the top of spatula is crotched. The shape of anus looks like a peach. In type III, the spatula shaped like chisel, and there are terminal papillae on anus. In type IV, the spatula is shorter than other type’s spatula, but the middle part of it is bigger. The anus forms two segments but there is only one segment has papillae. Each larva in each type
of galls can be classified into one type.
Among all four types of larvae, the type one larvae are the largest group. It contains all bulb-, bullet-, mice-, bell-, club-, and bird-gall-making-midges. Type two larvae only contains mt-bud37 midge. Type three larvae include mz-bud17, and all blister morphospecies. Type four larvae contain all spindle morphospecies.
We combine this morphological anatomy result with gene sequence analysis, (fig 5-8) and we also put sketches of gall types on this diagram.
From these diagrams, we can clearly see that midges with same anatomical structures were grouped together. In previous experiments, we know that midges which made same types of galls are closer species, or even same species. Therefore, the anatomical structures are the same among midges which made same types of galls.
3.2 Plant Proteomics
These plant proteomic experiments ware done by Hung-Pin Chen, my laboratory colleague. I collected and arranged his experimental data, and discuss these data together with my experimental data.
In order to analyse the impacts on which gall-inducing insects cause to plants, we used 2-dimensional electrophoresis technique to study the protein changes and differences between gall tissues, galled leaves, and un-galled leaves. First, we compared galled and ungalled leaves to determine whether gall-inducing insect caused damage to health leaves or not. Second, we compared the protein pattern differences between three Machilus leaves for excluding the original differences existed between different Machilus leaves at further comparisons. Third, we compared the protein pattern difference between two types of galls on single Machilus leaves to understand whether theses two types of galls caused different impacts or not. Then, we compared same type of galls but grow on different Machilus. At last, we compared two types of gall-tissues and Machilus leaf tissues on each Machilus in order to figure out the common protein differences between gall tissues and leaf tissues. After all the analyses of protein patterns, we combined the results of gall-insect taxonomy and discussed together.
3.2.1 Comparison of galled and ungalled leaves
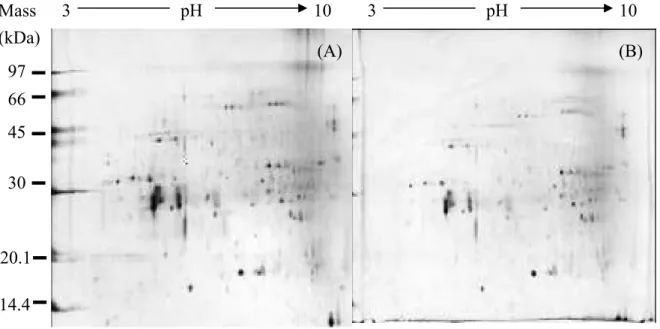
In figure 12, (A) is 2D image of protein pattern of healthy leaf tissues and (B) is protein pattern of galled leaf tissues. Both samples are from Machilus zuihoensis var. mushaensis (MM). Healthy leaf tissue means that there are no galls or other damages on leaf surface. Galled leaf means that there are galls on leaf surface, but we took the ungalled part of leaf tissue.
After comparing protein differences between galled and ungalled leaves, we compared the protein pattern differences among three Machilus leaves. Botanists regard these three
Machilus as different species, and we want to know whether there are protein differences
between them. Then we can exclude these difference proteins among gall tissues on different
Machilus, because these proteins are original differences between leaves.
In figure 13, (A) is the 2D image of Machilus zuihoensis var. zuihoensis. (MZ) leaf tissues (B) is 2D image of Machilus zuihoensis var. mushaensis.(MM) leaf tissues (C) is leaf tissues of Machilus thunbergii.(MT) Labeled protein spots of the gels are those differentially expressed by at least ten-fold in comparison with each other. We classified these three
Machilus leaves into three groups, (A) and (B), (B) and (C), (A) and (C), then we compared
leaf protein patterns with each other in each group.
As figure 13 shows, in group (A) (B), the different proteins are protein No. 1. in MT-leaf tissue (A), and protein No. 2, 3, 4, 5 in MM-leaf tissues (B). There are total 5 different proteins in this group.
In group (A) (C), the different proteins are protein No. 6-11 in MT-leaf tissues (A) and protein No. 12-25 in MZ-leaf tissues (C). There are total 20 different proteins in this group.
In group (B) (C), the different proteins are protein No.2, 4, 5, 6-11 in MM-leaf tissues (B) and protein No. 1, 12-25 in MZ-leaf tissues (C). There are total 24 different proteins in this group.
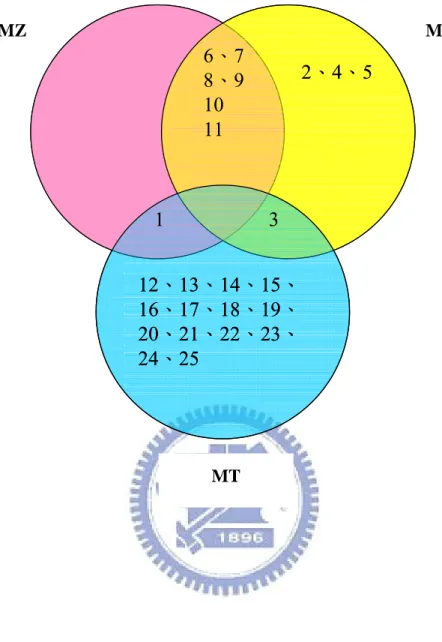
In figure 14, we made a three-circle graph of original protein differences among three
Machilus leaves. One circle represents one Machilus species, and in each circle are their own
proteins. We can clearly see that the protein differences between MZ and MM leaves are smaller than the differences between MM-MT, and MZ-MT. The protein patterns of MZ and MM leaves are alike, there are 6 proteins in both MZ and MM leaves which don’t appear in MT leaves (protein 6-11). There are 14 proteins, which only appear in MT leaves (protein 12-25). Protein 2, 4, and 5 only appear in MM leaves. There are no distinctive proteins which
only appear in MZ leaves.
3.2.3 Protein pattern differences between two types of gall on single Machilus leaves In this experiment, we analyzed the protein pattern differences between two types of gall on single Machilus leaves. In figure 15, each graph are 2D images of our samples. Samples were classified into three groups according to three Machilus species: (D) and (G), (E) and (H), (F) and (I). There are two types of galls in each group, bell gall and mice gall. (D) is bell-gall tissues of Machilus zuihoensis var. zuihoensis. (MZ-bell). (E) is bell-gall tissues of
Machilus zuihoensis var. mushaensis. (MM-bell). (F) is bell-gall tissues of Machilus thunbergii. (MT-bell) (G) is mice tissues of Machilus zuihoensis var. zuihoensis. (MZ-mice).
(H) is mice-gall tissues of Machilus zuihoensis var. mushaensis. (MM-mice). (I) is mice-gall tissues of Machilus thunbergii. (MT-mice).The protein spots labeled are those who differentially expressed by at least ten-fold in comparison with each other.
In group (D) (G), bell and mice galls on MZ, the different proteins are protein No. 34, 104, 105 in MZ-bell (D) and protein No. 29, 70, 71 in MZ-mice (G). There are total 6 different proteins in this group.
In group (E) (H), bell and mice galls on MM, the different proteins are protein No. 5, 37, 70 in MM-bell (E) and protein No. 34, 46 in MM-mice (H). There are total 5 different proteins in this group.
In group (F) (I), bell and mice galls on MZ, the different proteins are protein No. 65, 95, 102 in MT-mice (I), and there are no special protein in MT-bell (F). There are total 3 different proteins in this group.
As the result shows, there are little protein pattern differences between bell and mice galls, which grow on same Machilus species.
Next, we compared the protein pattern difference between bell galls on three Machilus leaves in order to see whether Machilus species affects gall tissues proteins. The bell-galls of three Machilus were classified into three groups, (D) and (E), (D) and (F), (E) and (F). In Fig. 16 and table 9, the bell-gall protein patterns were compared with each other. (D) is bell gall tissue of Machilus zuihoensis var. zuihoensis. (MZ-bell) (E) is bell gall tissues of Machilus
zuihoensis var. mushaensis.(MM-bell). (F) is bell gall tissues of Machilus thunbergii.
(MT-bell). Labeled protein spots of the gels are those differentially expressed by at least ten-fold in comparison with each other.
In group (D) (E), bell galls on MZ and MM, the different proteins are protein No. 34, 104, 105 in MZ-bell (D), and protein No, 29, 70, 71 in MM-bell (E). There are total 6 different proteins between bell gall tissues on MZ and MM.
In group (D) (F), bell galls on MZ and MT, the different proteins are protein No. 1, 11, 31, 32, 34, 37, 42, 84, 104, 105 in MZ-bell (D) and protein No. 22, 70, 92, 94, 103, 106 in MT-bell. There are total 16 different proteins between bell gall tissues on MZ and MT.
In group (E) (F), bell galls on MM and MT, the different proteins are protein No. 1, 11, 32, 37, 42, 71, 84, 87 in MM-bell (E) and protein No. 2, 92, 94, 103, 106 in MT-bell (F). There are total 13 different proteins between bell gall tissues on MM and MT.
3.2.5 Protein pattern differences between mice galls on three Machilus leaves
After comparing bell galls on three Machilus leaves, now we compared the protein pattern differences between mice galls on three Machilus leaves, in order to understand whether the effects of these two galls caused to plants are the same or not. In Fig. 17 and table 10, the mice galls of three Machilus were classified into three groups, (G) and (H), (G) and (I), (H) and (I). The 2D images of mice gall protein patterns were compared with each other. (G) is mice galls of Machilus zuihoensis var. zuihoensis. (MZ-mice). (H) is mice galls of
(MT-mice). Labeled protein spots of the gels are those differentially expressed by at least ten-fold in comparison with each other.
In group (G) (H), the different proteins are protein No. 1 in MZ-mice (G) and protein No. 4, 46, 59 in MM-mice (H). There are total 4 different proteins between mice gall tissues on MZ and MM.
In group (G) (I), the different proteins are protein No. 1, 11, 43, 45, 71, 84, 87 in MZ-mice gall tissues (G) and protein No. 12, 22, 62, 65, 89, 94, 102, 103, 106 in MT-mice gall tissues. There are total 16 different proteins between mice gall tissues on MZ and MT.
In group (H) (I), the different proteins are protein No. 4, 11, 34, 45, 59, 71, 84, 87 in MM-mice (H) and protein No. 22, 64, 65, 70, 94, 102, 103, 106 in MT-mice (I). There are total 16 different proteins between mice gall tissues on MM and MT.
3.2.6 Common protein pattern differences between gall tissues and leaf tissues
3.2.6.1 Protein pattern differences between bell-gall-tissues, mice-gall-tissues, and leaf tissues of Machilus zuihoensis var. zuihoensis. (MZ)
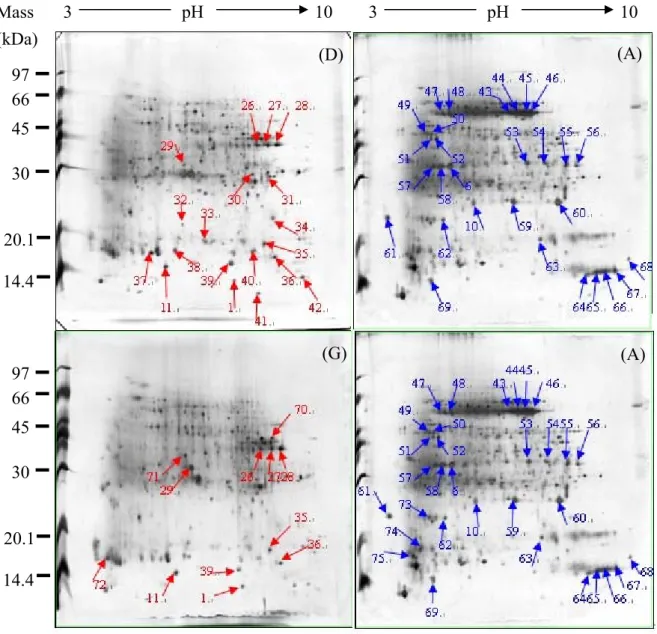
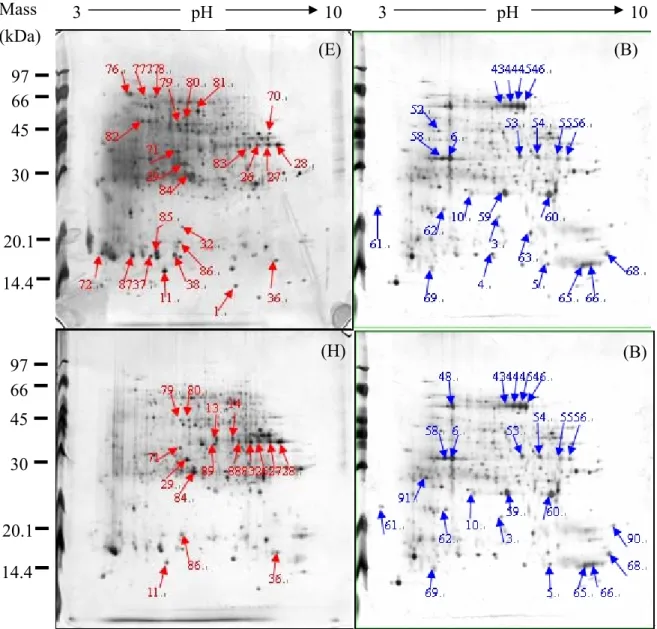
In Fig 18, we compared the protein pattern differences between each bell-gall-tissues and mice-gall-tissues with healthy leaf tissues of MZ. Photographs (D), (G), (A) are 2D images. (A) is leaf tissues of Machilus zuihoensis var. zuihoensis. (MZ-leaf). (D) is bell gall tissues of Machilus zuihoensis var. zuihoensis. (MZ-bell). (G) is mice gall tissues of Machilus zuihoensis var. zuihoensis. (MZ-mice). Labeled protein spots of the gels are those differentially expressed by at least ten-fold in comparison with each other.
In group (A) (D), the different proteins are protein No. 1, 11, 26-42 in MZ-bell-gall-tissues (D) and protein No. 6, 10, 43-69 in healthy MZ leaf tissues (A). There are total 48 different proteins between bell-gall-tissues and healthy leaf tissues.