705
F
ish stocks are known to extensively fluctu-ate over a large range of spatial and temporal scales (Cushing 1982, Laevastu 1993). Several biotic and abiotic processes, as well as their interactions, may induce such fluctuations. Environmental changes, such as variations in tem-perature, salinity, wind field, and currents, can affect both the productivity and distribution of fishstocks (Southward et al. 1988, Dickson and Brander 1993, Alheit and Hagen 1997, Lehodey et al. 1997). Temperature controls the maximum rate at which chemical reactions can occur (Wootton 1992). Changes in temperature have direct effects on all aspects of the metabolism of fishes (Brett and Groves 1979, Graham 1983). The vari-ous processes of metabolism have different
opti-Geographical Distribution and Abundance of Pacific Saury, Cololabis
saira (Brevoort) (Scomberesocidae), Fishing Stocks in the
Northwestern Pacific in Relation to Sea Temperatures
Wen-Bin Huang1,*, Nancy C.H. Lo2, Tai-Sheng Chiu3, and Chih-Shin Chen4
1Graduate Institute of Biological Resources and Technology, National Hualien University of Education, Hualien 970, Taiwan
2Southwest Fisheries Science Center, National Marine Fisheries Service, National Oceanic and Atmospheric Administration, La Jolla, CA 92037, USA
3Institute of Zoology, National Taiwan University, Taipei 106, Taiwan 4Institute of Fishery Biology, National Taiwan University, Taipei 106, Taiwan (Accepted June 12, 2007)
Wen-Bin Huang, Nancy C.H. Lo, Tai-Sheng Chiu, and Chih-Shin Chen (2007) Geographical distribution and abundance of Pacific saury, Cololabis saira (Brevoort) (Scomberesocidae), fishing stocks in the northwestern Pacific in relation to sea temperatures. Zoological Studies 46(6): 705-716. We compared geographical distrib-utions of Pacific saury, Cololabis saira (Brevoort) (Scomberesocidae), fishing stocks in the Northwest Pacific (NWP) for 3 yearly groups of high, average, and low abundances, using the Taiwanese fishery catch per unit effort (CPUE) data from 1994 to 2002. Two migratory groups, inshore and offshore, were found in average-and low-abundance years, while an additional oceanic migratory group, which spread eastward to around 178
°
E in Oct., was found in the year of high abundance. Most of the saury groups were distributed in areas where the sea surface temperature (SST) ranged between 10 and 20°
C with a high aggregation around 15°
C,implying that 15
°
C is the preferred temperature for saury to aggregate intensively for the commencement of the spawning migration, and to move southward to spawning grounds where SSTs of around 20°
C are favorable to their offspring. The timing, abundance, and geographical distributions of fish aggregations of migratory saury were associated with SSTs. In the early stages of the fishing season, apparent warming caused by the intru-sion of Kuroshio Current waters in the southern NWP was closely related to delayed aggregation and low abun-dances of the saury stock; in contrast, cooling of the waters affected by Oyashio waters was related to east-ward aggregation and high abundances of saury. High saury abundances occurred in low-temperature areas. Specifically, in years of low CPUE values, sea water temperatures (SWTs) of the fishing grounds were higher than 15°
C, while in years of average and high CPUE values, the SWTs of the fishing grounds were < 15°
C.Therefore, fishing ground SWTs higher than 15
°
C (around 16°
C SST) is an indicator of low stock abundances of saury in the NWP. http://zoolstud.sinica.edu.tw/Journals/46.6/705.pdfKey words: Geographical information system, Sea surface temperature, Cololabis saira, Fishing ground, Taiwan.
*To whom correspondence and reprint requests should be addressed. Tel: 886-3-8227106 ext. 2261. Fax: 886-3-8236935.
mum temperatures (Eilliott 1981). Fish can detect temperature gradients in the water, which allows them to exert some behavioral control over their body temperature by selecting a range of tempera-tures in which to live (Wootton 1992). In addition, frontal areas, determined by temperature, are the favored conditions for migratory paths of marine fishes (Leggett and Whitney 1972, Laurs and Lynn 1977, Saitoh et al. 1986). Understanding a fish,s preferred temperatures and its effects on that species, distribution and abundance is a useful tool in fisheries management.
Pacific saury, Cololabis saira (Brevoort), is a major pelagic commercial fish in the Far East, par-ticularly for Japan (Fukushima 1979, FAO 2006) and Taiwan (FAO 2006). Saury abundances exhibit large inter-annual variations (Fukushima 1979). Annual catches of saury in Japan are the largest in the world and have fluctuated greatly from 575,000 metric tons (mt) in 1958 to 63,000 mt in 1969, with an annual average of about 258,000 mt over the last half century (FAO 2006). Saury is also an important target of the Taiwanese stick-held dipnet fishery in the same waters. The annu-al catches in Taiwan have fluctuated between 8100 and 23,000 mt during 1985-1999 with an average of about 13,300 mt (FAO 2006). However, the recent catch increased exponentially from 27,900 mt in 2000 to 91,500 mt in 2003 and 60,800 mt in 2004. The mean catch (51,000 mt) of these 4 yr makes Taiwan the 2nd-largest saury harvesting country, after Japan (FAO 2006). Human exploita-tion has been documented to influence fish dynamics and abundances, mainly through over-fishing (e.g., Cook et al. 1997, Jennings et al. 1998, Hutchings 2000). It is important to better understand the factors influencing fluctuations in the catch, abundances, and migration patterns of saury by analyzing fisheries data from fishing countries in order to improve forecasts of stock conditions. To the present, catch data from Taiwan have largely been unexamined.
Pacific saury is a scomberesocid fish distrib-uted widely in the subartic and subtropical North Pacific Ocean (Hubbs and Wisner 1980). Its adults, juveniles, and larvae show a continuous distribution from the inshore waters of Japan to distant waters of 175
°
E in the western and central North Pacific (Watanabe and Lo 1989). Saury migrates extensively between the summer feeding grounds in Oyashio waters around Hokkaido and the Kuril Is. and the winter spawning grounds in the Kuroshio Current waters off southern Japan (Fukushima 1979, Watanabe et al. 1997, Kosaka2000). The annual migration allows the fish to maximum its utilization of planktonic food resources in correspondence with summer plank-ton blooms in Oyashio waters (Odate 1994, Sugisaki and Kurita 2004). Pacific saury has a lifespan of 1-2 yr (Watanabe et al. 1988, Suyama et al. 1996) and achieves a 30 cm adult size in about 1 yr (Watanabe et al. 1988). Most of the adults become sexually mature and are ready to spawn during this southerly migration in autumn and winter (Kosaka 2000, Kurita 2001). The saury fishing season, coinciding with this migration peri-od, generally begins in Aug. and continues through mid-Dec. (Fukushima 1979, Yamamura 1997). In addition to the importance as a fishery, Pacific saury also plays an important role in the NWP ecosystem as a predator of zooplankton (Odate 1994) and as prey for ichthyophagous fishes, sea birds, and marine mammals (Chikuni 1985, Tamura et al. 1998, Springer et al. 1999).
The annual migratory patterns of the Pacific saury in the northwestern Pacific (NWP) have been proposed in several documents (e.g., Itô et al. 2004, Tian et al. 2004). Temperature is a domi-nant factor in determining saury abundances (Tian et al. 2003) and migratory paths (Saitoh et al. 1986). Saury is typically distributed in the surface layer with water temperatures higher than 6.5
°
C (Pavlychev 1977, Sablin and Pavlychev 1982), and probably cannot tolerate lower temper-atures below the thermocline (Yamamura 1997). The surrounding cold water of Kuroshio warm-core rings is important as a migratory route of the saury (Saitoh et al. 1986). Saury abundances are direct-ly affected by sea surface temperatures (SSTs) (Tian et al. 2003). It is generally thought that the saury population is composed of autumn-, winter-, and spring-spawned cohorts (Fukushima et al. 1990, Watanabe et al. 1997). The SSTs in the Kuroshio region are affected by decadal changes and El Niño Southern Oscillation (ENSO) events, and play important roles in the recruitment of the winter spawning cohort (Kurita 2001), resulting in large inter-annual variations in saury abundances (Tian et al. 2004). However, ranges of tempera-ture selected by the saury for the spawning migra-tory aggregation and temperature effects on geo-graphical variations of aggregative abundances are still not well understood. The objectives of this study were to examine the geographical variations in aggregations and abundances of saury stocks among various stock-abundance years in the NWP using the Taiwanese catch data, and to examine their relationships with sea temperature andmigra-tion patterns.
MATERIALS AND METHODS Data sources
Taiwanese saury fishery data were provided by the Overseas Fisheries Development Council of the Republic of China, Taipei, Taiwan. These data are recorded daily and were compiled from log-books submitted by skippers of Taiwanese stick-held dipnet fishing vessels, operating in the NWP from 1994 to 2002. Sea water temperature (SWT) was measured by a thermometer under the vessel when fishing was underway. Considering that SWTs were recorded only at the place of fishing operations, SSTs were used to illustrate geograph-ical changes in sea temperature throughout the NWP for comparing changes in fish abundances and distributions. SST data were obtained from the website of the Physical Oceanography Distributed Active Archive Center (PODAAC). They were derived from Advanced Very High Resolution Radiometers (AVHRRs) onboard NOAA-series polar-orbiting satellites. Images of the SST data were recorded daily at a spatial reso-lution of 54 km (about 0.5
°
) per pixel. Error esti-mates for the SST data range between 0.3 and 0.5°
C. Daily SST data of the area at 140-180°
E and 30-50°
N in the NWP, corresponding to the area of the saury fisheries data, were extracted from the images for this study.Data analysis
Catch per unit effort data (CPUE) is used to estimate changes in stock abundance (Gulland 1983). For saury, the CPUE is a good index of abundance in weight (Ebisawa and Sunou 1999) and has been used for stock assessments in previ-ous studies (e.g., Saitoh et al. 1986, Tian et al. 2003 2004). In our study, the CPUE was used as an abundance index of the saury, on the basis of metric tons (mt) of the catch per day per vessel (mt/d/vessel). The CPUE and SST data were con-verted into 1
°
means and referred geographically into a grid comprising cells of 1°
latitude by 1°
lon-gitude. Thus, an 800-grid cell database (20 and 40 grid cells of latitude and longitude, respectively) for the CPUE and SST was constructed from 140 to 180°
E and 30 to 50°
N. MapInfo Professional 6.0 (MapInfo Corporation, Troy, NY) was used to create the CPUE and SST spatial distributionmaps, allowing the overlay and analysis of biologi-cal and oceanographic spatial data, to assess the effects of SSTs on stock abundances and migrato-ry patterns of the fish. Before being incorporated into the MapInfo software, SST contours were pre-pared using the Kriging grid method of the SUFER software (Golden Software, Golden, CO). Kriging is a geostatistical method for spatial interpolation of a set of weighted linear combinations of avail-able data observed at known locations (Burrough and McDonnell, 1998). This method uses a vari-ogram to express spatial variations, and it mini-mizes the error of predicted values which are esti-mated by the spatial distribution of predicted val-ues.
The fishing grounds for Taiwanese fishing vessels in the NWP were from 35 to 47
°
N and 141 to 178°
E (Fig. 1), which generally covered the saury migratory route, including the Oyashio waters, Kuroshio-Oyashio transition waters, and Kuroshio Extension waters. The Oyashio front and Kuroshio Extension are defined as the area of 5°
C at 100 m depth (Kawai 1972a) and 14°
C at 200 m depth (Kawai 1972b), which roughly corre-sponds to the 7 and 18°
C SST contours in May, respectively (Shimizu et al. 2001, Watanabe et al. 2003). The oceanic-geographical variations in SST and SWT were used as indices to describe the oceanic current system changes, including the Oyashio front and Kuroshio Extension and their transitional waters. The former 2 are shown approximately by 10 and 20°
C SST contours, respectively, from July to Nov. in this study.Planktonic food resources are one of the important factors guiding the annual migration route of Pacific saury (Odate 1994, Sugisaki and Kurita 2004). In the continental shelf region, the proximity to land and the shallowness of the waters ensure that they are productive; in contrast, the open ocean is a more-homogeneous environ-ment with low rates of primary production (Wootton 1992). The study area was therefore divided into 3 eco-regions: continental shelf and slope (CSS), abyssal plain (AP), and abyssal mountains (AM), according to the bathymetric (depth) contours derived from the Centenary Edition of the GEBCO (General Bathymetric Chart of the Oceans) Digital
Atlas (IOC et al. 2003) (Fig. 1). The AP region is a
transition zone of the Oyashio and Kuroshio Currents. Basically, these 3 eco-regions roughly correspond to areas on the west side of the Kuril and Japan Trenches, Northwest Pacific basin, and Emperor Seamount Chain, respectively.
understand differences between high- and low-abundance (catch) years of the fishing stocks. For this purpose, a generalized linear model (GLM) with post hoc comparison was applied to pick out high- and low-abundance years of saury stocks. The GLM partitions the total variance of CPUE val-ues into measures of differences among the 3 fac-tors of years, months, and eco-regions with the model, log(CPUE + 1) = µ + a(Year) + b(Month) + c(Eco-region) + ε, where µ, a, b, and c are regression coefficients, and ε is the error compo-nent in the model. Multiple-range tests of the least-significant difference (LSD) were used to obtain the largest/lowest homogeneous CPUE groups among the factors. Spearman,s rank cor-relation was calculated to evaluate the cor-relationship between CPUE values and temperatures. Seven-day-averaged values in a scale of 1
°
x 1°
square, which were logarithmically transformed, were used in the analysis. Statistical analyses were per-formed using SPSS 10.0 for Widows (SPSS, Chicago, IL).RESULTS Factorial effects on CPUE values
SST and SWT had significantly negative cor-relations to the CPUE, based on the 7-d-averaged values on a scale of 1
°
x 1°
square (SST: r = -0.10, n = 1938, p < 0.001; SWT: r = -0.20, n = 1981, p < 0.001). The SST had a significant posi-tive correlation with the SWT (r = 0.526, n = 1845,p < 0.001). Their relationship was thus
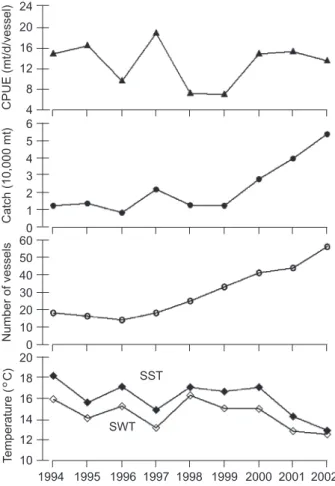
estab-lished by a linear regression equation, SST = 0.662 SWT + 6.200 (r2 = 0.24, n = 1845, p < 0.001). Annual SST and SWT values were not significantly correlated with the annual CPUE in the fishing grounds (p > 0.05) (Fig. 2). The mean of the annual CPUE during the study years was 13.1 mt/d/vessel, and the lowest and highest CPUE values were found in 1998-1999 (7.1-7.2 mt/d/vessel) and 1997 (18.9 mt/d/vessel), respec-tively (Fig. 2). In addition, the annual CPUE was not significantly correlated with either the catch or the number of fishing vessels (p > 0.05).
CPUE values were significantly affected by all of the factors of years, months, and eco-regions and their interactions (Table 1). In order to exam-ine the monthly and eco-regional differences among the various (high and low) abundance years, the 9 study years were then separated into 3 yearly groups of high, low, and average CPUE values (stock abundances). The highest CPUE
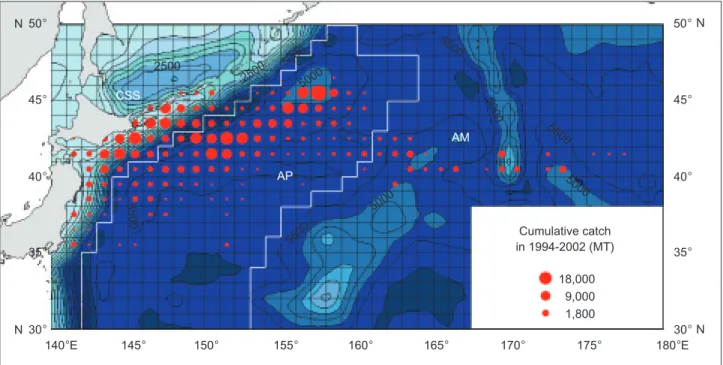
Fig. 1. Spatial distribution of the cumulative catch for Pacific saury during 1994-2002 in the northwestern Pacific from Taiwanese saury fishery with relevant bathymetric contours. The circle size represents quantiles of the cumulative catch. An interval of the dotted iso-bath lines is 500 m. The regional classification that corresponds to the benthic topography was used to subdivide the catch data for eco-region analyses. There are 3 eco-regions: continental shelf and slope (CSS), abyssal plain (AP), and abyssal mountains (AM).
Cumulative catch in 1994-2002 (MT) 18,000 9,000 1,800 50° 50° 45° 40° 35° 30° 45° 40° 35° 30° 140°E 145° 150° 155° 160° 165° 170° 175° 180°E N N N N 2500 CSS AP AM 2500 5000 5000 5000 50 00 5500 5500 5000 5500 55 0 0
year (1997) and lowest CPUE years (1998 and 1999), were determined from the LSD test (Table 1), and are referred as the year of high and years of low CPUE values, respectively. The other years in the studied period (1994-1996 and 2000-2002) were referred to the years of average CPUE val-ues.
Temporal and eco-regional effects on CPUE values
Two migratory groups, 1 inshore and 1 off-shore, of the saury stocks were found in the 3 yearly groups of various CPUE values (Fig. 3). In the years of average CPUE values, the saury stocks began to aggregate for migration in July in the AP region at around 155-159
°
E, 43-45°
N (1st column of figure 3). The aggregation group divid-ed into 2 linkdivid-ed groups in Aug. to Nov. During this period, 1 group moved southwestward to the CSS region at around 142-148°
E, 41-45°
N, and is called the inshore migratory group. The other group moved southward to the AP region at around 148-158°
E, 40-45°
N, and is called the off-shore migratory group. In Nov., these 2 groups moved southward to the CSS region at around 141-145°
E, 37-42°
N and the AP region around 148-152°
E, 37-42°
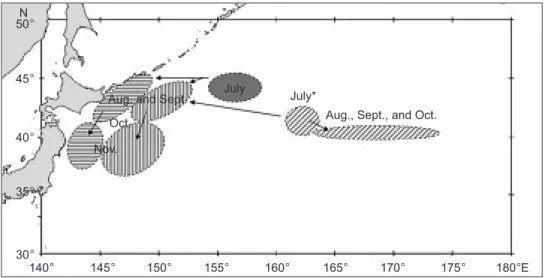
N, respectively. By Dec., the fish had dispersed and fishing had stopped. Asummary scheme for these 2 migratory groups of saury stocks from July to Nov. is illustrated in fig-ure 4.
The migration patterns of these 2 migratory groups of saury in years of low and high CPUE values differed from those in years of average CPUE values, and an additional oceanic migratory group was found in years of high CPUE values (Fig. 3). In years of low CPUE values, saury stocks did not evidently aggregate for migration in the AP region until Aug. (2nd column in figure 3). From Aug. to Oct., the saury stock moved as in years of average CPUE values but in smaller groups. In Nov., the stock moved southward to around 35
°
N. In years of high CPUE values, the saury stock began to aggregate in July, as in years of average CPUE values but in larger groups (last column in figure 3), in the AM region around 160-165°
E, 40-43°
N, east-southeast of the AP region occupied in years of average CPUE values. The saury divided into 3 groups: 2 linked and 1 sepa-rated. The former 2 moved as in years of average CPUE values from Aug. to Oct. (Fig. 4), but in Nov., the groups became smaller and moved far-ther northward to around 40°
N and dispersed. The latter group occurred in the AM region from Aug. to Oct., and is called the oceanic migratory group (last column in figures 3 and 4). It spread to an area around 178°
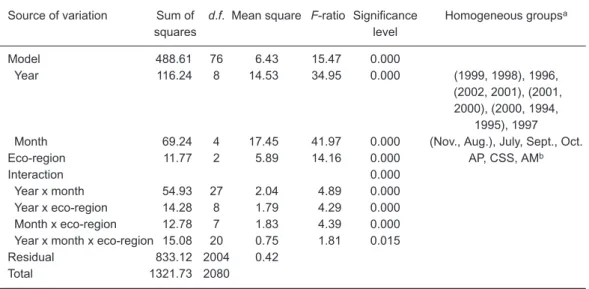
E and dispersed in Oct. Table 1. Analysis of variance of the catch per unit of effort (CPUE, metric tons/d/vessel) of Pacific saury in the Northwest Pacific on the factorial effects of year, month, and eco-region, using Taiwanese fishery data from 1994 to 2002Source of variation Sum of d.f. Mean square F-ratio Significance Homogeneous groupsa
squares level Model 488.61 76 6.43 15.47 0.000 Year 116.24 8 14.53 34.95 0.000 (1999, 1998), 1996, (2002, 2001), (2001, 2000), (2000, 1994, 1995), 1997
Month 69.24 4 17.45 41.97 0.000 (Nov., Aug.), July, Sept., Oct.
Eco-region 11.77 2 5.89 14.16 0.000 AP, CSS, AMb
Interaction 0.000
Year x month 54.93 27 2.04 4.89 0.000
Year x eco-region 14.28 8 1.79 4.29 0.000
Month x eco-region 12.78 7 1.83 4.39 0.000
Year x month x eco-region 15.08 20 0.75 1.81 0.015
Residual 833.12 2004 0.42
Total 1321.73 2080
aHomogeneous groups were determined by LSD multiple-range tests, and categories are grouped in paren-thesis and ranked from small to large. bEco-regions: CSS, continental shelf and slope; AP, abyssal plain; AM, abyssal mountains.
Significant effects of sea temperatures on CPUE values
Most of the saury were distributed in areas where SSTs ranged 0-20
°
C, and they highly aggregated in areas with SSTs of around 15°
C (Fig. 3). However, monthly distribution pat-terns of the SST contours varied among the 3 yearly groups of various CPUE values. In July of years of average CPUE values, cold water of 10°
C, roughly corresponding to the Oyashio front, intruded southward to around 45°
N, and cool water of 15°
C was found around 42-43°
N (1st col-umn in figure 3). This cool water (15°
C) receded northward to around 45°
N during Aug.-Sept. and then moved southward to around 40°
N in Nov. Warm water of 20°
C, roughly corresponding to the Kuroshio Extension, was found northward toaround 40
°
N during July-Sept. and receded south-ward to around 36°
N in Nov. In years of high CPUE values, the cold water (10°
C) intruded southward beyond 45°
N in July and the cool water (15°
C) occurred southward to 40-42°
N (last col-umn in figure 3). This cool water (15°
C) retreated northward to 42-43°
N during Aug.-Sept. and turned southward to around 40°
N during Oct.-Nov. The warm water (20°
C) was found northward to around 40°
N during July-Sept. and moved south-ward to around 36°
N in Nov. as it did in years of average CPUE values. In contrast, in years of low CPUE values, locations of the cold (10°
C) and cool (15°
C) waters in July were the same as those in years of average CPUE values, but in Aug. the cold water (10°
C) of the Oyashio front around the Kuril Is. withdrew northwardly to 50°
N, and the hot water (25°
C) pushed northward to around 40°
N (2nd column in figure 3). The hot water (25°
C) remained north of 35°
N in Oct. In Nov., the warm water (20°
C) of the Kuroshio Extension still occu-pied an area around 38°
N in years of low CPUE values.Based on the above evidence, migratory aggregations and abundances of saury stocks, based on CPUE values, in the beginning of the fishing season, July-Aug., were strongly associat-ed with SSTs. Years of high CPUE values were associated with the cold Oyashio water (10
°
C) intruding southward past 45°
N in July-Aug. and cooling the north of the saury fishing grounds in the beginning of the fishing season. In contrast, years of the low CPUE values were associated with the warm (20°
C) Kuroshio water and hot (25°
C) water pushing northward over 40°
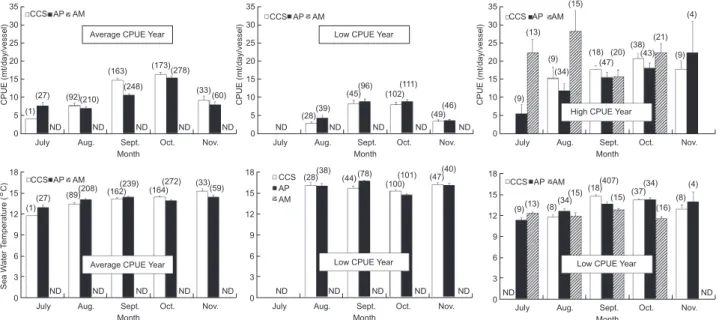
N in July and Aug. and warming the southern portion of the saury fishing grounds.SWTs in the fishing grounds obviously differed among the 3 yearly groups of various CPUE val-ues (Fig. 5), and the 15
°
C SWT in the fishing ground is a reference point to indicate the yearly CPUE (abundance) level for saury stocks in the NWP. The mean monthly CPUE values and SWTs in the fishing grounds ranged from 2.82 to 28.66 mt/d/vessel and from 11.31 to 16.76°
C, respec-tively (Fig. 5). In years of low CPUE values, most of the SWTs (range, 14.73-16.76°
C) were higher than 15°
C. On the contrary, most of the SWTs were lower than 15°
C in years of average (11.80-15.31°
C) and high CPUE values (11.31-14.65°
C). Therefore, fishing-ground SWTs higher than 15°
C are an indicator of low stock abundances of saury in the NWP.Fig. 2. Annual catch (●), number of fishing vessels (○), catch per unit effort CPUE (▲, metric tons/d/vessel), sea surface temperature (SST,
°
C) and sea water temperature (SWT,°
C)in fishing grounds of Pacific saury in the Northwest Pacific dur-ing 1994-2002 from the Taiwanese fishery data.
24 20 16 12 8 4 6 5 4 3 2 1 0 60 50 40 30 20 10 0 20 18 16 14 12 10 CPUE (mt/d/vessel) Catch (10,000 mt) Number of vessels SST SWT 1994 1995 1996 1997 1998 1999 2000 2001 2002 Year T emperature (
°
C)DISCUSSION
Migration related to sea temperatures and spawning grounds
The location of the spawning ground areas for the Pacific saury corresponded to the location of a sharp SST front in the NWP (Iwahashi et al. 2006). Consequently, adult saury are likely to intensify their spawning activity when they encounter spa-tially drastic changes in the thermal ambience. Temperatures related to the spawning grounds and early life stage of the saury are well under-stood. The sea temperature in the spawning
grounds of the saury in the NWP ranged 14-25
°
C over an entire year, with 17-18°
C for the principal range (Odate 1977). In the principle spawning grounds for saury, the Kuroshio waters, the average winter temperature was 19.1°
C over the past 51 yr (Tian et al. 2003). The ambient SSTs for eggs after fertilization ranged between 15.0°
C in late spring (May to June) and 21.5°
C in early autumn (Sept. to Oct.) and was around 20.0°
C in winter (Jan. to Feb.) (Iwahashi et al. 2006). Larvae and juvenile saury were caught mainly at 15-20°
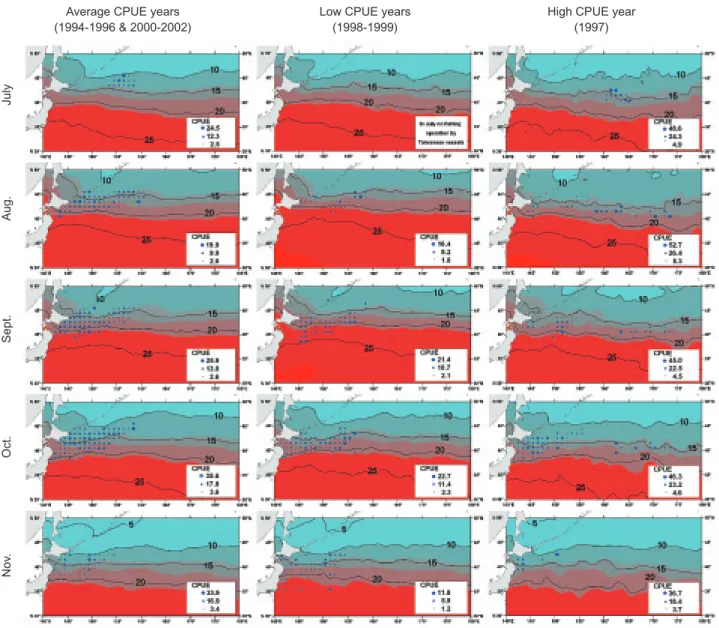
C in the ocean (Odate 1956 1962, Hayashi and Odate 1981, Watanabe et al. 1997). Laboratory experiments demonstrated thatFig. 3. Monthly geographical distributions of aggregation and abundances of the Pacific saury catch per unit effort (CPUE, metric tons/d/vessel) and sea surface temperature (SST,
°
C) in the 3 yearly groups of average, low, and high CPUE values in the northwest-ern Pacific using Taiwan fishery data. Circle size indicates the quantiles of the CPUE data.Average CPUE years (1994-1996 & 2000-2002)
Low CPUE years (1998-1999)
High CPUE year (1997) Aug. Sept. Oct. Nov . July
Pacific saury larvae have high survival rates and show positive growth between 14 and 22
°
C (Oozeki and Watanabe 2000). In summary, suitable tem-peratures for saury eggs and larvae range 15-20°
C, and within this range, warmer tempera-tures are better for egg and larva survival. In our study, most of the migratory saury were found in areas of SSTs between 10 and 20°
C with high aggregations at around 15°
C SST (Fig. 3). This finding implies that SSTs of around 15°
C could be the temperature of the frontal areas which attract saury to intensively aggregate for the spawning migration. Accordingly, saury moved southwest-ward or southsouthwest-ward, the direction of the thermal gradients, to find spawning grounds with SSTs of around 20°
C, which are favorable for the survival and growth of their offspring.Two linked migratory groups, 1 inshore and 1 offshore, of the saury stock were found in our study (Figs. 3, 4). Two linked spawning grounds of the saury of different magnitudes were also found in the transitional water in autumn (Iwahashi et al. 2006). The low-magnitude spawning ground was northwest of the area between 35
°
N, 140°
E and 40°
N, 150°
E, while the high-magni-tude areas were southeast of this. These 2 linked migratory groups of the spawning saury seemed to track the 20°
C contour and to look for spawning grounds during their southerly migration. Therefore, these northwestern and southeastern spawning grounds may be the main destinations in autumn for the inshore and offshore migratory groups, respectively. These migratory saurygroups follow the southerly shift in the spawning grounds with temperature changes. In late autumn, some spawning grounds had shifted and were successively located in the southern transi-tional water region, and a certain number stretched south into the subtropical water region, the principal spawning grounds of saury, around 25-35
°
N, 125-145°
E in winter (Iwahashi et al. 2006).In addition to these 2 migratory groups, in the year of high abundance, an additional oceanic migratory group was also found eastward in our study (Figs. 3, 4). No migratory information was documented about adult saury further east than 160
°
E in the North Pacific, but an isolated fishing ground of the saury located east of the main fish-ing ground was found by Shinomiya and Tameishi (1988). Larvae and juveniles of this species are continuously distributed from the inshore waters of Japan to as far offshore as 175°
E in the western and central North Pacific (Watanabe and Lo 1989, Watanabe et al. 1997 2003). A high aggregation of larvae was also observed at 171°
E in spring 1992 (Oozeki et al. 2004). The oceanic migratory group could have formed of larvae distributed fur-ther east than 160°
E, which were transported eastward from the spawning grounds by the Kuroshio Extension Current.Temperature effects on yearly saury abun-dances
Using Taiwanese catch data, the annual
Fig. 4. A schematic figure of the Pacific saury migration routes for the inshore migratory group in the continental shelf and slope region (horizontal hatching), offshore migratory group in the abyssal plain region (vertical hatching), and oceanic migratory group in the abyssal mountain region (oblique hatching) from July to Nov. of 1994-2002 in the Northwest Pacific. * The oceanic migratory group was only found in the high-abundance year of 1997.
July* July
Aug. and Sept. Oct.
Nov. N
Aug., Sept., and Oct.
140° 50° 45° 40° 35° 30° 145° 150° 155° 160° 165° 170° 175° 180°E
CPUE of the saury was insignificantly correlated with both the catch and number of fishing vessels (Fig. 2), implying that saury stocks in the NWP may be largely unaffected by fishing intensity and behavior due to the short generation time of saury. However, fishing can provoke greater variability in exploited populations and thus reduced resilience, thereby increasing the risk of collapse of a fishery from stochastic environmental events (Hsieh et al. 2006). In Taiwan in 1998, the abundance index and catch of saury experienced an abrupt decline in the same year as the catch data of Japan (Ebisawa and Sunou 1999, Tian et al. 2003). The decline in the catch was not attributable to increased fishing intensity but to a decline in the abundance caused by non-fishing factors (Matsumiya and Tanaka 1978, Sablin and Pavlychev 1982), e.g., oceanic-climatic conditions (Tian et al. 2004). The sea temperature (SST and SWT) has significant negative effects on the abun-dances of saury stocks at a scale of 1
°
x 1°
squ-are (Fig. 2). The synergistic effects of fishing and climate on saury stocks in the future should be of concern to fisheries managers (Hsieh et al. 2006).The abrupt changes in the saury abundance in 1998 were thought to have resulted from a change in atmospheric and oceanic conditions in the North Pacific during 1997/1998, such as a switch in the ENSO phase (Tian et al. 2003 2004). The winter cohort and spring cohort of the spawn-ing stock, respectively affected by the subtropical
and subarctic oceanic systems, contribute to the complexity of its population dynamics (Tian et al. 2002 2003). Tian et al. (2003) further indicated that the abrupt decline in saury stocks in 1998 resulted from unfavorable oceanic conditions, related to changes in the SST in the Kuroshio-Oyashio transition zone and Kuroshio-Oyashio region, for the spring-spawning cohort. The SSTs in the tran-sition zone and Oyashio region were cooler until 1998 (Tian et al. 2004). The warmer water that occupied the transition zone and Oyashio region could have resulted in unfavorable oceanic condi-tions for the spring-spawning cohort. In addition to the abundance, warm water also has a significant negative effect on the geographical aggregation of the saury distribution on the fishing grounds (2nd column in figure 3).
Temperature effects on the geographical distri-bution and abundances of Pacific saury
The migration routes and distribution of Pacific saury have been found to be associated with oceanographic conditions, such as the warm-core rings arising from the Kuroshio Current and the location and shape of the Oyashio intrusion as well as SSTs (Fukushima 1979, Saitoh et al. 1986, Sugimoto and Tameishi 1992, Yasuda and Watanabe 1994, Yasuda and Kitagawa 1996). However, in our study, the SST distribution was also found to be associated with the timing and
Fig. 5. Monthly mean of the catch per unit effort (CPUE) and sea water temperature (SWT) in the 3 eco-regions (continental shelf and slope (CSS), abyssal plain (AP), and abyssal mountains (AM)) and 3 yearly groups of average, low, and high CPUE values from the Taiwanese saury fishery from July to Nov. of 1994-2002 in the Northwest Pacific. The vertical line is the standard error. Average CPUE years: 1994-1996, 2000-2002; low CPUE years: 1998-1999; high CPUE year: 1997.
CPUE (mt/day/vessel)
CCS AP AM
Average CPUE Year
Average CPUE Year (210) (163) (248) (173) (278) (33) (60) (1) (27) (92) ND ND ND ND ND
July Aug. Sept.
Month Oct. Nov. 35 30 25 20 15 10 5 0 Sea W ater T emperature ( ° C) CCS AP AM (1) (27) (89) (208) (162)(239) (164) (272) (33) (59) ND ND ND ND ND
July Aug. Sept.
Month Oct. Nov. 18 15 12 9 6 3 0
Low CPUE Year CCS AP AM (28)(38) (100) (101) (47)(40) (78) (44) ND ND ND ND ND
July Aug. Sept.
Month Oct. Nov. 18 15 12 9 6 3 0
Low CPUE Year
(13) (34) (15)(18) (15) (37)(34) (16) (8) (4) (9) (8) (407) ND ND
July Aug. Sept.
Month Oct. Nov. 18 15 12 9 6 3 0 CPUE (mt/day/vessel) CCS AP AM
Low CPUE Year
High CPUE Year (102) (111) (28)(39) (45)(96) (49) (46) (9) (13) (34) (15) (18) (47) (20)(38) (21) (4) (9) (43) (9) ND ND ND ND ND
July Aug. Sept.
Month Oct. Nov. 35 30 25 20 15 10 5 0 CPUE (mt/day/vessel) CCS AP AM
July Aug. Sept.
Month Oct. Nov. 35 30 25 20 15 10 5 0 CCS AP AM
geographical distributions of aggregations and abundances of migratory saury among the vari-ous-abundance years (Fig. 3). In years of high abundance, the cold Oyashio water (10
°
C) intrud-ed more southerly than usual and coolintrud-ed the north of the saury fishing grounds in the beginning of the fishing season. The migratory groups initially aggregated in July as usual, but the area was located more southeasterly with a large abun-dance. Sablin and Pavlychev (1982) also reported that in years of earlier cooling of surface waters, commercial aggregations were found further south than usual. On the contrary, in years of low abun-dance, the warm (20°
C) Kuroshio water and hot (25°
C) water pushed further northward than usual and warmed the saury fishing grounds in the beginning of the fishing season. Briefly, in the early stage of the fishing season, apparent warm-ing by Kuroshio waters in the southern NWP was closely related to late aggregation and low abun-dances of saury stocks; in contrast, cooling by Oyashio waters in the northern NWP was related to eastward aggregation and high abundances of saury. The warm water had a negative effect on the CPUE (rSST = -0.10, rSWT = -0.20, p < 0.001). This could have resulted in the migratory groups not aggregating until Aug. on a smaller scale and with lower abundances.CPUE values showed significant negative correlations with SWTs and SSTs in a 1
°
x 1°
square (rSST= -0.10, rSWT= -0.20, p < 0.001) in our study, indicating that high saury abundances occurred in low-temperature areas. Saury prefer colder waters as migration routes, and the 1st and 2nd Oyashio intrusions are important southerly migra-tion routes for the species (Saitoh et al. 1986). In our study, SWTs on the fishing grounds were strongly linked to CPUE (Fig. 5). SWTs higher than 15°
C were associated with years of low CPUE values, and those lower than 15°
C were associated with years of average and high CPUE values. An SWT of 15°
C roughly corresponded to an SST of 16°
C in the fishing grounds, according to the relationship established in our study. Therefore, fishing ground SWTs higher than 15°
C (about 16°
C SST) are an indicator of low stock abundances for the saury in the NWP.In summary, the geographical distribution and abundances of Pacific saury fishing stocks in the NWP are strongly linked to sea temperatures and result in annual variations in saury abundances and beginning times of the fishing season. SST data are a useful alternative to relate variations in fish abundances on a mesoscale when SWTs are
not available over the entire analysis area. Applying and analyzing other satellite remotely sensed data such as ocean color, sea surface height, wind stress, and so on could be the next step in investigating spatiotemporal relationships between saury fishing stock abundances and mesoscale oceanic features.
Acknowledgments: This research was funded by the Fisheries Agency, Council of Agriculture, Executive Yuan, Taiwan (93AS-9.1.2-FA-F1-01-03, 94AS-14.1.2-FA-F1-01-03). We are very grateful to the Overseas Fisheries Development Council in Taiwan for providing logbook data of Taiwan saury fishery in this study. The authors also wish to thank Dr. C. F. Tsai of the Endemic Species Research Institute, Nantou County, Taiwan and Dr. K. Piner of the Southwest Fisheries Science Center, National Marine Fisheries Service, National Oceanic and Atmospheric Administration, La Jolla, CA for their comments on the manuscript and help with English writing. We also wish to thank the 2 anonymous reviews for their construc-tive comments on the manuscript.
REFERENCES
Alheit J, E Hagen. 1997. Long-term climate forcing of European herring and sardine populations. Fish. Oceanogr. 6: 130-139.
Brett JR, TDD Groves. 1979. Physiological energetics. In WS Hoar, DJ Randall, JR Brett, eds. Fish physiology, Vol. VIII. London: Academic Press, pp. 279-352.
Burrough PA, RA McDonnell. 1998. Principles of geographical information systems. New York: Oxford Univ. Press. Chikuni S. 1985. The fish resources of the northwest Pacific.
Rome: Food and Agricultural Organization, Fishery Technical Paper no. 266.
Cook RM, A Sinclair, G Stefansson. 1997. Potential collapse of the North Sea cod stocks. Nature 385: 521-522. Cushing DH. 1982. Climate and fisheries. London: Academic
Press.
Dickson RR, KM Brander. 1993. Effects of a changing wind-field on cod stocks of the North Atlantic. Fish. Oceanogr. 2: 124-153.
Ebisawa Y, H Sunou. 1999. Influence of variation of the Kuroshio water on catch fluctuations of saury, Cololabis
saira, in the waters off northeastern Japan. Bull. Ibaraki
Pref. Fish Exp. Stn. 37: 29-36. (in Japanese)
Eilliott JM. 1981. Some aspects of thermal stress on freshwa-ter teleosts. In AD Pickering, ed. Stress and fish. London: Academic Press, pp. 209-245.
FAO (Food and Agriculture Organization of the United Nations). 2006. Fisheries - productions - statistics (databases and statistics). Available at http://www.fao.org/fi/statist/ statist.asp.
Fukushima S. 1979. Synoptic analysis of migration and fishing conditions of saury in northwest Pacific Ocean. Bull.
Tohoku Reg. Fish. Res. Lab. 41: 1-70.
Fukushima S, Y Watanabe, Y Ogawa. 1990. Correspondence of spawned season to large, medium, and small size Pacific saury exploited in the northwestern Pacific Ocean. Bull. Tohoku Natl. Fish. Res. Inst. 52: 17-27.
Graham JB. 1983. Heat transfer. In PW Webb, D Weihs, eds. Fish biomechanics. New York: Praeger, pp. 248-279. Gulland JA. 1983. Fish stock assessment: a manual of basic
methods. Chichester, UK; New York: Wiley.
Hayashi K, S Odate. 1981. On distribution pattern of larvae of Pacific saury. Bull. Jpn. Soc. Sci. Fish. 47: 705-711. Hsieh Ch, CS Reiss, JR Hunter, JR Beddington, RM May, G
Sugihara. 2006. Fishing elevates variability in the abun-dance of exploited species. Nature 443: 859-862. Hubbs CL, RL Wisner. 1980. Revision of the sauries (Pisces,
Scomberesocidae) with descriptions of two new genera and one new species. Fish. Bull. US 77: 521-566. Hutchings JA. 2000. Collapse and recovery of marine fishes.
Nature 406: 882-885.
IOC, IHO, BODC. 2003. Centenary Edition of the GEBCO Digital Atlas, published on CD-ROM on behalf of the Intergovernmental Oceanographic Commission and the International Hydrographic Organization as part of the General Bathymetric Chart of the Oceans, British Oceanographic Data Centre, Liverpool, UK.
Ito S, Sugisaki H, Tsuda A, Yamamura O, Okuda K. 2004. Contributions of the VENFISH program: meso-zooplank-ton, Pacific saury (Cololabis saira) and walleye pollock (Theragra chalcogramma) in the northwestern Pacific. Fish. Oceanogr. 13(Supplement 1): 1-9.
Iwahashi M, Y Isoda, S Ito, Y Oozeki, S Suyama. 2006. Estimation of seasonal spawning ground locations and ambient sea surface temperatures for eggs and larvae of Pacific saury (Cololabis saira) in the western North Pacific. Fish. Oceanogr. 15: 125-138.
Jennings S, JD Reynolds, SC Mills. 1998. Life history corre-lates of responses to fisheries exploitation. Proc. R. Soc. London Ser. B 265: 333-339.
Kawai H. 1972a. Hydrography of the Kuroshio and Oyashio.
In M Iwashita, Y Komaki, T Hoshio, J Horibe, J
Masuzawa, eds. Physical oceanography II. Tokyo: Univ. of Tokyo Press, pp. 129-320.
Kawai H. 1972b. Hydrography of the Kuroshio Extension. In H Stommel, K Yoshida, eds. Kuroshio - its physical aspects. Seattle, WA: Univ. of Washington Press, pp. 235-352.
Kosaka S. 2000. Life history of Pacific saury Cololabis saira in the Northwest Pacific and consideration of resource fluc-tuation based on it. Bull. Tohoku Natl. Fish. Res. Inst. 63: 1-96. (in Japanese with English abstract)
Kurita Y. 2001. Seasonal changes in spawning grounds and the abundance of egg-laying of Pacific saury. Annual Report of the Research Meeting on Saury Resource No. 49. Aomori, Japan: Tohoku National Fishery Research. Institute, pp. 203-205. (in Japanese)
Laevastu T. 1993. Marine climate, weather and fisheries. Oxford, UK: Blackwell Scientific Publications.
Laurs RM, RJ Lynn. 1977. Seasonal migration of North Pacific albacore, Thunnus alalunga, into North America coastal waters: distribution, relative abundance and association with transition zone waters. Fish. Bull. US 75: 795-822. Leggett WC, RR Whitney. 1972. Water temperature and the
migrations of American shad. Fish. Bull. US 70: 659-670 Lehodey P, M Bertignac, J Hampton, A Lewis, J Picaut. 1997.
El Niño Southern Oscillation and tuna in the western
Pacific. Nature 389: 715-718.
Matsumiya Y, S Tanaka. 1978. Dynamics of the saury popula-tion in the Pacific Ocean off northern Japan. III. Reproductive relations of large and medium sized fish. Bull. Jpn. Soc. Sci. Fish. 44: 451-455.
Odate K. 1977. On the feeding habits of the Pacific saury,
Cololabis saira (Brevoort). Bull. Tohoku. Reg. Fish. Res.
Lab. 38: 75-88. (in Japanese with English abstract) Odate K. 1994. Zooplankton biomass and its long-term
varia-tion in the western North Pacific Ocean, Tohoku sea area, Japan. Bull. Tohoku. Natl. Fish. Res. Inst. 56: 115-163. (in Japanese with English abstract)
Odate S. 1956. On the distribution of larvae and young of the saury, Cololabis saira, and the condition of maturity of the gonad of the spawning fish in the neighbourhood of Izu Islands and the north-eastern sea area of Japan. Bull. Tohoku Reg. Fish. Res. Lab. 7: 70-102.
Odate S. 1962. Distribution of larvae of the saury, Cololabis
Saira (Brevoort), in the surrounding sea of Japan. Bull.
Tohoku Reg. Fish. Res. Lab. 20: 67-93. (in Japanese with English abstract)
Oozeki Y, Y Watanabe. 2000. Comparison of somatic growth and otolith increment growth in laboratory-reared larvae of Pacific saury, Cololabis saira, under different temperature conditions. Mar. Biol. 236: 349-359.
Oozeki Y, Y Watanabe, D Kitagawa. 2004. Environmental fac-tors affecting the larval growth of Pacific saury in the northwestern Pacific Ocean. Fish. Oceanogr. 13(Supplement 1): 44-53.
Pavlychev VP. 1977. Oceanographic condition during north-ward migration of saury: influence to distribution. Bull. Tohoku Reg. Fish. Res. Lab. 37: 31-37.
Sablin VV, VP Pavlychev. 1982. Dependence of migration and catch of Pacific saury upon thermal conditions. Bull. Tohoku Reg. Fish. Res. Lab. 44: 109-117.
Saitoh S, S Kosaka, J Iisaka. 1986. Satellite infrared observa-tions of Kuroshio warm core rings and their application to study of Pacific saury migration. Deep-Sea Res. 33: 1601-1615.
Shimizu Y, I Yasuda, S Ito. 2001. Distribution and circulation of the coastal Oyashio intrusion. J. Phys. Oceanogr. 31: 1561-1578.
Shinomiya H, H Tameishi. 1988. Discriminant prediction of for-mation of saury fishing grounds by satellite infrared imageries. Nippon Suisan Gakk. 54: 1093-1099.
Southward AJ, GT Boalch, L Maddock. 1988. Fluctuations in the herring and pilchard fisheries of Devon and Cornwall linked to change in climate since the 16th century. J. Mar. Biol. Assoc. UK 68: 423-445.
Springer AM, JF Piattt, VP Shuntov, GB Van Vliet, VL Vladimirov, AE Kuzin, AS Perlov. 1999. Marine birds and mammals of the Pacific Subarctic Gyres. Prog. Oceanogr. 43: 443-487.
Sugimoto T, H Tameishi. 1992. Warm-core rings, streamers and their role on the fishing ground formation around Japan. Deep-Sea Res. 39(Supplement 1): S183-S201. Sugisaki H, Y Kurita. 2004. Daily rhythm and seasonal
varia-tion of feeding habit of Pacific saury (Cololabis saira). Fish. Oceanogr. 13(Supplement 1): 63-73.
Suyama S, Y Sakurai, K Shimazaki. 1996. Age and growth of Pacific saury Cololabis saira (Brevoort) in the western North Pacific Ocean estimated from daily otolith growth increments. Fish. Sci. 62: 1-7.
Tamura T, Y Fujise, K Shimazaki. 1998. Diet of minke whales
North Pacific in summer, 1994 and 1995. Fish. Sci. 64: 71-76.
Tian Y, T Akamine, M Suda. 2003. Variations in the abun-dance of Pacific saury (Cololabis saira) from the north-western Pacific in relation to oceanic-climate changes. Fish. Res. 60: 439-454.
Tian Y, T Akamine, M Suda. 2004. Modeling the influence of oceanic-climatic changes on the dynamics of Pacific saury in the northwestern Pacific using a life-cycle model. Fish. Oceanogr. 13(Supplement 1): 125-137.
Tian Y, Y Ueno, M Suda, T Akamine. 2002. Climate ocean variability and the response of Pacific saury (Cololabis
saira) in the northwestern Pacific during the last half
cen-tury. Fish. Sci. 68(Supplement 1): 158-161.
Watanabe Y, JL Butler, T Mori. 1988. Growth of Pacific saury,
Cololabis saira, in the northeastern and northwestern
Pacific Ocean. Fish. Bull. US 86: 489-498.
Watanabe Y, Y Kurita, M Noto, Y Oozeki, D Kitagawa. 2003. Growth and survival of Pacific saury Cololabis saira in the Kuroshio-Oyashio transition waters. J. Oceanogr. 59:
403-414.
Watanabe Y, NCH Lo. 1989. Larval production and mortality of Pacific saury, Cololabis saira, in the northwestern Pacific Ocean. Fish. Bull. US 87: 601-613.
Watanabe Y, Y Oozeki, D Kitagawa. 1997. Larval parameters determining preschooling juvenile production of Pacific saury (Cololabis saira) in the northwestern Pacific. Can. J. Fish. Aquat. Sci. 54: 1067-1076.
Wootton RJ. 1992. Fish ecology. New York: Chapman and Hall.
Yamamura O. 1997. Scavenging on discarded saury by dem-ersal fishes off Sendai Bay, northern Japan. J. Fish Biol. 50: 919-925.
Yasuda I, D Kitagawa. 1996. Locations of early fishing grounds of saury in the north-western Pacific. Fish. Oceanogr. 5: 63-69.
Yasuda I, Y Watanabe. 1994. On the relationship between the Oyashio front and saury fishing grounds in the north-western Pacific: a forecasting method for fishing ground locations. Fish. Oceanogr. 3: 172-181.