Department of Business Administration
I-Shou University
Master Thesis
Thesis Title
Salary, Career Opportunities, Working
Environment and Employee’s Loyalty in
FECON JSC.
Advisor
: Dr. Joe Y.C. Yang
Co - advisor
: Dr. Truong An Quoc
Graduate Student
: Nguyen Quoc Huy
ID No
: 10221201G
i
Acknowledgements
The first words, I would like to express my deep thanks to supervisor Dr.
Joe Y.C. Yang and co-supervisor Dr. Truong An Quoc who have dedicated
guide and help me throughout the process of implementing the literature search
until the completion of this thesis.
I am sincerely grateful to teachers of I Shou University & Ha Noi
University of Business and Technology imparted valuable knowledge to me in
graduate programs.
I would also give my honor to my colleagues in FECON Vietnam as they
help me to distribute and complete the questionnaire.
And finally I would like to thank family and friends for help and action
emotional support for me, help me persevere completed this essay.
Ha Noi, 7 August, 2015
Huy
ii
Abstract
This study examines the loyalty level of the employees at FECON Vietnam. Results show that the employees disagree with the current salary adjustment policies in FECON. In fact, the company does establish salary adjustment but the adjustment is minor. Results also show that the employees disagree with the current salary adjustment policies in FECON and the employees have neutral attitude with current job rotation in FECON. They are happy with salary stability, job stability, and job tasks matching with abilities of the employees. Furthermore, there were no difference between gender, age, education, monthly income and job position impacted in the employees’ loyalty.
iii
Table of Contents
Acknowledgements ... i
Abstract ... ii
List of Tables ... v
List of Figures ... vi
Chapter 1 INTRODUCTION ... 1
1.1 Background of the study ... 1
1.2 Research objectives and research questions ... 2
1.3 Scope of the study ... 3
1.4 Significance of the study ... 3
Chapter 2 LITERATURE REVIEW ... 4
2.1 Understanding on employees’ loyalty ... 4
2.2 Related theories ... 4
2.2.1 Need-Hierarchy Theory ... 4
2.2.2 Two-Factor Theory ... 6
2.2.3 Equity Theory ... 7
2.3 Factors impacting on employees’ loyalty ... 7
2.3.1 The relationship between employees’ loyalty and salary ... 7
2.3.2 The relationship between employees’ loyalty and career opportunities ... 8
2.3.3 The relationship between employees’ loyalty and working environment ... 8
2.4 Conceptual research model ... 9
Chapter 3 RESEARCH METHODOLOGY ... 10
iv
3.2 Research method ... 11
3.3 Data collection ... 11
3.3.1 Secondary data ... 11 3.3.2 Primary data ... 123.4 Sampling issue ... 12
3.5 Questionnaire development ... 12
3.6 Data analysis method ... 13
3.7 Reliability test analysis ... 14
Chapter 4 DATA ANALYSIS AND RESULTS ... 17
4.1 Demographic information ... 17
4.2 Descriptive Statistics ... 19
4.3 ANOVA analysis ... 29
Chapter 5 CONCLUSION AND RECOMMENDATION .... 33
5.1 Conclusion ... 33
5.2 Recommendation ... 33
5.3 Research Limitations ... 35
5.4 Directions/Suggestions for Future Research ... 35
References ... 36
v
List of Tables
Table 1: Reliability test for salary factor ... 15
Table 2: Demographic description ... 18
Table 3: Descriptive statistics on examined factor ... 20
Table4: Descriptive statistics by cross-tabulation between salary and employees loyalty ... 22
Table 5: Descriptive statistics by cross-tabulation between career opportunities and employees loyalty ... 24
Table 6: Descriptive statistics by cross-tabulation between working environment and employees loyalty ... 27
Table 7: Independent sample T-Test for gender ... 30
Table 8: One-Way ANOVA for age ... 30
Table 9: One-Way ANOVA for education ... 31
Table 10 : One-Way ANOVA for monthly income ... 31
vi
List of Figures
Figure 1: Organizational Structure of FECON ... 1
Figure 2: Need-Hierarchy Theory ... 5
Figure 3: Two-Factor Theory ... 6
Figure 4: Conceptual Research Model ... 9
1
Chapter 1 INTRODUCTION
1.1 Background of the study
FECON is a firm operating in foundation engineering and underground construction. The firm is established in 2004 and it is becoming the leading firm in construction area. The major businesses include: Soil investigation and foundation testing, designing and manufacturing the products related to soft soil enrichment, providing human resource solution for other construction firms. Currently, the firm sets a vision of becoming leading group in term of construction and infrastructure development till 2020. To ensure this vision is achieved, the missions of the firm to invest intensively on research and development activities towards advanced technologies as well as focusing on safe and sustainable solutions. The business philosophy of FECON is categorized into two areas, including customers’ satisfaction and employees’ benefits. The customers’ satisfaction with the products and services of the firm is ensured through quality of products and services, effective solutions, and on-scheduled. On the other hand, employees’ benefits are fulfilled by applying right corporate culture.
Figure1: Organizational Structure of FECON
Currently, FECON has more than 1,000 employees after more than 10 years of operations. The employees are distributed by functions, including representative offices, sales,
2
technical, safety, project management, construction, procurement, equipment, legal and secretarial, Information technology, human resource, finance and accounting, and communication. These functions are managed by department level and they are belonged to two groups, namely front office and back office. The employees at FECON have been receiving some benefits. The average salary is more than VND7 million per month after taxes and social insurances. The firm also establishes a kindergarten for the employees who have small kids with total investments is more than VND11 billion. The firm also grants scholarships for children of the employees at elementary and secondary schools. However, actual observation shows that the job turnover at FECON is quite high over the last three years. Job turnover is denoted as the ration of employees who left the firm over total employees and it has been increasing at FECON from 2012 to 2014. The turnover rates in 2012, 2013, and 2014 of FECON are 11%, 14%, and 17%. The turnover rate of 17% in 2014 equals to 202 employees left. The continuous increases of employees left raises the concerns to the managers of FECON Vietnam in term of human resource management quality and the employees are not being attracted by internal policies anyway. In this context, the study takes into account the topic of employees’ loyalty and to explore how employees’ loyalty level at FECON.
1.2 Research objectives and research questions
Based on background of the study above, the study aims to identify the relationship between: Salary, career opportunities, working environment and employees’ loyalty at FECON. To do that, research objectives are provided as below:
To identify the relationships between employees’ loyalty and Salary, career opportunities, working environment at FECON
To provide recommendations to further improve employees’ loyalty at FECON Then, research questions will be:
What are the relationships between employees’ loyalty and salary, career opportunities, working environment at FECON?
3
1.3 Scope of the study
Due to time constraint, the study is conducted with scope defined. The study takes into account employees’ loyalty topic that is different to other topics such as employees’ satisfaction and employees’ commitment. Although employees’ loyalty, employees’ satisfaction, and employees’ commitment are often used interchangeably but the study only takes into account employees’ loyalty. Moreover, employees’ loyalty is impacted by many factors but the study only focuses on three factors, namely salary, career opportunities, and working environment. The impacts of three factors on employees’ loyalty at FECON are explored by using quantitative research method. Data for the examination is collected from survey of questionnaire with employees of the firm. In addition, closed questionnaire is chosen to reduce the time of processing data accordingly.
1.4 Significance of the study
This study is significant to the managers of FECON because of it provides key findings on current level of employees’ loyalty. The low level of employees’ loyalty will be assessed in detail with the consideration on factors impacting on employees’ loyalty. Moreover, this study is also significant to other researchers who are also interested in employees’ loyalty topic. On the other hand, this study is considered as reference for other researchers.
4
Chapter 2 LITERATURE REVIEW
2.1 Understanding on employees’ loyalty
Employees’ loyalty is defined as state of mind of people when they work in particular organization in the context of they feel attachment with the organization through positive feeling about assigned jobs and benefits received (Peloso, 2004). Employees’ loyalty is determined as one of critical concern to human resource manager in every firms (AlBattat and Som, 2013). Employees’ loyalty is also becoming a critical problem in hospitality industry as this industry is operated upon dependency on the human factor. Because of the importance of hospitality industry in both of financial and moral effects, there are many researchers have been taking into account employees’ loyalty issue in the last few decades. Generally, employees’ loyalty is described as a process that consists of loyalty intention and actual loyaltys (Albattat and Som, 2013). The loyalty intention, simply, is known as the employees’ unhappiness whether their expectations towards particular jobs are not met and this enforces the employees to make job loyalty decision. According to Bigliardi et al. (2005), the employees’ loyalty intention is started since when the employees think about staying or leaving their companies. Mowday et al. (1979) highlight the fact that the employees in short term often have higher loyalty intention than in long term. Blau (2000) provides explanation for employees’ loyalty intention as the result of voluntary or involuntary loyalty effects. Voluntary loyalty is defined as when the employees and the employers conduct a labor contract termination officially (Rousseau, 1995; McLean Parks et al., 1999). On the other hand, involuntary loyalty happens when the employees’ labor contract with the companies to be terminated unofficially (MacDonald, 1999; Krausz, 2002).
2.2 Related theories
2.2.1 Need-Hierarchy Theory
Need-Hierarchy Theory is known as fundamental concept in human resource management and it is provided by Maslow (1943). This theory is intensively used in both of academic studies and business practices. This theory is illustrated in the Figure below:
5
Figure2: Need-Hierarchy Theory
In term of people’s need, Maslow (1943) tried to identify the need of the employees into five levels. The first level of people’s need refers to physiological needs that is considered as people require food, clothing, and shelters to live. In higher stage, people require safe needs or they needs stable jobs with acceptable income level to maintain their living standards. Social needs is known as the third level and it refers to the people’s requirements of being accepted, belonged, and loved from people surrounding them. The next stage refers to esteem needs that is known as the requirement of recognition or respects from other people. The final stage is considered as self-actualization needs and it is defined as autonomy and personal potential fulfilment. According to Maslow (1943), lower needs level should be fulfilled before coming up to higher needs level. Maslow (1943) also applies this theory into workplace situation and this researcher identifies that when the employees are fulfilled by higher needs level, they are likely satisfied with the jobs and therefore lowering the job turnover or higher employees’ loyalty. However, Need-Hierarchy Theory also faces up with some concerns or it is criticized by other researchers. For instance, Steers and Porter (1991) identify that the relationship between employees’ loyalty and five needs levels. Robbin et al. (2003) also assert that the linkage between employees’ loyalty and five needs levels are not tested in empirical studies. Maher (2002) strongly indicates that Maslow (1943) is fail in specifying the scale for highest tier or self-actualization needs. Although there are some confuses or problems of using Need-Hierarchy Theory, it is still providing the basis to select factors that impact on employees’ loyalty level at
6
FECON. Moreover, the author does not attempt using five tiers into the conceptual research model and this will be validated or tested with data collected from survey of questionnaire with employees of FECON accordingly.
2.2.2 Two-Factor Theory
Two-Factor Theory is provided by Herzberg (1974) and it is developed from Need-Hierarchy Theory of Maslow (1943). According to Herzberg (1974), Two-Factor Theory highlights two factors that may impact on employees’ satisfaction and later is employees’ loyalty, including hygiene factor and motivation factor. Two-Factor Theory is illustrated in the Figure below:
Figure 3: Two-Factor Theory
Hygiene factor is considered as extrinsic element and it includes quality of supervision, pay, company policies, physical working conditions, relations with others, and job security (Gruneberg, 1979). Motivation factor is defined as intrinsic element and it includes promotion opportunities, opportunities for personal growth, recognition, responsibility, and achievement (Gruneberg, 1979). According to Herzberg (1974), hygiene factor impacts on the job dissatisfaction and higher hygiene factor means lower job dissatisfaction. On the other hand, motivation factor impacts on job satisfaction and higher motivation means lower job satisfaction accordingly.
Two-Factor Theory also receives some criticisms from other researchers. For instance, Gardner (1977) indicates that this theory is constructed from traditional interviews but in-depth ones. Vroom (1964) highlights the fact that the employees are expected to more readily recall positive events which reflect upon themselves, and negative events which can be attributed to external conditions. Although there are several limitations in Two-Factor Theory, it is still being used intensively in academic researches and
7
business practices (Kim, 2004). In this study, Two-Factor Theory is applied in order to choose factors impacting on employees’ loyalty. Also, the author avoids the criticisms from traditional interviews and tries to adopt survey of questionnaires to capture the employees’ assessments.
2.2.3 Equity Theory
Equity Theory is provided by Adam (1963) and it is known as one of traditional model to evaluate employees’ perception about assigned jobs and working environment. This theory takes into account the gap between employees’ capabilities and their job performances and the benefits such as salary and career opportunities (Huseman et al., 1987). Equity Theory addresses the assumption of which the employees should be treated equally between others.
Equity Theory is also received some concerns from researchers. According to Pritchard (1969), equity theory is very important due to it helps the managers to improve the efficiency of people management.
2.3 Factors impacting on employees’ loyalty
From related theories discussion, the author recognizes that Need-Hierarchy Theory, Two-Factor Theory, and Equity Theory address the impacts of three factors to employees’ loyalty, including salary, career opportunities, and working environment.
2.3.1 The relationship between employees’ loyalty and salary
Many researchers have tried to test job loyalty in relation to salary. Although the earliest results showed a weak link between the two (Hoppock, 1935; Herzberg, 1957), many studies performed later indicate that salary is a fundamental factor determining job loyalty (Lee& Wilbur, 1985; Lucas et al, 1990; Saiyadain (2009); Nguyen, Taylor, & Bradley, 2003). According to Sweet, Nelson, and Moberg (2006), there is positive influence of pay loyalty on job loyalty and it can obviously observe in every field of life. In baking sector, Sowmya & Panchanatham (2011) selected six factors pay, promotion, organisation factors, supervisor behaviour, job and working condition, core worker behaviour to test job loyalty of employees in Chennai, India. Among the chosen antecedents, pay and promotion regarded as the most influencing and indispensible factors to decide job loyalty of employees. As the results of study conducted by
8
Amendolair (2007) salary is the most significant component relating to job loyalty. There is a significant difference in the job loyalty levels of employees based on their salary. Employees earning the lowest salary report significantly lower levels of job loyalty relative to the higher salary groups. Diener & Seligman (2004) also stated that with the much lower income, job loyalty and income loyalty are actually slightly higher.
2.3.2 The relationship between employees’ loyalty and career
opportunities
Chaudhary (1991) highlights the importance of examining career opportunities in order to analyze their affects to employees’ loyalty. Davies et al. (2001) support this argument of Chaudhary (1991) whether these researchers indicate that employees’ loyalty in Australian hospitality is highly depended on three career opportunities, namely performance appraisal, remunerations, and training. According to Davis et al. (2001), the employees will be happier at work when they perceive that their performance appraisals are fair, they receive competitive salary package, as well as receiving adequate training in order to assure the quality of jobs. Kristof-Brown (2001) identifies that the employees often make rational assessment on job and person-organization suitability level on employees’ loyalty and the turnover intention. In this context, the employees try to evaluate the quality of performance appraisal, remuneration level, and training as indicators for employees’ loyalty.
2.3.3 The relationship between employees’ loyalty and
working environment
According to Albattat and Som (2013), working environment is defined as the environment where the employees working and performing assigned tasks. This relationship can be explained by the fact that the higher level of employees to manage the working environment, the lower employees’ disloyalty that may lead to higher job turnover intention (Pestonjee, 1992). Many firms today have established their own management to deal with working environment for their employees (Banet et al., 2005). On the other hand, if the firms do not pay much attention on working environment level, they will face up with direct and indirect cost of working environment (Matteson and Ivancevich, 1982). Nelson and Burke (2000) point out the concentration on two aspects of working environment, including lack of empowers for the employees, and wrong job
9
roles. In more detail, when the employees are lack of empowerment in their job roles, they will feel more stressful to follow unwanted directions, leading to higher employees’ disloyalty (Cooper and Cartwright, 1994). Moreover, the wrong job roles may also impact to employees’ loyalty as the employees are assigned the wrong things to do (Beehr et al., 1976; Dyer and Quine, 1998). Also, wrong job roles occurs when an employee has a shortage of information about his work requirements (Cordes and Dougherty, 1993).
2.4 Conceptual research model
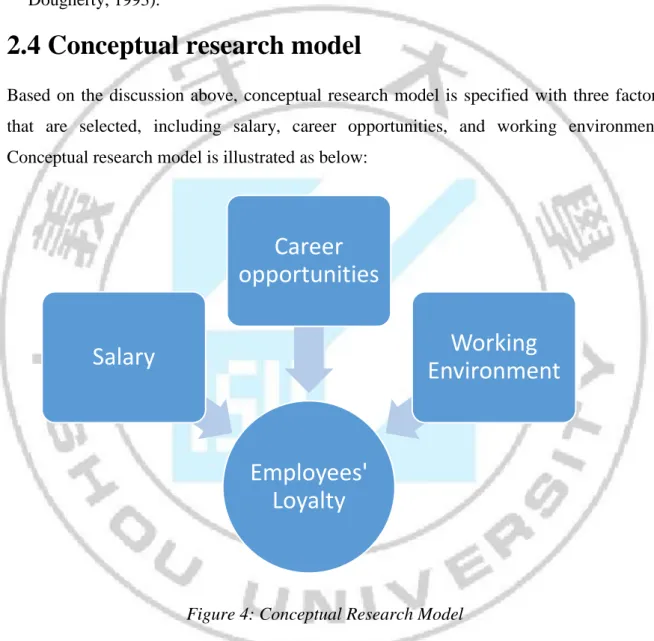
Based on the discussion above, conceptual research model is specified with three factors that are selected, including salary, career opportunities, and working environment. Conceptual research model is illustrated as below:
Figure 4: Conceptual Research Model
Then, research hypotheses will be:
H1: Salary, career opportunities, working enviroment and employees’ loyalty in FECON are related
H2: There is no differences in Socio – demographic and emloyee’s loyalty.
Employees'
Loyalty
Salary
Career
opportunities
Working
Environment
10
Chapter 3 RESEARCH METHODOLOGY
3.1 Research design
According to Saunders et al. (2009), an academic study is conducted by one of two ways, including deduction and induction. Deduction refers to the process of theory testing process that are related to research objective and research question. Anderson (2004) asserts that deduction allows the author to choose existing theories and test these theories with data mining process. Figure below is illustrated for deduction design.
Figure 5: Deductive Research Process Design
The process of deduction research design consists of six steps, including theory, hypothesis, data collection, findings, hypotheses confirmed or rejected, and revision of theory. In this study, theory of employees’ loyalty are identified through three theories, including Need-Hierarchy Theory, Two-Factor Theory, and Equity Theory. These theories help the author to construct research hypotheses with consideration on the relationships between employees’ loyalty and three factors, namely salary, career opportunities, and working environment. Then, these relationships are validated by collecting primary data and some statistical treatments to be deployed such as linear regression. The result of hypothesis testing will indicate for the acceptance or rejection of proposed hypotheses. Then, theories will be revised regarding to hypothesis testing results.
11
3.2 Research method
Quantitative and qualitative are considered as two major research method in academic studies (Saunders et al., 2009). The main objective of the study is to explore the relationship between employees’ loyalty and its antecedents, including salary, career opportunities, and working environment. It is true since the relationship between dependent and independent variables are only resolved by using quantitative method (Berg and Latin, 2004; McCarthy, 2008). Quantitative research method is chosen as it consists of advantages compared to qualitative research method. Vanderstoep and Ohnson (2009) indicate that quantitative research method is accuracy of the findings which reflect the overall population. Moreover, quantitative research method is good choice when the author would like to explain the data in term of good visualization. All questionnaire is analyzed and constructed by graphs and therefore quantitative research method should be used accordingly (Nykiel, 2007).
3.3 Data collection
3.3.1 Secondary data
According to Wrenn et al. (2006), secondary data is the information that have been existed in public resources. On the other hand, secondary data is not prepared by the author but other researchers from existing studies (Saunders et al., 2009). Moreover, secondary data is divided into internal resources and external resources. While internal resources are identical from internal reports and studies about the social phenomenon, external resources refer to public reports of third parties or external agencies (Wrenn et al., 2006). According to Srivastava and Rego (2011), secondary data has some advantages as it takes lower time and efforts to collect the information to the researchers. Guffey et al. (2010), however, strongly highlight the issues related to secondary data as it might not support the research’s objectives as it is prepared by other researchers in different researches. In this context, Saunders et al. (2009) strongly recommend the researchers to conduct careful checking on the source of secondary data before it is used in their studies. In this study, secondary data is collected from internal report of FECON. The reports are extracted from human resource department of the firm in last three years.
12
3.3.2 Primary data
According to Stevens et al. (2002), primary data is defined as the information that is collected by the researchers. Primary data is different to secondary data above as secondary data can be collected from existing resources. On the other hand, primary data is only generated by owned researchers’ effort. Therefore, these data are highly relevant for the concerned study and the researcher can easily control and deeply understand for appropriate using of the first-hand information. In this study, primary data is collected from survey of questionnaire with relevant employees who are working for FECON. To reduce the limitation of employees’ knowledge and bias from the answers, the author decides to choose people who have been working for FECON for last 2 years. On the other hand, this means that people who have less than 1 year of working for FECON will be removed from the analysis.
3.4 Sampling issue
According to Saunders et al. (2009), there are two type of sampling technique, namely probability sampling and non-probability sampling. In this study, the author would like to use probability sampling with random sampling to be applied. Cohen et al. (2007) assert that random sampling is preferable to almost academic researchers due to it brings equal opportunities for every member of the population when they are selected into sampling portfolio. On the other hand, random sampling is good for this study as the author does not focus on particular or special groups. The sample size in random sampling technique is derived with the application of Yamane’s (1967) equation:
Sample Size = Population Size / (1 + Population Size x Error2)
Total employees of FECON is 1189 and applying Yamane (1967) returns the sample size of 299 people.
3.5 Questionnaire development
The questionnaire is deployed in this study with the objective of collecting primary data. The content of this questionnaire is designed upon on Minnesota Satisfaction Questionnaire (MSQ) that is provided by Weiss et al. (1967). MSQ is chosen due to it
13
covers many facets of employees’ perception about their works and it also addresses the feeling of the employees towards their assigned tasks (Green, 2000). The questionnaire, then, is designed with two major parts: demographic information and employees’ loyalty assessment.
Demographic information consists of five questions, including gender, age, education, monthly salary, and job position. Employees’ loyalty assessment includes three factors, namely salary, career opportunities, and working environment. Each factor is assessed through a set of four statements. Total questionnaire, therefore, 16 questions. To help the respondents answer these questions, the author applies Likert scale with five options, namely [1] Strongly Disagree, [2] Disagree, [3] Neutral, [4] Agree, and [5] Strongly Agree. In addition, employees’ loyalty at overall is also stated in the questionnaire that helps the author to evaluate current level of employees’ loyalty at the firm. Moreover, closed questionnaire is chosen instead of open questionnaire. According to Saunders et al. (2009), closed questionnaire will reduce the time of answering questions and therefore it does not create the issues or take time for the respondents to answer.
The process of implementing survey of questionnaire is conducted at head quarter of FECON. The author sends an email to all people at the firm with questionnaire is attached. After the first three days, there are 104 questionnaires are returned. It does not meet the requirement of 299 questionnaire. Therefore, the author decides coming directly to different department at the firm to collect the information. Thanks to significant support of the author’s colleagues who working at functional departments, the author persuaded many participants to join the survey. Eventually, 299 responses were collected after five days of implementation.
3.6 Data analysis method
The relationship between employees’ loyalty and the fators are explored by using three statistical treatments, namely descriptive statistics, reliability test analysis and ANOVA analysis. These statistical treatments are conducted by using SPSS software that is known common analytic tools in academic level.
Reliability test analysis is used to explore the reliability level of the survey scale. It can be done by using Cronbach’s alpha term and the reliability level is acceptable when
14
Cronbach’s alpha is higher than 0.6. On the other hand, Hair et al. (2011) assert that the researchers should check two statistical indicators in reliability test, including the Corrected Item-Total Correlation value should be higher than 0.3 and Cronbach’s alpha if Item Deleted should be lower than Cronbach’s alpha in overall.
Descriptive statistics is fundamental analysis and it helps the author to recognize the data pattern. Applying descriptive statistics in this study, the author will know how many employees choose strongly disagree, disagree, neutral, agree, and strongly agree with the questionnaire’s context. The author attempts using graphs to illustrate for data pattern and the level of agree of the respondents.
ANOVA is variance analysis and it consists of One Sample T-Test and One Way ANOVA. The first test is used when target variable only has two aspect such as gender with male and female while the second test is applied with target variable has more than two aspects such as age, job position and income level. ANOVA test also uses p-value as statistical indicator to recognize the different. In more detail, p-value higher than 0.05 indicates for no difference while p-value less than 0.05 indicates for difference between aspects of target variable.
3.7 Reliability test analysis
The next data analysis is reliability test with Cronbach’s alpha to be applied. As mentioned in Chapter 3, the author will conduct reliability test with three checking: (1) Cronbach’s alpha value must be higher than 0.6; (2) Corrected item-total correlation value must be higher than 0.3, and (3) Cronbach’s alpha if item deleted must be lower than Cronbach’s alpha received in the first checking.
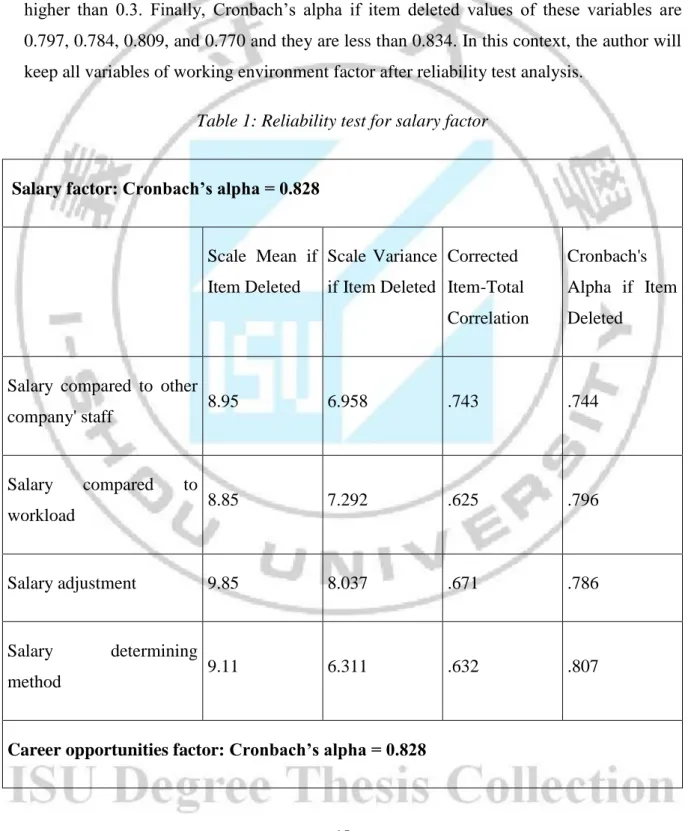
Table 1 shows that Cronbach’s alpha of salary factor is 0.828 and it is considered as good reliability scale level. Furthermore, four variables of this factor gain Corrected item-total correlation values of 0.743, 0.625, 0.671, and 0.632 and they are all higher than 0.3. Finally, Cronbach’s alpha if item deleted values of these variables are 0.744, 0.796, 0.786, and 0.807 and they are less than 0.828. In this context, the author will keep all variables of salary factor after reliability test analysis.
Table 1 shows that Cronbach’s alpha of career opportunities factor is 0.828 and it is considered as good reliability scale level. Furthermore, four variables of this factor gain
15
Corrected item-total correlation values of 0.641, 0.704, 0.664, and 0.617 and they are all higher than 0.3. Finally, Cronbach’s alpha if item deleted values of these variables are 0.791, 0.762, 0.781, and 0.801 and they are less than 0.828. In this context, the author will keep all variables of career opportunities factor after reliability test analysis.
Table 1 shows that Cronbach’s alpha of working environment factor is 0.834 and it is considered as good reliability scale level. Furthermore, four variables of this factor gain Corrected item-total correlation values of 0.653, 0.681, 0.625, and 0.710 and they are all higher than 0.3. Finally, Cronbach’s alpha if item deleted values of these variables are 0.797, 0.784, 0.809, and 0.770 and they are less than 0.834. In this context, the author will keep all variables of working environment factor after reliability test analysis.
Table 1: Reliability test for salary factor
Salary factor: Cronbach’s alpha = 0.828
Scale Mean if Item Deleted Scale Variance if Item Deleted Corrected Item-Total Correlation Cronbach's Alpha if Item Deleted
Salary compared to other
company' staff 8.95 6.958 .743 .744 Salary compared to workload 8.85 7.292 .625 .796 Salary adjustment 9.85 8.037 .671 .786 Salary determining method 9.11 6.311 .632 .807
16 Scale Mean if Item Deleted Scale Variance if Item Deleted Corrected Item-Total Correlation Cronbach's Alpha if Item Deleted Superiors' Intrinsic Recognition 10.52 5.016 .641 .791 Frequency of Intrinsic Recognition 10.32 4.777 .704 .762 Superiors' Extrinsic Recognition 10.43 4.689 .664 .781 Frequency of Extrinsic Recognition 10.38 5.095 .617 .801
Working environment factor: Cronbach’s alpha = 0.834
Scale Mean if Item Deleted Scale Variance if Item Deleted Corrected Item-Total Correlation Cronbach's Alpha if Item Deleted Salary Stability 10.85 7.784 .653 .797 Job Stability 10.70 7.481 .681 .784
Job Tasks matching
abilities 10.77 7.207 .625 .809
17
Chapter 4 DATA ANALYSIS AND RESULTS
4.1 Demographic information
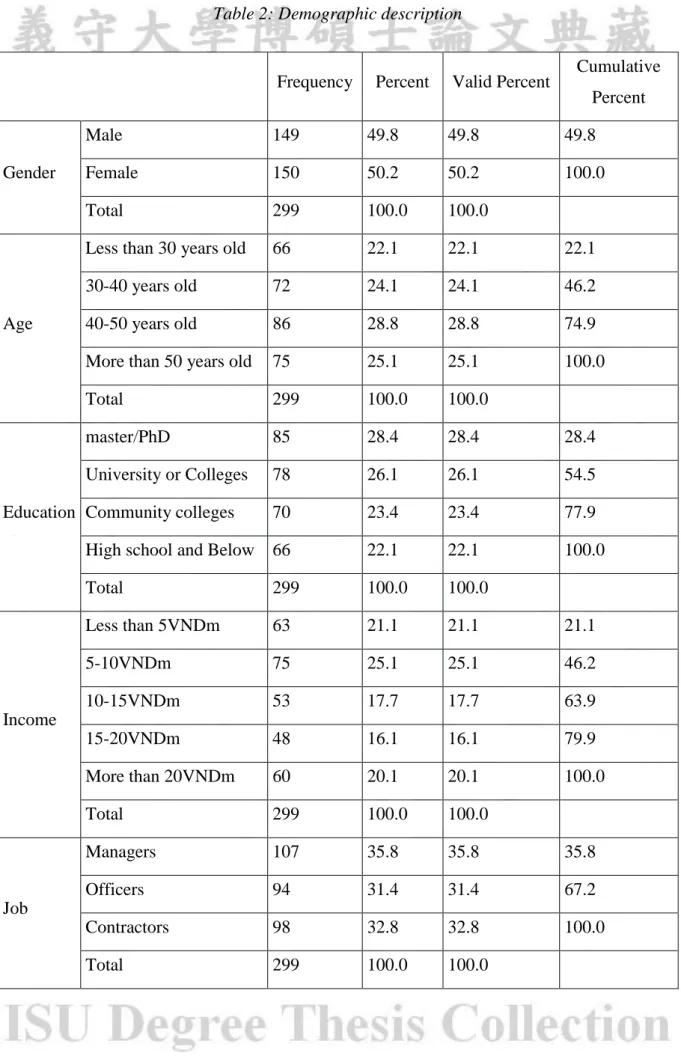
Two-hundred-ninety-nine usable questionnaires were collected for employees who worked at FECON in March 2015. Results show that 49.8% are male and 50.2% are female (Table 2). Results show that age groups can be categorized in four major groups (less than 30 years old, 30-40 years old, 40-50 years old, and more than 50 years old) are 22.1%, 24.1%, 28.8%, and 25.1% respectively. In this context, the major conclusion is that the employees at FECON have age distributed equally between different stage of life. The company tries to balance between young employees and old employees as young employees are very enthusiastic while old employees often have better experiences in term of working and people management.
In terms of education, results reflect that there 28.4% with Master/PhD, 26.1% with colleges degree, 23.4% with community colleges degrees. In come, there are 21% less than 5VNDm, 25.1% 5-10VNDm, 17.7% 15-20VNDm, and 20.1% more than 20VNDm. This result also represents for the current situation of FECON whether the company conducts a policy of equal income distribution between labors.
Table 2 shows that there are 107 managers, 94 officers, and 98 contractors that are involved into the survey of questionnaire. The portion therefore is 35.8% of managers, 31.4% of officers, and 32.8% of contractors.
18
Table 2: Demographic description
Frequency Percent Valid Percent Cumulative Percent Gender Male 149 49.8 49.8 49.8 Female 150 50.2 50.2 100.0 Total 299 100.0 100.0 Age
Less than 30 years old 66 22.1 22.1 22.1
30-40 years old 72 24.1 24.1 46.2
40-50 years old 86 28.8 28.8 74.9
More than 50 years old 75 25.1 25.1 100.0
Total 299 100.0 100.0
Education
master/PhD 85 28.4 28.4 28.4
University or Colleges 78 26.1 26.1 54.5
Community colleges 70 23.4 23.4 77.9
High school and Below 66 22.1 22.1 100.0
Total 299 100.0 100.0 Income Less than 5VNDm 63 21.1 21.1 21.1 5-10VNDm 75 25.1 25.1 46.2 10-15VNDm 53 17.7 17.7 63.9 15-20VNDm 48 16.1 16.1 79.9 More than 20VNDm 60 20.1 20.1 100.0 Total 299 100.0 100.0 Job Managers 107 35.8 35.8 35.8 Officers 94 31.4 31.4 67.2 Contractors 98 32.8 32.8 100.0 Total 299 100.0 100.0
19
4.2 Descriptive Statistics
The next data analysis is descriptive statistics and the author applies this analysis for three variables in the conceptual research model, namely salary, career opportunities, and working environment. The author will apply the concept of Sekaran (2003) of which this researcher proposes using mean value to explore the current level of agree or disagree of the respondents towards the survey’s statements.
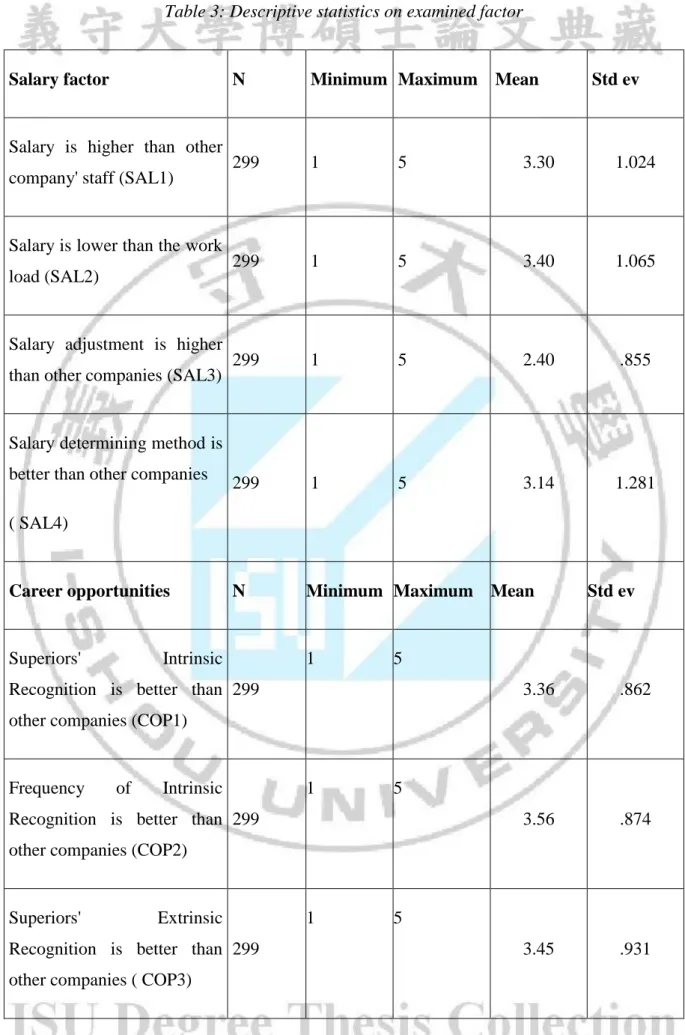
Table 3 shows that salary factor included by four variables, namely Salary compared to other company' staff (SAL1), Salary compared to workload (SAL2), Salary adjustment (SAL3), and Salary determining method (SAL4). The mean values of SAL1, SAL2, SAL3, and SAL4 are 3.30, 3.40, 2.40, and 3.14. This means that the employees disagree with the current salary adjustment policies in FECON. In fact, the company does establish salary adjustment but the adjustment is very minor.
Table 3 shows that career opportunities factor have four variables, namely Superiors' Intrinsic Recognition (COP1), Frequency of Intrinsic Recognition (COP2) Superiors' Extrinsic Recognition (COP3), and Frequency of Extrinsic Recognition (COP4). The mean values of COP1, COP2, COP3, and COP4 are 3.36, 3.56, 3.45, and 3.51, meaning that the employees strongly agree with statements related to COP2 and COP4 as their mean values higher than 3.5. In addition, neutral attitude (neither disagree nor agree) is towards COP1 and COP3 as their mean values are in between 2.5 and 3.5.
Table 3 shows that working environment factor has four aspects, namely Salary Stability (WEN1), Job Stability (WEN2), Job Tasks matching abilities (WEN3), and Job Rotation (WEN4). The mean values of WEN1, WEN2, and WEN3 are 3.73, 3.89, 3.82, and 3.15. Only the last variable (WEN4) has mean value less than 3.5 and higher than 2.5, meaning that the employees have neutral attitude with current job rotation in FECON and they are happy with salary stability, job stability, an job tasks matching with abilities of the employees.
20
Table 3: Descriptive statistics on examined factor
Salary factor N Minimum Maximum Mean Std ev
Salary is higher than other
company' staff (SAL1) 299 1 5 3.30 1.024
Salary is lower than the work
load (SAL2) 299 1 5 3.40 1.065
Salary adjustment is higher
than other companies (SAL3) 299 1 5 2.40 .855
Salary determining method is better than other companies ( SAL4)
299 1 5 3.14 1.281
Career opportunities N Minimum Maximum Mean Std ev
Superiors' Intrinsic Recognition is better than other companies (COP1)
299
1 5
3.36 .862
Frequency of Intrinsic Recognition is better than other companies (COP2)
299
1 5
3.56 .874
Superiors' Extrinsic Recognition is better than other companies ( COP3)
299
1 5
21 Frequency of Extrinsic
Recognition is better than other companies (C0P4)
299
1 5
3.51 .861
Valid N (listwise) 299
Working environment N Minimum Maximum Mean Std ev
Salary Stability is better than other companies ( WEN1) 299
1 5
3.73 .968
Job Stability is better than other companies ( WEN2) 299
1 5
3.89 1.007
Job Tasks matching abilities is better than other companies
(WEN3)
299
1 5
3.82 1.125
Job Rotation is better than other companies (WEN4) 299
1 5
3.15 1.170
Valid N (listwise) 299
In order to validate the first hypothesis about how salary, career opportunities and working environment and employees loyalty related to each other, the author uses cross-tabulation analysis. Table 4 shows that the employees who have neutral attitude on salary compared to others banks staffs also have neutral loyalty level. The second variable of salary factor is about salary compared to the workload and data shows that neutral agree on this variable employees also have neutral loyalty level. This trend is also happened for the third variable while the last variable, the customers who disagree with this context also have lower loyalty.
22
Table4: Descriptive statistics by cross-tabulation between salary and employees loyalty
Salary compared to other banks' staff * Overall employees' loyalty Crosstabulation
Overall employees' loyalty Total
Disagree Neutral Agree
Salary is higher than other company' staff Strongly disagree 8 14 0 22 Disagree 3 24 2 29 Neutral 2 93 21 116 Agree 0 66 36 102 Strongly agree 0 17 13 30 Total 13 214 72 299
Salary compared to workload * Overall employees' loyalty Crosstabulation
Overall employees' loyalty Total
Disagree Neutral Agree
Salary is lower than the workload Strongly disagree 10 12 0 22 Disagree 1 21 3 25 Neutral 2 87 15 104 Agree 0 65 41 106 Strongly agree 0 29 13 42 Total 13 214 72 299
23
Overall employees' loyalty Total
Disagree Neutral Agree
Salary determining method is better than other companies Strongly disagree 6 28 2 36 Disagree 6 43 12 61 Neutral 1 71 11 83 Agree 0 43 19 62 Strongly agree 0 29 28 57 Total 13 214 72 299
Salary adjustment * Overall employees' loyalty Crosstabulation
Overall employees' loyalty Total
Disagree Neutral Agree
Salary adjustment is higher than other companies Strongly disagree 5 32 2 39 Disagree 8 107 17 132 Neutral 0 58 40 98 Agree 0 15 13 28 Strongly agree 0 2 0 2 Total 13 214 72 299
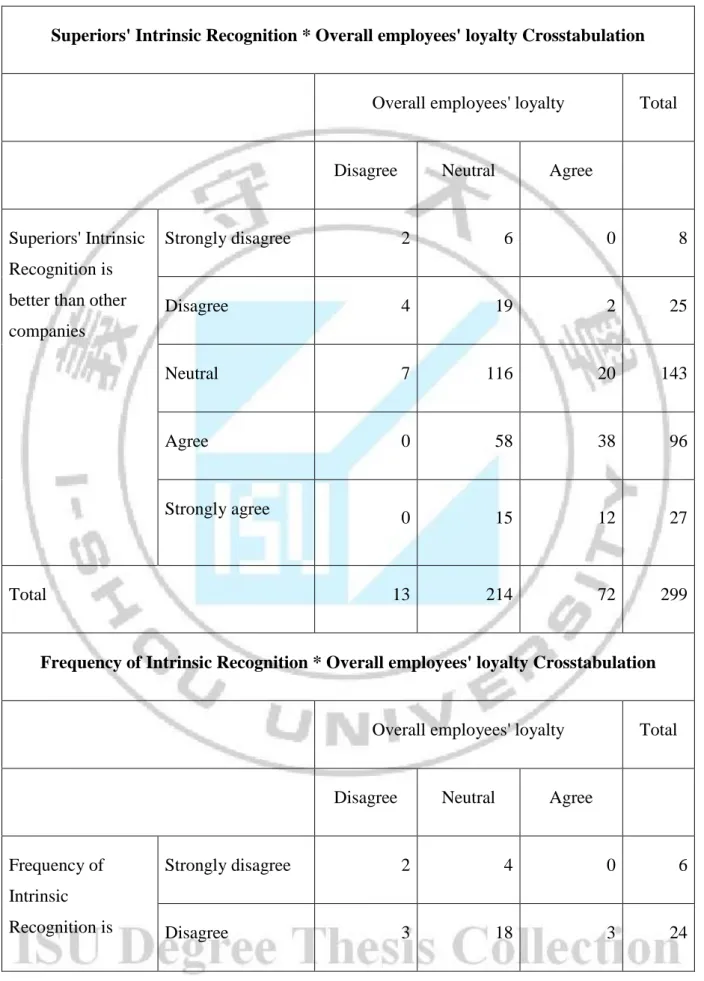
Table 5 shows that the employees who have neutral attitude towards the statement of Superiors' Intrinsic Recognition is better than other companies also have neutral loyalty level. The employees who have agree on Frequency of Intrinsic Recognition is better than other companies also have high loyalty level or on the other hand the frequency of intrinsic recognition impacts to employees loyalty level. Finally, the neutral attitude on two last factors impacting on neutral loyalty level.
24
Table 5: Descriptive statistics by cross-tabulation between career opportunities and employees loyalty
Superiors' Intrinsic Recognition * Overall employees' loyalty Crosstabulation
Overall employees' loyalty Total
Disagree Neutral Agree
Superiors' Intrinsic Recognition is better than other companies Strongly disagree 2 6 0 8 Disagree 4 19 2 25 Neutral 7 116 20 143 Agree 0 58 38 96 Strongly agree 0 15 12 27 Total 13 214 72 299
Frequency of Intrinsic Recognition * Overall employees' loyalty Crosstabulation
Overall employees' loyalty Total
Disagree Neutral Agree
Frequency of Intrinsic Recognition is
Strongly disagree 2 4 0 6
25 better than other
companies Neutral 6 82 13 101 Agree 2 92 39 133 Strongly agree 0 18 17 35 Total 13 214 72 299
Superiors' Extrinsic Recognition * Overall employees' loyalty Crosstabulation
Overall employees' loyalty Total
Disagree Neutral Agree
Superiors' Extrinsic Recognition is better than other companies Strongly disagree 0 6 0 6 Disagree 6 19 5 30 Neutral 7 99 23 129 Agree 0 64 26 90 Strongly agree 0 26 18 44 Total 13 214 72 299
26
Overall employees' loyalty Total
Disagree Neutral Agree
Frequency of Extrinsic Recognition is better than other companies Strongly disagree 0 3 0 3 Disagree 8 13 4 25 Neutral 5 108 15 128 Agree 0 74 30 104 Strongly agree 0 16 23 39 Total 13 214 72 299
Table 6 shows that Job Tasks matching abilities is better than other companies and Job Stability is better than other companies are two main factors impacting on employees loyalty at FECON. Other variables shows neutral loyalty level of the employees
27
Table 6: Descriptive statistics by cross-tabulation between working environment and employees loyalty
Salary Stability * Overall employees' loyalty Crosstabulation
Overall employees' loyalty Total
Disagree Neutral Agree
Salary Stability is better than other companies Strongly disagree 1 5 1 7 Disagree 1 15 0 16 Neutral 9 84 8 101 Agree 0 66 36 102 Strongly agree 2 44 27 73 Total 13 214 72 299
Job Stability * Overall employees' loyalty Crosstabulation
Overall employees' loyalty Total
Disagree Neutral Agree
Job Stability is better than other
Strongly
28 companies Disagree 1 21 0 22 Neutral 5 55 8 68 Agree 2 73 32 107 Strongly agree 4 60 32 96 Total 13 214 72 299
Job Tasks matching abilities * Overall employees' loyalty Crosstabulation
Overall employees' loyalty Total
Disagree Neutral Agree
Job Tasks matching abilities is better than other companies Strongly disagree 1 7 0 8 Disagree 3 25 9 37 Neutral 5 49 8 62 Agree 4 62 21 87 Strongly agree 0 71 34 105 Total 13 214 72 299
29
Overall employees' loyalty Total
Disagree Neutral Agree
Job Rotation is better than other companies Strongly disagree 1 11 0 12 Disagree 2 76 18 96 Neutral 4 58 17 79 Agree 4 38 17 59 Strongly agree 2 31 20 53 Total 13 214 72 299
4.3 ANOVA analysis
The first ANOVA analysis Independent Sample T-Test for gender variable with result is presented in the table below:
Table 7 shows that T-Test returns the p-value for overall employees’ loyalty is 0.745 for equal variances assumed, meaning that there is no difference between male and female in term of their assessment on emloyees’ loyalty.
30
Table 7: Independent sample T-Test for gender
Levene's Test for Equality
of Variances
t-test for Equality of Means
F Sig. t df Sig. (2-tailed) Mean Difference Std. Error Difference 95% Confidence Interval of the Difference Lower Upper Overall employees' loyalty Equal variances assumed .762 .384 -.326 297 .745 -.019 .057 -.132 .094 Equal variances not assumed -.326 296.464 .745 -.019 .057 -.132 .094
Table 8 shows that F-Test of overall employees’ loyalty is 0.212 The Sig. values is 0.888, meaning that the employees who have different age do not have different assessment for these on emloyees’ loyalty.
Table 8: One-Way ANOVA for age
Sum of Squares df Mean Square F Sig. Overall employees' loyalty Between Groups .158 3 .053 .212 .888 Within Groups 73.200 295 .248 Total 73.358 298
31
Table 9 shows that F-Test of overall employees’ loyalty is 1.117. The Sig. values is 0.343 meaning that the employees who have different education do not have different assessment for emloyees’s loyalty.
Table 9: One-Way ANOVA for education
Sum of Squares df Mean Square F Sig. Overall employees' loyalty Between Groups .824 3 .275 1.117 .343 Within Groups 72.534 295 .246 Total 73.358 298
Table 10 shows that F-Test of overall employees’ loyalty is 0.094. The Sig. values is 0.984 meaning that the employees who have different income do not have different assessment for employees’ loyalty.
Table 10 : One-Way ANOVA for monthly income
Sum of Squares df Mean Square F Sig. Overall employees' loyalty Between Groups .094 4 .023 .094 .984 Within Groups 73.264 294 .249 Total 73.358 298
32
Table 11 shows that F-Test of overall employees’ loyalty is 0.216. The Sig. values is 0.806, meaning that the employees who have different job position do not have different assessment for these factors.
Table 11: One-Way ANOVA for job position
Sum of Squares df Mean Square F Sig. Overall employees' loyalty Between Groups .107 2 .053 .216 .806 Within Groups 73.251 296 .247 Total 73.358 298 Within Groups 226.691 296 .766 Total 228.046 298
33
Chapter 5 CONCLUSION AND
RECOMMENDATION
5.1 Conclusion
Results show that the employees disagree with the current salary adjustment policies in FECON and the employees have neutral attitude with current job rotation in FECON and they are happy with salary stability, job stability, and job tasks matching with abilities of the employees. IN addition, Job Tasks matching abilities is better than other companies and Job Stability is better than other companies are two main factors impacting on employees loyalty at FECON. Employees who have neutral attitude on salary compared to others banks staffs also have neutral loyalty level. The second variable of salary factor is about salary compared to the workload and data shows that neutral agree on that employees also have neutral loyalty level. This trend happened for the third variable while the last variable, the customers who disagree with this context also have lower loyalty. Finally, The employees who have agree on Frequency of Intrinsic Recognition is better than other companies also have high loyalty level or on the other hand the frequency of intrinsic recognition impacts to employees loyalty level.
H1: Salary, career opportunities, working environment and employees’ Loyalty are related Results also showed that, there were no difference between gender, age, education, monthly income and job position, which impact on the employees’ loyalty.
H2: There is no differences in socio – demographic and employees’ loyalty.
5.2 Recommendation
Based on key findings above, there are several recommendations that have been made: First, the employees do not agree with the context of the current salary adjustment policies in FECON is good. In this context, the company should review the salary of the employees in annual basis. In addition, the company should have candid communication towards the employees. Communication is the most effective channel between employees with employees and employees with their manager. Through communication employees and
34
managers have their opportunity to voice their expectation and they way they should behave to achieve such results. In order to establish an effective communication environment each employees and managers must create a friendly working environment where everyone feels free to raise their concerns, ideas and have opportunity to receive feedback. Besides, ever employees must create themselves a well listening attitude and ready to improve themselves to adapt expectation from other.
Second, salary factor plays critical role towards employees’ loyalty level and this factor in fact has highest impact to loyalty level of the employees. To motivate team members to achieve the company’s objectives, FECON must build a consistent system to monitor employees’ performance where objectives should be set at beginning of each performance year to identify employers’ expectations to each employee regarding job description. The objective must be measurable and achievable and agreed by employees before documenting. On going process and achievement must be updated time to time. Communication and feedback should be given frequently on these objectives and achievement to ensure each employee is encouraged and guided how to achieve their expected target. Reward and incentive should be provided consistent with employees’ performance to show that employees’ performance is recognized and appraised reasonably. Another recommendation should be given to improve employees’ loyalty level. Top management has a huge affect in corporate culture as well as human resources policy, play an important role in maintaining and improving employees’ satisfaction. It is recommended that top manager must set the elements of employees satisfaction such as values, belief, measure, and taking appropriate actions to improve the efficiency of corporate culture management, ensuring that the employees’ satisfaction is managed and carried out by actions and learning rather than words.
Line management is the most supportive level to improving employees’ willingness to engage in development activities through their conservation and communication with employees. It is suggested that a line manager should be involved in promoting learning and career development of employees.
Therefore, the link between line management to employee satisfaction can be shown by the way that line management takes responsibility in structuring and delivering learning opportunities to their employees in the respect of employees satisfaction. Line managers
35
provide coaching and guidance, and they are the ones that lead teams to stimulate the learning of team members. Line managers also have a key, and perhaps more traditional, role to play in conducting feedback, performance appraisals and agreeing individual development plans. They are all necessary aspects to create favorable working environment as well as corporate culture.
5.3 Research Limitations
The study has some limitations. First, the study comes up with the application of quantitative research method and the achievement therefore is more toward quantitative point of view. However, the study’s topic is not likely to measure by quantitative approach but also requiring the qualitative assessment.
5.4 Directions/Suggestions for Future Research
Regarding to the research limitation, this study comes up with some suggestion for future research. First, other researchers should take into account another factors outside of salary factor, career opportunities factor, and working environment factor. Moreover, other researchers should consider the qualitative researches in order to further improve the assessment on loyalty level of the employees.
36
References
1. Alberti, A., and Bertucci, G. (2006). Replicating innovations in governance. In
Innovations in Governance and Public Administration: Replicating What Works. New
York, NY: United Nations
2. Avolio, B.J., Waldman, D.A. & Yammarino, F.J. (1991). Leading in the 1990’s: the four I’s of transformational leadership. Journal of European industrial training, 15(4), pp1-8
3. Bacon, N., and Blyton, P. (2006). Union co-operation in a context of job insecurity: Negotiated outcomes from team working. British Journal of Industrial Relations, 44(2), pp.215-23
4. Banker, R.D., Field, J.M., Schroeder, R.G. and Sinha, K.K. (1996), Impact of work teams on manufacturing performance: A longitudinal field study. Academy of
Management Journal, 39(4), pp.867-890
5. Becker, F.D. (1981). Workspace: Creating Environments in Organizations. New York: Praeger
6. Blaikie, N. (1993). Approaches to Social Enquiry. 1st ed. Polity Press, Cambridge 7. Bishop, C. M. (2007). Pattern Recognition and Machine Learning (Information
Science and Statistics). Springer
8. Boxill,L., Chambers, C.L., and Wint, E. (2009). Introduction to Social Research: With
Applications to the Caribbean. Jamaica: Canoe Press
9. Briffa, K. R., Osborn, T, J., Schweingruber, F. H., Harris, I. C., Jones, P.D., Shiyatov, S. G. and Vaganov, E. A. (2001), Low-frequency temperature variations from a northern tree-ring density network. J. Geophys. Res., 106, pp.2929 – 2941 10. Brill, M. M. and Konar, E. (1984) Using Office Design to Increase Productivity.
Workplace Design and Productivity. Buildings/IAQ, 1(2), pp.495-500
37
12. Burney, S. M. (2008). Inductive & Deductive Research Approach. University of
Karachi. Available at
<http://www.drburney.net/INDUCTIVE%20&%20DEDUCTIVE%20RESEARCH%2 0APPROACH%2006032008.pdf>. [Accessed on 5th June 2013]
13. Clements-Croome, D. (2000). Indoor environment and productivity, in Creating The
Productive Workplace. London: E & FN Spon
14. Conti, B., and Kleiner, B. (2003). How to increase teamwork in organizations. Journal
of Quality, 5(1), pp.26-29
15. Corporate Leadership Council. (2003). Linking Employee Satisfaction with Productivity, Performance, and Customer Satisfaction. Corporate Executive Board. Available at < http://www.keepem.com/doc_files/clc_articl_on_productivity.pdf> [Accessed on 5th June 2013]
16. Chowdhury, S. K. (2006). Investments in ICT-capital and economic performance of
small and medium scale enterprises in East Africa. Journal of International
Development, 18(4), pp.533-552
17. Chua, A. (2003). Knowledge sharing: a game people play. Aslib Proceedings, 55(3), pp.11 -129
18. Cohen, S. G. and bailey, D. E. (1999). What Makes Teams Work: Group Effectiveness Research from the Shop Floor to the Executive Suite. Available at < http://jom.sagepub.com/content/23/3/239.abstract> [Accessed on 5th June 2013] 19. Conrad, C. and Poole, P. M. (1998). Strategic organizational communication: Into the
twenty-first century. 4th ed. Harcourt Brace College Publishers
20. Cummings, T. G. (2003). Self-regulating work groups: A socio-technical synthesis.
Academy of Management Review, 3, pp.625–634
21. Cushman, D. P., and Craig, R. T. (1976). Communication systems: Interpersonal implications. Exploration in interpersonal communication. Beverly Hills, CA: Sage 22. Davis, T. R. V. (1984). The Influence of the Physical Environment in Offices. The
38
23. Davison, R. M. (1998). An Action Research Perspective of Group Support Systems.
City University of Hong Kong. Available at
<http://www.is.cityu.edu.hk/staff/isrobert/phd/ch3.pdf> [Accessed on 5th June 2013] 24. Deetz, S. A. (1994). Future of the discipline: The challenges, the research, and the
social contribution. Thousand Oaks, CA: Sage
25. Denzin, N. and Lincoln, Y. (2003). The Discipline and Practice of Qualitative
Research. 2nd ed. SAGE Publications, Inc., California
26. Denzin, N. K., Lincoln, Y. S., and Giardina, M. D. (2005). Disciplining qualitative research. International Journal of Qualitative Studies in Education, 19(6), pp.769-782 27. Dubois, A. and Gadde, L-E. (2002). Systematic combining: an abductive approach to
case research. Journal of Business Research, 55(2002), pp.533-560
28. Dutta, A. (2007). On the road in Vietnam: sizing up the next Asian tiger. CLSA Asia
Pacific Markets. Available at
<http://www.tckgroup.org/files/Final_paper_GIM_Southeast_Asia.pdf> [Accessed on 5th June 2013]
29. Easterby-Smith, M., Thorpe, R. and Jackson, P. (2008). Management Research. 3rd ed. SAGE Publications Ltd., London
30. Education Queensland. (2012). Queensland response to the draft Shape of the Australian Curriculum: Health and Physical Education. Available at <http://www.qsa.qld.edu.au/downloads/approach/aus_curriculum_qld_response_hpe.p df> [Accessed on 5th June 2013]
31. Eriksson, P. and Kovalainen, A. (2008). Qualitative Methods in Business Research. 1st ed. SAGE Publications Ltd., London
32. European Foundation for the Improvement of Living and Working Conditions. (2007). Teamwork and high performance work organisation. Available at <http://www.eurofound.europa.eu/ewco/reports/TN0507TR01/TN0507TR01.pdf> [Accessed on 5th June 2013]
39
33. Flowers, P. (2009). Research Philosophies – Importance and Relevance. MSc by Research. Available at
<http://www.networkedcranfield.com/cell/Assigment%20Submissions/research%20ph ilosophy%20-%20issue%201%20-%20final.pdf> [Accessed on 24th June 2013]
34. Frey, B.S. and Jegen, R., (2001). Motivation crowding theory: a survey of empirical evidence. Journal of Economic Surveys, 15(5), pp589-611
35. Froebel, P., and Marchington, M. (2005). Teamwork structures and worker perception: a cross national study in pharmaceuticals. International Journal of Human Resource
Management, 16(2), pp.256-276
36. Galliers, R.D. (1991), Choosing Information Systems Research Approaches,
Information Systems Research. R. Galliers (Ed). Blackwell Scientific Publications,
Boston, MA
37. Given, L. M. (2008). Qualitative research methods. Thousand Oaks, CA: Sage Publications
38. Glassop, L. (2002). The organizational benefits of teams. Human Relations, 55(2), pp.225-249
39. Griffin, M. A., Patterson, M. G. and West, M. A. (2001). Job satisfaction and teamwork: the role of supervisor support. Journal of Organizational Behaviour, 22(5), pp.537-550
40. Hamidifar, F., (2009). A Study of the Relationship between Leadership Styles and
Employee Job Satisfaction at Islamic Azad University Branches in Tehran, Iran.
Assumption University, Graduate School of Business
41. Hatch, M. J. and Cunliffe, A. L. (2006). Organization Theory. 2nd ed. Oxford University Press, Oxford
42. Hayday, S., (2003). Staff Commitment is the Key to an Improved Performance. Personnel Today
43. Heathfield, S. M., (2010). Key to Employees Satisfaction: What Can Do To Increase
40
<http://humanresources.about.com/od/employeesatisfaction/a/employee_satisfaction.h tm> [Accessed on 5th June 2013]
44. Hoe, P. T. (2012). Human Resource Management in transitional economy in Vietnam. International Businesses
45. Hooff, B. V. D. and Hendrix, L. (2011). Eagerness And Willingness to Share: The
Relevance of Different Attitudes towards Knowledge Sharing. Amsterdam School of
Communications Research, University of Amsterdam, The Netherlands
46. Hsu, I. (2006). Enhancing employee tendencies to share knowledge – Case studies of nine companies in Taiwan. International Journal of Information Management, 26, pp.326-338
47. Hunter, L. T. B., K. Pretorius, L. C. Carlisle, M. Rickelton, C. Walker, R. Slotow, and J. D. Skinner. (2007). Restoring lions Panthera leo to northern KwaZulu-Natal, South Africa: short-term biological and technical success but equivocal long-term conservation. Oryx 41, pp.196–204
48. Ingram, H. (2000). Linking teamwork with performance. Journal of Team
Performance Management, 2(4), pp.5-10
49. Jones, A., Richard, B., Paul, D., Sloane K., and Peter, F. (2007). Effectiveness of teambuilding in organization. Journal of Management, 5(3), pp.35-37
50. Katzell, R. A., (1964). Personal values, job satisfaction, and job behavior. Man in a world of work. Boston: Houghton Miffiin
51. Kerlinger, F. N.(2005). Foundations of Behavioural Research.3rd ed. Holt, Rinehart, and Winston
52. Kim, S. (2006). The Impact of Organizational Context and Information Technology on Employee Knowledge-Sharing Capabilities. Public Administration Review, 66(3), pp.370-385
53. Kim, S. and Ju, B. (2008). An Analysis of Faculty Perceptions: Attitudes toward
Knowledge Sharing and Collaboration in an Academic Institution. Library
41
54. Lawler, E. E. and Porter, L. W. (1967). The Effect of Performance on Job Satisfaction.
Industrial Relations, 7, pp.20–28
55. Leaman, A. (1999). UK study links productivity to ventilation systems. HPAC
Magazine, 71(11), pp.14
56. Liu, J. and Cho, S. (2009). Examining the Relationship between Knowledge Sharing
and Performance Rewards in the Hospitality Industry. Food and Hospitality System,
University of Missouri
57. Locke, E. A., (1969). What is Job Satisfaction? Organizational Behaviour and Human
Performance, 4, pp309-336
58. Madlock, P.E. (2008). The link between leadership style, communicator competetence, and employee satisfaction. Journal of Business Communication, 45 (1), pp.61-78
59. McDermott, R. and O’Dell, C. (2001). Overcoming cultural barriers to sharing knowledge. Journal of Knowledge Management, 5(1), pp.7 -85
60. McCoy, J. M. (2005). Linking the Physical Work Environment to Creative Context. The Journal of Creative Behavior, 39(3), pp.167-189
61. McLean, P., J. M., and Schmedemann, D. (1994). When promises become contracts:
Implied contracts and handbook provisions on job security. Human Resource
Management
62. Meena, M. L. and Dangayach, G. S. (2012). Analysis of Employee Satisfaction in Banking Sector. International Journal of Humanities and Applied Sciences (IJHAS), 1(2), pp.78-81
63. Melissa, B. S., (2004), Employees Satisfaction and Performance: A Study of RC Hotel Company Kitchen Environment. University of New Orleans
64. Mellenbergh, G.J., (2008). Advising on Research Methods: A consultant's companion. Huizen, The Netherlands: Johannes van Kessel Publishing