Model-Based Multi-modal Information Retrieval from Large Archives
Chung-Sheng Li, Yuan-Chi Chang, Lawrence D. Bergman, and John R. Smith
IBM T. J. Watson Research Center, P. O. Box, 704, Yorktown Heights, NY 10598
E-mail: {csli,yuanchi,bergmanl,jsmith}@us.ibm.com
Abstract
In this paper, we describe a new paradigm for information retrieval in which the retrieval target is based on a model. Three types of models – linear, finite state, and knowledge models are discussed. These information retrieval scenarios often arise from applications such as environmental epidemiology, oil/gas production and exploration, and precision agriculture/forestry. Traditional model-based data and information processing usually requires the processing of each and every data points. The proposed new framework, in contrast, will process the data progressively using a set of progressive models and utilize indexing techniques specialized for the model to facilitate retrieval, thus achieving a dramatic speedup.
1. Introduction
Most existing information retrieval applications are based on similarity retrieval of templates or examples, such as similarity retrieval of text and image documents. In such retrievals, the query usually consists of a number of keywords or phrase (for text retrieval), or features of an image (for image retrieval) [4-10]. Each of the documents (text or image) in the database is usually represented as one or more vector(s) in a multi-dimensional feature space. The query processing of such similarity retrieval usually involves identifying in the feature space those vectors that have the smallest Euclidean distance to the vector that corresponds to the query target.
This similarity retrieval paradigm, however, is not entirely suitable for many scientific and business decision support applications, which are mostly based on models. For examples:
• Environmental epidemiology: Many environmental epidemic diseases such as Denge fever, Hantavirus Pulmonary Syndrome (HPS), malaria, and Lyme disease are usually carried by insects or rodents. There already exist various disease outbreak models that incorporate remotely sensed images, weather information, GIS (geographic information system) and demographic information to predict the location of the outbreak. The results of these models can then
be used to assess the risk of various regions to a major disease outbreak.
• Fire ants: Fire ants can cause severe damages to crops and livestock. So it is important to be able to predict when and where these fire ants will fly. Model already exists for predicting this information based on a combination of ground moisture (can be extrapolated from remotely sensed images), and temperature (which is monitored by the weather stations).
• Oil/gas production and exploration: Oil and gas explorations frequently require the integration (or fusing) of information from seismic data and various instruments. The integration and fusing of information is frequently performed based on various knowledge models. As an example, a geologist may be looking for a strata region consisting of shale, on top of sandstone, on top of siltstone. Additional specifications such as the Gamma Ray response has to be higher than a certain number can also be included in the specifications.
• Precision agriculture and forestry: These applications usually provide site-specific crop or forest management. Area of interests may include monitoring the growth condition, determining the optimal time for harvesting, monitoring the watershed condition, etc. Many of these applications may involve the integration (or fusion) of multi-modal information to produce the final interpretation. The main challenge of applying models to large archives is scalability. Although most of the applications only require the retrieval of a very small subset of the results that maximize or minimize the model, almost all existing methods require applying the model sequentially over the entire region of the data. In this paper, we propose a model-based information retrieval framework to address this challenge. The main components of this framework include
• Decompose the model into a progressively represented model,
• Decompose the data in the archive into a progressive data representation which consists of multiple abstraction levels (raw data, features, semantics and metadata) and multiple resolutions, and
• Apply model-specific indexing techniques on the data in the archive.
By using this framework, we have demonstrated that several order-of-magnitude speedups can be achieved for those applications described above.
The organization of this paper is as follows: Section 2 describes the preliminary of models that frequently arise in scientific and business decision support applications. The proposed model-based information retrieval framework is described in Section 3. The performance metric is defined in Section 4. Section 5 briefly summarizes this paper.
2. Preliminary
In this section, we will describe three types of model that are commonly encountered in model-based multi-modal information retrieval: linear model, finite state model, and knowledge model.
2.1 Linear Time-Invariant Model
A linear time-invariant model refers to a linear regression model and its variations. The model is time invariant as none of the coefficients of the model are time varying. In general, the model has the following form:
Y = a1X1+ a2X2+ …. + anXn,
where each Xi represents the data itself or derived
attributes/features from the multi-modal information sources, while the coefficient ai represents the weights
(relative contribution) of the attribute derived from the data. Well known techniques exist in deriving the “optimal” weights based on collections of data. As an example, in the Hantavirus Pulmonary Syndrome (HPS) example, the risk assessment model for the risk associated with a location (x,y) is:
R(x,y) = 0.443X1+ 0.222X2+ 0.153X3+ 0.183 X4,
where X1, X2, and X3correspond to the pixel value of band
4, 5 and 7 of Landsat Thematic Mapper image at location (x,y), while X4 corresponds to the elevation (in meters)
from the corresponding DEM (digital elevation map). In general, the weights of this model can be “trained” by using historical data (previous disease incident reports compiled by those public health officials) in conjunction with the corresponding images and other data. Methods such as linear regression techniques have been widely used to derive the optimal coefficients for the model.
A second example of the linear model is the credit risk modeling, such as the one used by FICO (Fair, Isaac & Co.) for evaluating the credit scores of individuals for
loan approval. The complete FICO credit score, which ranges from 300 to 900, has several hundred parameters with a model similar to the one below:
FICO = 900 – a1X1- …..- aNXN
where the attribute Xi’s include
•
Late payments• The amount of time credit that has been established
• The amount of credit used versus the amount of credit available
• Length of time at present residence
• Employment history
• Negative credit information such as bankruptcies, charge-offs, collections, etc.
The parameters have been chosen such that this model can accurately predict the probability of foreclosures. It has been shown that the probability of foreclosures is less than 2% when the score is higher than 680, while the probability of foreclosures increases to 8% if the score is less than 620.
2.2 Finite State Model
A finite state model usually involves the description of system states through the usage of finite state machines. Finite state machines have been used intensively for compiler design, natural language understanding, and sequential logic synthesis.
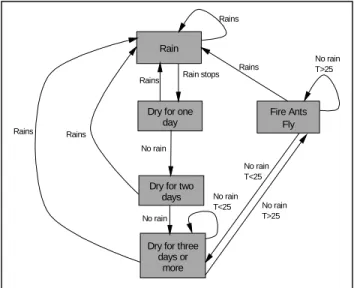
Finite state model is also a sophisticated modeling framework for many environmental, ecological, and economical phenomena. An example is the fire ants scenario, as shown in Fig. 1, in which the fire ants of a region will fly if the region has some rain fall, and then
Rain
Dry for one day
Dry for two days Fire Ants Fly Rains Rain stops Rains Rains Rains No rain No rain T>25 No rain T>25 No rain T<25
Dry for three days or more No rain Rains No rain T<25
Figure 1. Finite state model of the fire ants scenario.
remain dry for at least three days. In addition, the temperature needs to reach 25 degrees Celsius or higher for that region. In general, finite state model is widely used to describe models with complex behavior.
2.3 Bayesian Network and Knowledge Model
A Bayesian network is a graphical model for probabilistic relationships among a set of variables. It is also known as belief networks, causal networks, probabilistic networks, influence diagrams and knowledge maps. Bayesian networks can readily handle incomplete data sets, allow one to learn about causal relationships, and can be used in conjunction with Bayesian statistical techniques to facilitate combing domain knowledge and
data. Consequently, Bayesian network has become a popular representation for encoding expert knowledge in expert systems. Recently, methods have been developed to learn Bayesian networks from data.
As an example, the high risk houses that are vulnerable to Hantavirus Pulmonary Syndrome can consist of the following rules:
• Area of houses, which are
• surrounded by bushes, and has
• weather pattern of raining season followed by a dry season.
Figure 2 shows an example of such a region based on a high-resolution satellite image. The Bayesian network representation of this model is shown in Fig. 3. Note that this model is multi-modal, as it consists of data from images and weather pattern.
Another example, as shown in Fig. 3, shows the riverbed consisting of:
• shale, on top of
• sandstones, on top of
• siltstones, and
• the Gamma ray of these region is higher than 45. Note that this model is also multi-modal, as it consists of data from both images and well log traces (1D series).
3. Model-Based Information Retrieval
Model-based information retrieval emphasizes locating data series or subsets which not only satisfy the query model criterion but also best represent the class of selected data. Similar to other types of information retrieval, the top-K choices based on the ranking evaluated by the model is usually desired. Using the models described in the previous section as examples,
• The linear model is used to locate top-K sets of tuples (X1, X2,….,Xn) where the model described by the
house
bushes unusualraining
season dry season High Risk House house surrounded by bushes wet season followed by dry season
Figure 3. Bayesian network for representing regions with high risk to Hantavirus Pulmonary Syndrome.
shale sandstone siltstone adjacent < 10 ft. delta lobe
FMI
Figure 4. Example of a knowledge model in geology domain - riverbed consists of shale on top of Figure 2. Regions of high risks to Hantavirus
linear regression equation a1X1+ a2X2+…+ anXn is
maximized or minimized.
• The finite state model is used to locate the top-K data
patterns that satisfy a model that can be described by a finite state machine. When the finite state machine extracted from the data is slightly different from the target finite state machine, it is also possible to define a distance between these two finite state machines based on their similarities.
• The Bayesian network and knowledge models are
used to locate the top-K data patterns that satisfy the fuzzy and/or probabilistic rules specified within the model.
These models are usually tightly coupled with various decision support applications, as described in Section 1.
This problem is related to, though different from, the system identification problem. For input single-output systems, we denote the input to the system as X(t), and the output from the system as Y(t). The system, which is usually characterized by the system transfer function H(s), can be computed from the input X(s) and the output Y(s) of the system by using the following relationship:
H(s) = Y(s)/X(s)
where X(s), Y(s), and H(s) are the Laplace transformation of X(t), Y(t), and H(t), respectively. Once the system transfer function is identified, a system representation that has the identical system transfer function can then be constructed.
Similar to system identification problem, most of the existing approaches for model-based information
processing usually involve the following process (as shown in Fig. 5):
1. Develop a hypothetical decision model (linear model, finite state model, or knowledge model),
2. Using the available multi-modal data to fit the model and determine the model coefficients,
3. Use the model to identify and retrieve subset of the data that satisfy the model constraints
4. Use the retrieved data to revise the model.
5. Apply the revised model to a much bigger data set. 6. Repeat steps 3 and 4 as many times as necessary. The first two steps calibrate the model based on a training set, while the remaining steps involve applying the model for information retrieval, potentially on a very large archive. There have been intensive studies elsewhere for developing models based on small training set. Most existing methods will then require sequentially applying the model on the data in the data archive. Substantial re-computation on the entire data set is required even when there is a small revision of the model. There are very little investigations on speeding up model executions for large archives (required at step 5 in the workflow described above). Consequently, it is extremely difficult to make small revisions on the model based on the data archive.
In this paper, we propose the following framework to facilitate a substantial speedup on model-based information retrieval: (1) progressive model execution using progressive data representation and, (2) high-dimensional indexing support for the decision models. 3.1 Progressive Model and Data Representation
Execution of the model progressively allows incremental generation of model predictions. This will enable the execution of the more complete version of the model on those regions that have been predicted to be high risk, thus resulting in more accurate predictions for those regions with high interests sooner.
Progressive models usually involve the generation of increasingly coarse representations of the same model. In the linear model case, the risk model for the disease at location (x,y) and time t is
R (x,y,t) = a1X1(x,y,t) + a2X2(x,y,t)+
a3X3(x,y,t) + a4R (x, y, t-1)
If |a1,a2| >> |a3, a4| then, a coarser representation of the
model for Risk (x,y,t) will be
R*(x,y,t) ~ a1X1(x,y,t) + a2X2(x,y,t)
Consequently, R(x,y,t) and R*(x,y,t) represent two levels of progressive models.
In general, the generation of progressively coarser representation of a model can be accomplished by analyzing the relative contribution of each parameter to the overall model. This is related to query planning
Model Validation Feature Discovery MODEL HYPOTHESIS Model Revision Apply to more data Revise control points Improve the observability & controllability of the model Generalalize the model through learning and relevance feedback Example: soil temp can be used to predict grasshopper
Example: clubroot disease is localized
Figure 5. Workflow for utilizing model-based information retrieval.
issues in query optimization for object-relational databases. However, query planning usually rearranges the execution order so that operations resulting in maximal filtering will be executed earlier. In contrast, progressive model generation will select those operations that are most relevant to the final results to be executed first.
A complementary dimension that further enhances the incremental model execution is the use of progressive data representations. Two orthogonal dimensions exist for generating progressive data representations. Multi-resolution representations, such as wavelets can be used to provide rough approximations of information at low resolutions (low data volumes), with more detailed views at higher resolutions [1-3]. In contrast, multiple abstraction level representations rely on the fact that raw information can be processed into alternate formulations such as features (texture, color, shape, etc.) and semantics that require lower data volumes at the expense of fidelity. For example, contours can be computed from a data array, allowing for very rapid identification of areas with low or high parameter values, but with a loss of accuracy.
Previously, we have shown in [13] that a 30-times speedup can be achieved through applying progressive classification on progressively represented data. This type of classification of satellite images can be viewed as a special case of applying Bayesian network. We have also shown in [12] that a 4-8 times speedup can be accomplished through applying feature extraction progressively on progressively represented data. By applying progressive model execution on progressively represented data, a substantial speedup compared to using either progressive models or progressive data representation can usually be achieved.
3.2 High-Dimensional Model-Based Indexing Support Most of the high-dimensional indexing techniques such as R*-tree are optimized for spatial range queries. These techniques have also been utilized for processing similarity-based queries by pruning the search space through range queries [14]. However these techniques are sub-optimal for model-based queries, as these indices do not indicate where to find data points that will maximize the model.
An indexing technique, Onion, based on convex hull was proposed in [11] to address the issue of locating tuples that optimize (either maximize or minimize) a linear model. Experimental results have shown, with three-parameter Gaussian distributed data sets, a speed-up of 13,000 fold is achieved for retrieving the top-one choice while a speed-up of 1,400 fold is achieved for retrieving the top-ten choices, both measured against sequential scan of the unindexed data set.
For finite state and Bayesian-network-based models, indexing techniques may not be suitable. A dynamic programming based search space pruning technique, SPROC (Sequential Processing of Fuzzy Cartesian Queries) was proposed in [15] to reduce the computational complexity from O(LM ) to O(MKL2), where L is the size of the database , M is the number of rules, and K is the number of retrievals. This complexity is further reduced to O(ML log L + sqrt(LK) + K2log K) in [16].
4. Model Performance
4.1 Model accuracy
The model accuracy for predicting the risk is captured by two types of errors made at each location: (1) High risks regions which are considered to be low risk (misses), (2) Low risks regions which are considered to be high risk (false alarms). These two types of errors may carry different implications, and thus tradeoffs can be made for minimizing one type of the errors at the expense of the other, or for minimizing the combined errors. We assumed that the risk model is used to predict the number of occurrences of an event, O(x,y). In the formulation below, low risk is associated with zero occurrence of an event, while high risk is associated with more than zero occurrence of this event. The cost associated with an error at a particular location, C(x,y), is defined as
C(x,y) = cmPm(x,y)P[O(x,y)=0] +
cfPf(x,y)P[O(x,y)>0]
where cmand cf are the cost of making misses and false
alarms, respectively. The probability of making the miss error, Pm(x,y), is defined as
Pm(x,y) = Prob[ R(x,y) > T | O(x,y) = 0 ]
where R(x,y) is the risk predicted by the model outlined in the previous sections, while T is the decision threshold for high risk. Similarly, the probability of making the false alarm error, is defined as
Pf(x,y)=Prob[ R(x,y) < T | O(x,y) > 0 ]
The overall model performance, CT, for the entire region
is defined as
CT=ÿþÿþw(x,y)C(x,y)
The weight at each location w(x,y) is determined by the relative importance of the risk at that location, such as the population of the location. These factors are not captured by C(x,y).
Another measure of the model accuracy is related to the usage of the model prediction. In many applications, the objective is to utilize the model for decision support in order to identify locations with the highest risk, as described in the previous section. Consequently, the measure of accuracy for the top-K retrieval can be defined in terms of precision and recall. The precision is defined
as the percentage of retrieved results that are correct, while the recall is defined as the percentage of correct results that are retrieved. The correct results are defined as those locations within a region where O(x,y) > 0. Since the risk model is used to predict the occurrence of events, the top-K retrieval is really based on the ordering of R(x,y).
4.2 Model Efficiency
The efficiency of the model-based information retrieval is related to both the complexity of the model as well as the size of the data.
Using the environmental epidemiology as an example, we are only interested in retrieving K locations that have the highest risk to a certain disease. Assuming that a linear model is used in assessing the risk, it is necessary to process the linear model on all of the data in order to produce the top K choices that have either the maximum or minimum values when computing the model. Consequently, it would require O(nN) computations, where n is the computational complexity of the linear model and is directly related to the number of additions and multiplications used in computing the model value of each location, and N is the total number of locations that are under considerations. Additional computations are required in order to sort the results and produce the top K output. If this model only needs to be used once, there is probably no alternative other than compute every location before generating the maximum and/or minimum locations.
In contrast, progressive model execution allows the reduction of the total complexity of the model from O(nN) to O(nN/(pmpd)) where pm and pd are the effective
complexity reduction ratio due to progressive execution of the models and data representations, respectively.
5. Summary
In this paper, we describe a new framework for information retrieval, in which the retrieval is based on a model instead of a simple template as the search target. Three types of models – linear model, finite state model, and Bayesian networked-based model are discussed. Traditional model-based processing techniques usually require the processing of each and every data points by the complete model. The new framework, in contrast, will execute the model progressively on progressively represented data, with the help from model-specific indices.
By using this framework, we have demonstrated that several order-of-magnitude speedups can be achieved for a number of scientific and business applications such as
environmental epidemilogy, oil/gas exploration, and precision agriculture/forestry.
6. Acknowledgement
This work was funded in part by IBM/NASA CAN NCC5-305. The authors also appreciate the discussions with Prof. Gregory Glass of Johns Hopkins Univ., as well as Drs. Peter Tilke and Ian Bryant from Schlumberger-Doll Research.
7. References
[1] J. R. Smith and S.-F. Chang. Joint adaptive space and frequency graph basis selection. In IEEE Proc. Int. Conf. Image Processing (ICIP), Santa Barbara, CA, October 1997.
[2] J. R. Smith and C.-S. Li. An adaptive view element framework for multi-dimensional data management. In ACM Int Conf on Information and Knowledge Management (CIKM), Kansas City, MO, November 1999.
[3] J. R. Smith, V. Castelli, and C.-S. Li. Adaptive storage and retrieval of large compressed images. In IS&T/SPIE Symposium on Electronic Imaging: Science and Technology - Storage & Retrieval for Image and Video Databases VII, San Jose, CA, January 1999. [4] M. Flickner, H. Sawhney, W. Niblack, J. Ashley, Q. Huang, B. Dom, M. Gorkani, J.Hafner, D. Lee, D. Petkovic, D. Steele, and P. Yanker, ``Query by image and video content: The {QBIC} system,'' IEEE Computer, vol. 28, no. 9, pp. 23 -- 32, September 1995. [5] J. R. Smith and S.-F. Chang, ``Visualseek: A fully automated content-based image query system,'' in Proc. International Conference on Image Processing, 1996. [6] J. R. Bach, C. Fuller, A. Gupta, A. Hampapur, B. Horowitz, R. Humphrey, R. C. Jain, and C. Shu, ``Virage: image search engine: an open framework for image management,'' in Symposium on Electronic Imaging: Science and Technology-Storage & Retrieval for Image and Video Databases {IV}. IS&T/SPIE, 1996, vol. 2670, pp. 76 -- 87.
[7] B. S. Manjunath and W. Y. Ma, "Texture features for browsing and retrieval of image data", IEEE Trans. Pattern Analysis Machine Intell. Special Issue on Digital Libraries", vol.18, no. 8, 1996.
[8] J. R. Smith and S.-F. Chang, ``SaFe: A general framework for integrated spatial and feature image search,’’ IEEE first workshop on Multimedia Signal Processing, pp. 301-306, 1997.
[9] C. Carson, S. Belongie, H. Greenspan, and J. Malik, ``Region based image querying,’’ IEEE Proc. CBAIVL’97, pp. 42-49, 1997.
[10] D. A. Forsyth, and M. M. Fleck, ``Body Plans,’’ IEEE Proc. CVPR, pp.678-683, 1997.
[11] Y.-C. Chang, L. D. Bergman, V. Castelli, C.-S. Li, M.-L. Lo, and J. R. Smith, ``The Onion Technique: Indexing for Linear Optimization Queries,’’ accepted for ACM Proc. SIGMOD , 2000.
[12] C.-S. Li and M.-S. Chen, ``Progressive Texture Matching for Earth Observing Satellite Image Database,'' SPIE Multimedia Storage and Archiving Systems, Boston, Nov. 1996.
[13] V. Castelli, C.-S. Li, J. J. Turek, and I. Kontoyiannis, ``Progressive Classification in the Compressed Domain for Large EOS Satellite Databases,'' IEEE ICASSP'96 , April, 1996.
[14] A. Thomasian, V. Castelli, and C.-S. Li, “Clustering and Singular Value Decomposition for Approximate Indexing in High Dimensional Spaces,” Conference on Information and Knowledge Management (CIKM’98), Nov., 1998.
[15] C.-S. Li, J. R. Smith, L. Bergman and V. Castelli, "SPROC: Sequential Processing for Content-Based Retrieval of Composite Objects," SPIE Photonics West'98, San Jose, Jan. 1998.
[16] C.-S. Li, Y.-C. Chang, J. R. Smith, and L. D. Bergman, ``Framework for Efficient Processing of Content-Based Fuzzy Cartesian Queries,'' SPIE Storage and Retrieval System, Jan. 2000.