病人報告的醫療品質
計畫類別: 個別型計畫 計畫編號: NSC92-2416-H-002-044- 執行期間: 92 年 08 月 01 日至 93 年 07 月 31 日 執行單位: 國立臺灣大學公共衛生學院衛生政策與管理研究所 計畫主持人: 鄭守夏 計畫參與人員: 魏玉容 黃雅琳 報告類型: 精簡報告 處理方式: 本計畫可公開查詢中 華 民 國 94 年 11 月 10 日
ABSTRACT
Quality of care rather than price is the main concern in healthcare. However,doesn’tprice
matter at all? To investigate what factors surrounding quality and cost influence whether
patients perceive the services as expensive and recommend a hospital to other patients, we
analyzed data from a national survey of patients in Taiwan in 2002. A total of 6,725 subjects
returned their questionnaires. Results from logistic regression models showed that (1)
patient’s perceived expensiveness was determined simultaneously with perceived quality and
the out-of-pocket price of that care; (2)patient’sperceived hospital quality appeared to be
the most important determinants for one’srecommendation of a hospital; and (3) while the
out-of-pocket price did not affect a patient’s recommendation, the perceived expensiveness
of the services did. The perceived value rather than the price itself is the essence of quality
competition in Taiwan’s healthcare market.
INTRODUCTION
Non-price competition in health care market
Price competition is less common in the health care market than in other industries. Health
care is classified as a non-perfect competitive market due to uncertainty and information
asymmetry1, and it is also considered an industry which markets reputation2, 3. Therefore,
competition for quality is more often observed in the health care market than price
competition4-6. A review of the literature from the 1970s and 1980s revealed that a “medical arms race”takes place in the United States health care market; hospitals compete
for physicians and their patients by providing most up-to-date medical equipment and
excessive staffing7-10. Quality competition has led to higher healthcare costs as well as
higher price for insurance coverage.
Although quality concern dominates in healthcare, price may still play a role in the
marketplace. Reports showed that after the implementation of the pro-competition and cost
containment policies in California, the rate of increase in cost per discharge in hospitals in
highly competitive markets was lower than the rate of increase in hospitals in
low-competition markets11, 12. However, a recent study finds non-price competition to be
becoming increasingly more common and hospitals to be competing to provide attractive
individual physicians and the patients they serve13. “Does price matter at all?”We wonder.
According to consumer choice theory, when the quality of goods or services meets a
consumer’sexpectation and when theconsumerconsiders the price to be worth the services,
then consumer satisfaction emerges and consumption of those services continues14, 15.
However, information concerning quality and price of health care is limited. Patient
selection of health care providers has been found to depend greatly on the recommendation
of family members and friends16, 17, and a patient’s experience and rating of health care
quality significantly influences whether that patient will recommend a hospital18. Patients’
perceived value of the services and their recommendation of the providers are key features of
the competition in health care market.
Taiwan’s health care system
The health care service market has always been competitive in Taiwan. In 2002, there were
610 hospitals and 17,618 clinics for western medicine, Chinese medicine and dentistry
serving about 23 million people in Taiwan. The National Health Insurance (NHI) program,
now covers over 96% of all citizens in Taiwan and has contracts with 95% of the nation’s
hospitals, was implemented in 1995. When it was implemented, the competition became
hospital scale is obvious19. Detailed descriptions of the implementation and influence of
the nationwide health insurance program are available elsewhere20-22.
A hospital accreditation system has been implemented since 1978 and classifies hospitals
into 3 categories in descending order: medical center, regional hospital, and district
hospital23. As of 2002, of the nation’s 610 hospitals, 23 were medical centers, 71 regional
hospitals, 41 district teaching hospitals, 344 district hospitals and 131 non-accredited
hospitals. Hospitals without teaching accreditation were mostly small-sized private owned
hospitals with less than 100 beds.
Despite universal coverage under Taiwan’s NHI system, price variation still exists. Since
the Bureau of the National Health Insurance (BNHI) is the only buyer of health care services,
it sets payment schemes for various kinds of services for all contracted providers. NHI
beneficiaries are required to make a co-payment of 10% of their hospitalization expenses
with an upper limit of NT$ 24,000 (US$ 700) per admission, while patients with a
low-income certificate are exempted from the co-payment requirement. Hospitals can also
charge patients directly for services or medical materials not covered by NHI. For example,
there is an extra fee for a stay in single- or double-bed wards, since NHI will only pay for
amounts they paid for the co-payment requirement or the extra fee charged.
Without a formal referral requirement or a family doctor system, people in Taiwan are free to
choose any of the NHI-contracted hospitals they prefer to receive ambulatory or inpatient
services. Virtually the only available information a prospective patient or their family
members have to base their choice of on is a hospital’sreputation (i.e. what hospitals people
are recommending) and bed size17. This study investigates the out-of-pocket hospital
charges and patient’s perceived quality of care and their influence on hospital choice.
MATERIALS AND METHODS
Sources of subjects
A nation-wide survey of discharged patients was conducted to gather information on
patients’rating ofhospitalperformance and on the items or services used and out-of-pocket
charges. Since the diagnostic and treatment procedures as well the medical expenses might
vary significantly among different diseases, we surveyed only patients with certain
diagnoses/procedures. After consulting medical professionals and considering the
prevalence of the diagnoses for case collection, we chose to survey discharged patients who
had one of 4 medical diagnoses (stroke, asthma, pneumonia and diabetes mellitus) or one of
administrative efficiency this survey only included patients discharged from hospitals
designated as district teaching hospitals or above, because the large amount of small-scaled
hospitals provides only a small portion (less than 10%) of inpatient services nationwide.
Sample selection was conducted with the help of the BNHI. All of the NHI-contracted
hospitals file monthly claims to one of the six regional NHI branches. The branch offices
listed patients with the above-mentioned major diagnoses discharged from hospitals
accredited as district teaching hospital or higher during January 1, 2002 and March 31, 2002.
These lists made up our potential candidates. Patients who expired during the stay in
hospital and patients with more than one diagnosis of the 6 disease categories were excluded.
A systematic random sampling was conducted to select 50% of the listed patients from each
hospital per month with an upper limit of 15 patients per diagnosis. The questionnaires
were then mailed to the study patients between 2 to 3 months after discharge. At least 3
telephone calls were made by the employees in the six BNHI branches to encourage
participants who had not returned their questionnaires to do so.
Questionnaire design
A structured questionnaire was designed to gather information on the price and perceived
ward, length of stay, and the experience medical and nursing care. The questionnaire was
first standardized via a small-scaled pilot test on 60 discharged patients. Sampled patients
or their primary family caregivers were asked to answer the questionnaire. The questionnaire
began with questions to identify the patient’s diagnosis and who answered the questionnaire.
Questions about quality of hospital care usually cover many different dimensions24-26.
After reviewing measurement tools developed by previous researchers and considering our
previous experience18, we selected 10 items to measure two major dimensions of quality of
care: clinical competence and the inter-personal skills of the medical staff. Clinical
competence was covered with five questions: hospital equipment, doctor’s competence,
nurse’s competence, explanation of treatment, and outcome/recovery status. Questions
about inter-personal skills were also covered with five questions: doctor’sattitude,doctor’s
respect, nurse’s attitude, nurse’s response and nurse’s communication.
Each of the 10 questions were designed to have 5-level response categories such as
“definitely enough”to “obviously insufficient”,“very good”to “very poor”,or“much better
than expected”to “much worsethan expected.” Scores ranging from 5 to 1 were assigned
to the five response categories. The total possible score for each dimension (clinical
better-perceived quality of hospital performance. Missing values in each of the 10 items
(from 0.5% to 5.1% of the total number of people surveyed in each category) were replaced
by the mean scores for each of the diagnoses in order to maximize the amount of useful
information. Patients with different conditions were analyzed separately as suggested by
Hargraves et al. to account for possible clinical variations27.
There was one question about whether a patient would recommend the hospital: “Ifsomeone
asksyou aboutthathospital,would you recommend it?” The 5 response categories for this
question were“strongly recommend”to “definitely notrecommend”. In a logistic
regression model, the first two responses (strongly recommend and recommend) were
defined as one group and the remaining responses as the other. In this study, we assumed
that hospitals with better perceived quality or more reasonable price was more likely to be
recommended by their patients.
Statistical analysis
The means and standard deviations of continuous variables are presented in the description
section; some of these variables are presented in ordered categories as needed. Variables
measuring out-of-pocket payment, family income, length of stay, interpersonal and technical
points. A multiple logistic regression model was used to examine the effects of patient’s
rating of quality and out-of-pocket payment on their perceived expensiveness. A second
logistic regression model was constructed to investigate the effect of perceived
expensiveness, out-of-pocket charge and quality rating on patient’srecommendation of
hospital. Odds ratios and 95% confidence intervals as well as the significance levels based
on chi-square tests were presented to compare the magnitudes of the effects. The analyses
were performed using SAS system Version 8.0.
RESULTS
Characteristics of the sample
A total of 17,798 questionnaires were mailed out. After deleting those that had been sent to
the wrong address and those mailed to patients who had died since discharge, we ended up
with 14,408 valid questionnaires. Returned to us were 6,725 completed questionnaires,
giving us an overall response rate of 46.7%. Patients who had undergone the two surgical
procedures possessed characteristics different from those with the four medical conditions:
they had significantly shorter hospital stays and higher perceived quality of care due to
relatively “curable”conditions, and the Cesarean Section patients were females of a narrow
case-payment scheme rather than a common fee-for-service method, which might influence
hospital’s charging behavior significantly. In order to simplify the analysis of price,
perceived expensiveness and recommendation, this study only included patients diagnosed
with one of the four medical conditions (n = 4,492).
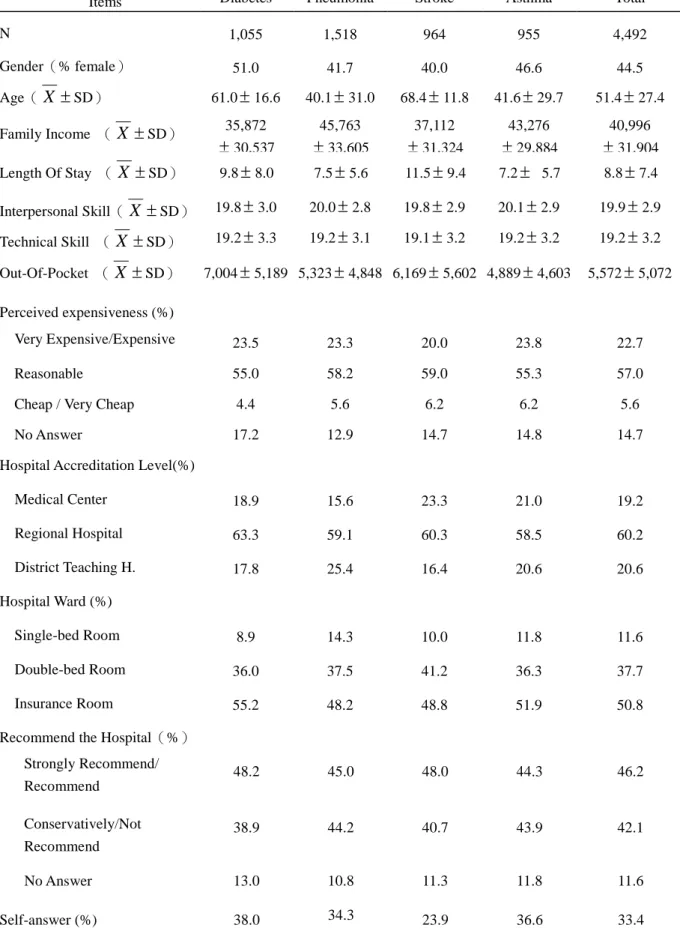
Basic survey information about the respondents is shown in Table 1. Males dominated
three of the four disease categories except for diabetes. Stroke patients were the oldest
group with a mean age of 68 years old. Patients with pneumonia and asthma were much
younger and had mean ages around 41 years old. The overall family income was about
41,000 NT dollars per month. The average length of stay was 8.8 days, with stroke patients
having the longest (11.5 days). Patients with these four medical conditions did not vary
notably in their perception of the hospital’s quality of care, technical capabilities and
interpersonal skills.
Patients were discharged from medical centers, regional hospitals and district teaching
hospitals with the ratios of about 2:6:2, respectively. The distribution of medical diagnoses
of the patients being discharged from these hospitals varies to some extent from hospital to
hospital. Approximately 50.8% of the patients stayed in insurance-paid wards, throughout
11.6% of the patients stayed in single-bed rooms and 37.7% of the patients stayed in
double-bed rooms and were charged various extra ward fees by the individual hospitals.
The overall average out-of-pocket charge was about 5,500 NT dollars, with diabetic patients
paying the highest (about 7,000 NT dollars). 22.7% of the patients felt that the
out-of-pocket charges were very expensive or expensive while 55.7% of the respondents
reported that the charges were reasonable. A certain portion of the patients (14.7%) did not
answer the question concerning perceived expensiveness; they tended to be older and with
lower family income. About 46.2% of the patients reported that they would (strongly)
recommend the hospital, while 11.6% of the respondents did not answer the recommendation
question. Only 33.4% of the patients answered the questionnaires by themselves.
Out-of-pocket price, perceived expensiveness and recommendation
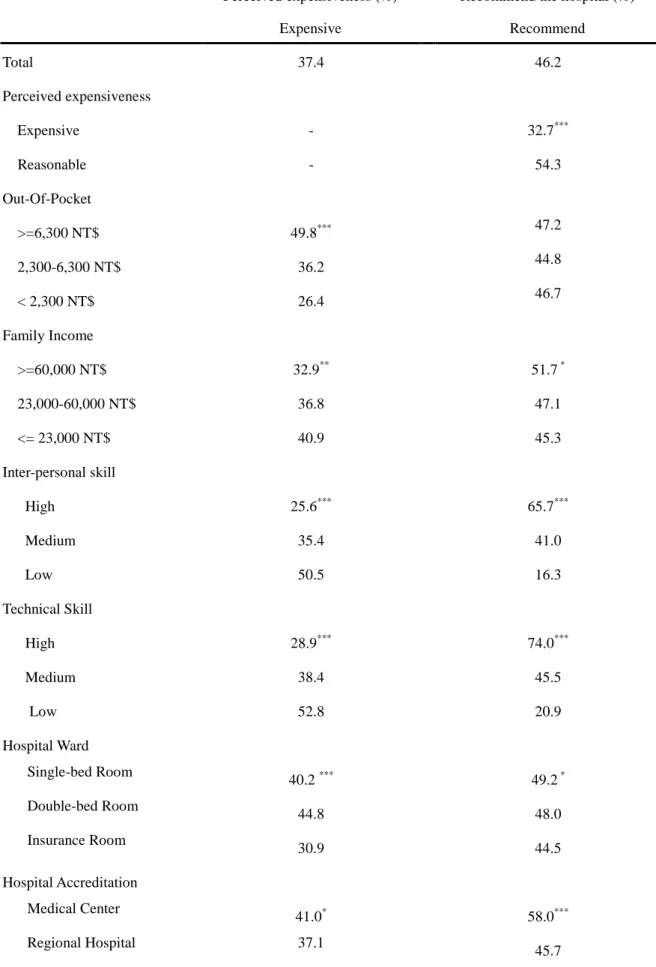
Simpleassociationsofpatient’sperceived expensiveness,recommendation ofthehospital
and related factors are shown in Table 2. 62.6% of the respondents considered the
out-of-pocket charges to be reasonable, cheap or very cheap; 37.4% considered them
expensive. People with out-of-pocket charges higher than 6,300 NT dollars or with family
incomes less than 23,000 NT dollars per month were more likely to report that the charges
quality, i.e. interpersonal or technical skill ratings, were less likely to report that the charges
were expensive. Patients who had been discharged from a public hospital or had been
staying in an insurance ward were more likely to report that the charges were reasonable
(67.0% and 69.1%, respectively).
Thesecond partofTable2 showstheassociation between patient’srecommendation ofthe
hospital and related factors. On average, 46.2% of all the respondents reported that they
would recommend the hospital they chose. Patients who reported the charges as expensive
were less likely to recommend their hospitals than those reported the charges as reasonable
(32.7% vs. 54.3%). The out-of-pocket price, on the other hand, was not associated with the
likelihood of recommending a hospital. Patients’perceived quality ofhospitalcarewas
significantly associated with their recommendations of the hospital. Hospitals with higher
accreditation levels were more likely to be recommended: medical centers (58.0%),
regional hospitals (45.7%) and district teaching hospitals (36.8%). Hospital ownership was
also related to patient’srecommendation,with privately owned hospitals being the least
recommended (39.0%).
Results of the logistic regression models
out-of-pocketchargeand otherrelated factorson patient’sperceived expensivenessand their
recommendation of the hospital, as seen in Table 3. The amount of out-of-pocket charges
appeared to be a positive predictor for perceived expensiveness (OR=1.07), while technical
capability and interpersonal skill ratings tended to be negative determinants of perceived
expensiveness (ORs=0.87 and 0.95). Other factors such as family income, disease category,
ward type, hospital accreditation level and its ownership were also significantly associated
with perceived expensiveness.
The second part of Table 3 shows theresultsofpatient’srecommendation ofthehospital.
Perceived expensivenesstended to beasignificantpredictorofpatient’srecommendation of
the hospital (OR=0.56), while the amount of out-of-pocket price showed no effect at all
(OR= 1.00 [0.98, 1.02]). We also examined the possibility of collinearity by removing the
“perceived expensiveness”from theregression model,theout-of-pocket price still showed
no significant effect (OR = 0.99 [0.98, 1.01], and their correlation coefficient was 0.20,
P<0.001). On the other hand, interpersonal and technical ratings, representing perceived
quality of care, appeared to be influential determinants of a patient’srecommendation ofthe
hospital, with OR= 1.17 [1.13-1.22] and 1.32 [1.27-1.37], respectively.
Results from this study show that perceived quality of hospital care remains the key feature
in the competitive healthcare market under Taiwan’s universal health insurance scheme, and
a patient’s perception of the quality of that care appears to be the most important determinant
for his or her recommendation of the hospital. The patients’rating ofthetechnical
capability and performance of the hospital tended to be more influential than the
interpersonal and communication skill ratings, possibly indicating the relative importance of
the two dimensions in their perspective. This finding explains the expansion of hospital
scale in Taiwan which is similar to the “medical arms race”phenaminum in the United States.
Furthermore, under the National Health Insurance in Taiwan people are free to choose
among providers, former patients’recommendations of a hospital is one of the key sources
of information that consumers use to select among hospitals. The association of perceived
quality and recommendation echoes previous reports concerning the quality competition in
the health care market.5, 18
Given that quality is the main concern of consumers in the health care market, does price
matter at all? This study examined the price effect on recommendation in two ways: an
absolute value of the out-of-pocket price and a perceived expensiveness of the price versus
the services provided in the hospital. Our results showed that out-of-pocket amount was a
quality of care appeared to be an important determinant for perceived expensiveness as well.
Patients who perceived good quality of care were more likely to report that the price to be
reasonable. This finding shows that perceived expensiveness is determined simultaneously
with perceived quality of care and the out-of-pocket price of that care, which forms the
perceived value of the services. A patient is more likely to recommend a hospital while
he/she perceives a higher value, i.e. high rating of quality and/or low cost, which concurs
with the marketing theories.28
Interestingly, perceived expensiveness was negatively associated with a patient’s
recommendation of the hospital, but out-of-pocket price did not affect the recommendation.
One of the possible explanations was that the out-of-pocket cost, with an average of $5572
NTD or$170 USD,wasnot“very expensive”in Taiwan (with aGDP of13500 USD in
2004).29However, the finding also reveals that the absolute amount of price may affect patient’srecommendation ofthehospitalonlywhen a patient perceives the hospital as
expensive, meaning that he or she does not believe the service is worth the price. In terms of
methodological thinking, we consider that perceived expensiveness is the intervening
variable between paid price and recommendation. Given a certain level of perceived quality,
low out-of-pocket price leads to non-expensive feeling and high paid price result in
recommendation of a hospital. Thus a hospital, such as a large-scaled medical center, can
provides quality care and charge higher prices, may also enjoy popular recommendation by
patients.
Knowing that healthcare service is not a homogeneous product, we believe that perceived
value rather than the price is the essence of quality competition in the healthcare market.
However, given its unique value, the validity of having patients evaluate medical
performance as a quality measures needs to be further investigated. This study included
patients with only certain medical diagnoses; the sample consisted of fewer elderly and
low-income subjects. Analysis on a sample with more comprehensive case-mix or under
ACKNOWLEDGEMENTS
The study was supported by grants from the National Science Council (NSC92-2416-H-002-044) and the National Health Research Institutes
(NHRI-EX92-8801PP and NHRI-EX93-9310PI) in Taiwan. The authors are grateful to the staffs in Taiwan’Bureau of National Health Insurance and its six branches who helped in handling the sample list, mailing questionnaires and making follow-ups phone calls.
REFERENCES
1. Arrow K. Uncertainty and the welfare economics of medical care. Am Econ Rev.
1963;53:941-973.
2. Hung CS. On Monopoly Power in a Differentiated Product Industry. Rev Ind Organ.
August 1994;9:425-433.
3. Pauly MV. Is medical care different? Old questions, new answers. Health Polit Policy
Law. 1988;13:227-237.
4. Robinson JC. Hospital quality competition and the economics of imperfect
information. Milbank Q. 1988;66:465-481.
5. Chirikos TN. Quality competition in local hospital markets: some econometric
evidence from the period 1982-1988. Soc Sci Med. 1992;34:1011-1021.
6. Hickson GB, Stewart DW, Altemeier WA, Perrin JM. First step in obtaining child
health care: selecting a physician. Pediatrics. 1988;81:333-338.
7. Robinson JC, Luft HS. Competition and the cost of hospital care, 1972 to 1982.
JAMA. 1987;257:3241-3245.
8. Luft HS, Robinson JC, Garnick DW, Maerki SC, McPhee SJ. The role of specialized
clinical services in competition among hospitals. Inquiry. 1986;23:83-94.
9. Luft HS, Garnick DW, Mark DH, et al. Does quality influence choice of hospital?
10. Burroughs TE, Davies AR, Cira JC, Dunagan WC. Understanding patient willingness
to recommend and return: a strategy for prioritizing improvement opportunities. Jt
Comm J Qua Improv. 1999;25:271-287.
11. Melnick GA, Zwanziger J. Hospital behavior under competition and
cost-containment policies. The California experience, 1980 to 1985. JAMA.
1988;260:2669-2675.
12. Keeler EB, Melnick GA, Zwanziger J. The changing effects of competition on
non-profit and for-profit hospital pricing behavior. J Health Econ. 1999;18:69-86.
13. Devers KJ, Brewster LR, Casalino LP. Changes in hospital competitive strategy: a
new medical arms race? Health Serv Res. 2003;38:447-469.
14. Tam LM. The effect of service quality, perceived value and consumer satisfaction on
behavioral intensions. Journal of Hospitality & Leisure Marketing. 2000;6:31-43.
15. Neelamiegham R, Jain D. Consumer choice process for experience goods: An
econometric model and analysis. J Mark Res. 1999;36:373-386.
16. Edgman-Levitan S, Cleary PD. What information do consumers want and need?
Health Aff. 1996;15:42-56.
17. Hsieh HS, Cheng SH, Lew-Ting CY. Demand for provider selection information of
inpatients: Findings from a preliminary study. Chinese Journal of Public Health (in
18. Cheng SH, Yang MC, Chiang TL. Patient satisfaction with and recommendation of a
hospital: effects of interpersonal and technical aspects of hospital care. Int J Qual
Health Care. 2003;15:345-355.
19. Department of Health. Health and Vital Statistics, I: General Health Statistic, 2001:
Republic of China. Taipei, Taiwan: Department of Health, the Executive Yuan;
September 2001. 110-114, 125.
20. Chiang TL. Taiwan's 1995 health care reform. Health Policy. 1997;39:225-239.
21. Cheng SH, Chiang TL. The effect of universal health insurance on health care
utilization in Taiwan. Results from a natural experiment. JAMA. 1997;278:89-93.
22. Cheng TM. Taiwan's new national health insurance program: Genesis and experience
so far. Health Aff. 2003;22:61-76.
23. Huang P, Hsu YH, Tan KY, Hsueh YS. Can European external peer review
techniques be introduced and adopted into Taiwan's hospital accreditation System?
Int J Qual Health Care. 2000;12:251-254.
24. Donabedian A. The quality of care: How can it be assessed. JAMA.
1988;260:1743-1748.
25. Rubin HR. Can patients evaluate the quality of hospital care? Med Care Rev.
1990;47:267-326.
perspectives. JAMA. 1997; 278:1608-1612.
27. Hargraves JL, Wilson IB, Zaslavsky A, et al. Adjusting for patient characteristics
when analyzing reports from patients about hospital care. Med Care.
2001;39:635-641.
28. Zeithaml VA. Consumer perceptions of price, quality, and value: a means-end model
and synthesis of evidence. J Mark. 1988; 52:2-22.
29. Directorate-General of Budget Accounting and Statistics. National Statistics: Key
Economics and Social Indicators. Taipei, Taiwan: Directorate-General of Budget,
Table 1: Basic information of discharged patients by the 4 medical conditions
Items Diabetes Pneumonia Stroke Asthma Total
N 1,055 1,518 964 955 4,492 Gender(% female) 51.0 41.7 40.0 46.6 44.5 Age(X SD) 61.016.6 40.131.0 68.411.8 41.629.7 51.427.4 Family Income (X SD) 35,872 30,537 45,763 33,605 37,112 31,324 43,276 29,884 40,996 31,904 Length Of Stay (X SD) 9.88.0 7.55.6 11.59.4 7.25.7 8.87.4 Interpersonal Skill(X SD) 19.83.0 20.02.8 19.82.9 20.12.9 19.92.9 Technical Skill (X SD) 19.23.3 19.23.1 19.13.2 19.23.2 19.23.2 Out-Of-Pocket (X SD) 7,0045,189 5,3234,848 6,1695,602 4,8894,603 5,5725,072 Perceived expensiveness (%) Very Expensive/Expensive 23.5 23.3 20.0 23.8 22.7 Reasonable 55.0 58.2 59.0 55.3 57.0
Cheap / Very Cheap 4.4 5.6 6.2 6.2 5.6
No Answer 17.2 12.9 14.7 14.8 14.7
Hospital Accreditation Level(%)
Medical Center 18.9 15.6 23.3 21.0 19.2 Regional Hospital 63.3 59.1 60.3 58.5 60.2 District Teaching H. 17.8 25.4 16.4 20.6 20.6 Hospital Ward (%) Single-bed Room 8.9 14.3 10.0 11.8 11.6 Double-bed Room 36.0 37.5 41.2 36.3 37.7 Insurance Room 55.2 48.2 48.8 51.9 50.8
Recommend the Hospital(%) Strongly Recommend/ Recommend 48.2 45.0 48.0 44.3 46.2 Conservatively/Not Recommend 38.9 44.2 40.7 43.9 42.1 No Answer 13.0 10.8 11.3 11.8 11.6 Self-answer (%) 38.0 34.3 23.9 36.6 33.4
Table 2:Patient’sperceived expensiveness and recommendation by associated factors
Perceived expensiveness (%) Recommend the hospital (%)
Expensive Recommend Total 37.4 46.2 Perceived expensiveness Expensive - 32.7*** Reasonable - 54.3 Out-Of-Pocket >=6,300 NT$ 49.8*** 47.2 2,300-6,300 NT$ 36.2 44.8 < 2,300 NT$ 26.4 46.7 Family Income >=60,000 NT$ 32.9** 51.7* 23,000-60,000 NT$ 36.8 47.1 <= 23,000 NT$ 40.9 45.3 Inter-personal skill High 25.6*** 65.7*** Medium 35.4 41.0 Low 50.5 16.3 Technical Skill High 28.9*** 74.0*** Medium 38.4 45.5 Low 52.8 20.9 Hospital Ward Single-bed Room 40.2*** 49.2* Double-bed Room 44.8 48.0 Insurance Room 30.9 44.5 Hospital Accreditation Medical Center 41.0* 58.0*** Regional Hospital 37.1 45.7
District Teaching Hospital 35.2 36.8 Hospital Ownership Public Hospital 33.0 48.8 Non-profit Hospital 39.0 47.7 Private Hospital 41.5 39.0
*P<0.05, ** P<0.01, *** P<0.001 by Chi-square tests for the distribution of perceived expensiveness and recommending the hospital among the categories of individual associated variables.
Table3: Determinants of patient perceived expensiveness and recommendation of a hospital from logistic regression models1(N=3916)
Perceived expensiveness Recommendation
Variables
Odds Ratio 95 % C. I. Odds Ratio 95 % C.I.
Perceived expensiveness (ref: Reasonable)
Expensive - - - - 0.56*** 0.48 –0.67
Out-Of-Pocket 1.07*** 1.05 –1.09 1.00 0.98 –1.02
Inter-personal Skill2 0.95** 0.92 –0.99 1.17*** 1.13-1.22
Technical Skills2 0.87*** 0.84 –0.90 1.32*** 1.27-1.37
Hospital Accreditation Level (ref: D. T. H.)
Medical Center 1.53*** 1.20 - 1.96 1.93*** 1.49 –2.50
Regional H. 1.12 0.92 –1.35 1.41** 1.16 - 1.72
Hospital Ownership (ref: Private H.)
Public H. 0.61*** 0.50 –0.76 1.15 0.92 –1.44
Non-profit H. 0.85 0.70 –1.05 1.06 0.85 –1.32
Age (ref:>=51 years old)
35 years old 1.07 0.86 –1.32 0.77* 0.61 –0.97
36-50 years old 1.04 0.86 –1.26 0.87 0.71 –1.07
Family Income (ref:23000 NT $)
≧60001 NT $ 0.68** 0.54 –0.87 0.90 0.70 –1.16
60000-23001 NT $ 0.83* 0.69 –0.99 0.91 0.75 –1.09
Hospital Ward (ref: Insurance R.)
Single-bed R. 1.34* 1.05 –1.71 1.23 0.95-1.59
Double-bed R. 1.61*** 1.37 –1.89 1.09 0.92-1.30
Conditions (ref: Asthma)
Diabetes 0.99 0.81 –1.22 1.23 0.98 –1.54
Pneumonia 0.94 0.78 –1.14 1.05 0.86 –1.29
Stroke 0.67*** 0.54 –0.84 1.34 1.06 –1.69
Self-answer 1.14 0.97 –1.35 1.02 0.85 - 1.21
1
Results from logistic regression models presenting odds ratio and 95% confidence intervals for comparison. Dependent variables were 〝Perceived expensiveness=1, perceived reasonableness and no answer=0〞and 〝strongly recommend and recommend =1, recommend with reservation,
not recommend and no answer =0〞.
2
Missing values to the inter-personal or technical skills variables were replaced by sub-group mean values.
3