科技部補助專題研究計畫成果報告
期末報告
基於結構關聯分析之模糊資料型的財經時間數列相關程度
探討
計 畫 類 別 : 個別型計畫 計 畫 編 號 : NSC 102-2410-H-004-182- 執 行 期 間 : 102 年 08 月 01 日至 103 年 07 月 31 日 執 行 單 位 : 國立政治大學應用數學學系 計 畫 主 持 人 : 吳柏林 報 告 附 件 : 出席國際會議研究心得報告及發表論文 處 理 方 式 : 1.公開資訊:本計畫涉及專利或其他智慧財產權,2 年後可公開查詢 2.「本研究」是否已有嚴重損及公共利益之發現:否 3.「本報告」是否建議提供政府單位施政參考:否中 華 民 國 103 年 08 月 30 日
中 文 摘 要 : 本研究計畫首先探討關聯結構理論之技術工具,如關聯結構 對財金經濟資料聯合分配偏態的影響,關聯結構模型的估 計,關聯結構模型選擇等。接著探討關聯結構理論與投資組 合管理關聯,最佳模式選取策略與穩定參數之估計。並發展 出一套能對於財金經濟資料或資產價格聯合分配合理假設的 方法。最後以實證資料(數據及非數據)分析,提出模糊相關 係數的估算。並比較關連結構與模糊相關係數的優缺點,對 相關係數資產分配有更妥適的描述,如投資組合管理、風險 管理及衍生性金融商品訂價策略,以及提升財務分析的可靠 度。 中文關鍵詞: 關聯結構,投資組合管理,財金時間數列,模糊資料 英 文 摘 要 : This research proposal aims at investigating
structure dependence for financial/economic time series with emphasis on imprecise data such as fuzzy data. The current practice in, say, forecasting
economic phenomena from observed time series data, is based upon the methods of copulas and their
optimization techniques such as maximum entropy. This can be achieved when data are precise. However,
observed time series data in econometrics/finance are often coarse, i.e. of low quality, due to errors in measurements, missing data, sample selection,
imprecision in observations. We propose to
investigate the use of copula techniques for coarse data on this research project. And compare off even the structure and the advantages and disadvantages of the fuzzy correlation coefficient, the asset
allocation of the correlation coefficient is more properly described, such as portfolio management, risk management and financial derivatives pricing strategies, as well as to enhance the reliability of financial analysis. Application domains: Risk
management in financial econometrics, actuarial sciences, credit management decision.
英文關鍵詞: copulas, portfolio management, financial time series, fuzzy data
1 科技部補助專題研究計畫成果報告 (□期中進度報告/■期末報告) 基於結構關聯分析之模糊資料型的財經時間數列相關程度探討 計畫類別:■個別型計畫 □整合型計畫 計畫編號:MOST 102-2410-H-004 -182 - 執行期間:102 年 8 月 1 日至 103 年 7 月 31 日 執行機構及系所:國立政治大學應用數學系 計畫主持人:吳柏林 共同主持人: 計畫參與人員:吳文智,楊志清 本計畫除繳交成果報告外,另含下列出國報告,共 _1__ 份: ■出席國際學術會議心得報告 期末報告處理方式: 1. 公開方式: □非列管計畫亦不具下列情形,立即公開查詢 ■涉及專利或其他智慧財產權,□一年■二年後可公開查詢 2.「本研究」是否已有嚴重損及公共利益之發現:■否 □是 3.「本報告」是否建議提供政府單位施政參考 □否 ■是, (請列舉提供之單位;本部不經 審議,依勾選逕予轉送) 中 華 民 國 103 年 8 月 25 日 附件一
計畫中文摘要 本研究計畫首先探討關聯結構理論之技術工具,如關聯結構對財金經濟資料聯合分配偏態的影 響,關聯結構模型的估計,關聯結構模型選擇等。接著探討關聯結構理論與投資組合管理關聯,最佳 模式選取策略與穩定參數之估計。並發展出一套能對於財金經濟資料或資產價格聯合分配合理假設的 方法。最後以實證資料(數據及非數據)分析,提出模糊相關係數的估算。並比較關連結構與模糊相關 係數的優缺點,對相關係數資產分配有更妥適的描述,如投資組合管理、風險管理及衍生性金融商品 訂價策略,以及提升財務分析的可靠度。 關鍵詞: 關聯結構,投資組合管理,財金時間數列,模糊資料。 計畫英文摘要
This research proposal aims at investigating structure dependence for financial/economic time series with emphasis on imprecise data such as fuzzy data. The current practice in, say, forecasting economic phenomena from observed time series data, is based upon the methods of copulas and their optimization techniques such as maximum entropy. This can be achieved when data are precise. However, observed time series data in econometrics/finance are often coarse, i.e. of low quality, due to errors in measurements, missing data, sample selection, imprecision in observations. We propose to investigate the use of copula techniques for coarse data on this research project. And compare off even the structure and the advantages and disadvantages of the fuzzy correlation coefficient, the asset allocation of the correlation coefficient is more properly described, such as portfolio management, risk management and financial derivatives pricing strategies, as well as to enhance the reliability of financial analysis. Application domains: Risk management in financial econometrics, actuarial sciences, credit management decision.
How to evaluate an appropriate correlation with fuzzy data is an important topic in the economics. Especially when the data illustrate uncertain, inconsistent and incomplete type. Traditionally, we use Pearson’s Correlation Coefficient to measure the correlation between data with real value. However, when the data are composed of fuzzy numbers, it is not feasible to use such a traditional approach to determine the fuzzy correlation coefficient. This study proposes the calculation of fuzzy correlation with of fuzzy data: interval, triangular and trapezoidal. Empirical studies are used to illustrate the application for evaluating fuzzy correlations. More related practical phenomena can be explained by this appropriate definition of fuzzy correlation.
Keywords: copulas, portfolio management, financial time series, fuzzy correlation, fuzzy data, evaluation, psychometrics
1. Introduction
Traditional statistics reflects the results from a two-valued logic world, which often reduces the accuracy of inferential procedures. To investigate the population, people’s opinions or the complexity of a subjective event more accurately, fuzzy logic should be utilized to account for the full range of possible values. Especially, when dealing with psychometric measures, fuzzy statistics provides a powerful research tool. Since Zadeh (1965) developed fuzzy set theory, its applications have been extended to traditional statistical inferences and methods in social sciences, including medical diagnosis or stock investment systems. For example, a successive series of studies demonstrated approximate reasoning methods for econometrics (Lowen, 1990; Ruspini,1991;Dubois & Parde ,1991) and a fuzzy time series model to overcome the bias of stock markets was developed (Wu & Hsu,2002).
Within the framework of classical statistical theory, observations should follow a specific probability distribution. However, in practice, the observations are sometimes described by linguistic terms such as "Very satisfactory," "Satisfactory," "Normal," "Unsatisfactory," "Very unsatisfactory”, or are only approximately known, rather than equating with randomness. How to measure the correlation between two variables involving fuzziness is a challenge to the classical statistical theory. The number of studies which focus on fuzzy correlation analysis and its application in the social science fields has been steadily increasing (Bustince and Burillo,1995; Yu, 1993; Liu and Kao, 2002; Hong, 2006). For example, Hong and Hwang (1995) and Yu (1993) define a correlation formula to measure the interrelation of intuitionist fuzzy sets. However, the range of their defined correlation is from 0 to 1, which contradicts with the conventional awareness of correlation which should range from -1 to 1. Wang and Li (1999)’s article also has the same problems of lying the correlations between 0 and 1 for the interval valued fuzzy numbers. In order to overcome this issue, Chiang and Lin (1999) take random sample from the fuzzy sets and treat the membership grades as the crisp observations. Their derived coefficient is between -1 and 1; however, the sense the fuzziness is gone. Liu and Kao (2002) calculated the fuzzy correlation coefficient based on Zadeh’s extension principles. They used a mathematical programming approach to derive fuzzy measures based on the classical definition of the correlation coefficient. Their derivation is quite promising, but in order to employ their approach, the mathematical programming is required.
In addition, most previous studies deal with the interval fuzzy data, their definitions cannot deal with triangle or trapezoid data. In addition, formulas in these studies are quite complicated or required some
mathematical programming which really limited the access of some researchers with no strong mathematical background. In this study, we give a simple solution of a fuzzy correlation coefficient without programming or the aid of computer resources. In addition, the provided solutions are based on the classical definition of Pearson correlation which should quite easy and straightforward. The definitions provided in this study can also be used for interval-valued, triangular and trapezoid fuzzy data.
Traditionally, if one wishes to understand the relationship between the variables x and y, the most direct and simple way is to draw a scatter plot, which can approximately illustrate the relationship between these variables: positive correlation, negative correlation, or zero correlation. In this study, we have proposed three kinds of fuzzy correlation which are based on the Neyman Person's correlation as well as the extension principle Definition 2.1, Definition 2.2 and Definition 2.3, the advantages are that we can compute various samples with fuzzy type, such as interval, triangle and trapezoid the type for the continuous sample.
The issue at hand is how to measure the relationship in a rational way. Statistically, the simplest way to measure the linear relationship between two variables is using Pearson’s correlation coefficient, which expresses both the magnitude and the direction of the relationship between the two variables with a range of values from 1 to -1. However, Pearson correlations can only be applied to variables that are real numbers and is not suitable for a fuzzy dataset.
When considering the correlation for fuzzy data, two aspects should be considered: centroid and data shape. If the two centroids of the two fuzzy dataset are close, the correlation should be high. In addition, if the data shape of the two fuzzy sets is similar, the correlation should also be high. An approach to dealing with these two aspects simultaneously will be presented later in this study. Before illustrating the approach of calculating fuzzy correlations, a review of fuzzy theory and fuzzy datasets are presented in the next section.
2. Copula and Fuzzy Correlation
Copula for correlation analysis of fuzzy data
The focus of our research proprosal is upon the development of techniques to use copulas in imprecise data of many economic phenomena. This is a new research area. First, fuzzy data are realizations of fuzzy random set time series. We need to extend copulas (e.g., Sklar.s theorem) to this new setting, as well as study ways to quantify correlation of fuzzy data.
First, we step back to investigate a popular but neglected domain in applications, namely copulas for DISCRETE variables. Second, we extend .nite variable to .nite random sets, where random sets are models of imprecise observed data in the sense that, we only observe a set containing our desirable measurements, and not the measurements themself. How to carry out statistical analysis with these available data?
Third, we extend random sets to fuzzy random sets, i.e., processes which give fuzzy data. We will develop concepts of correlation among fuzzy events and their quanti.cations using copulas.
The correlation coefficient is a commonly used statistics that presents a measure of how two random variables are linearly related in a sample. The population correlation coefficient, which is generally denoted by the symbol is defined for two variables x and y by the formula:
Y X Y X Y X Cov X Y , ( , )
is close to 1, an individual with a high value for one variable will likely have a high value for the other, and an individual with a lower value for one variable will likely to have a low value for the other. On the other hand, the more negativeis , the more negative the association is, this also indicate that an individual with a high value for one variable will likely have a low value for the other whenis close to -1 and conversely. Whenis close to 0, this means there is little linear association between two variables. In order to obtain the correlation coefficient, we need to obtainX2,
2 Y
and the covariance of x and y. In practice, these parameters for the population are unknown or difficult to obtain. Thus, we usually user , which can be obtained from a xy sample, to estimate the unknown population parameter. The sample correlation coefficient r is expressed as: xy
n i i n i i n i i i xy y y x x y y x x r 1 2 2 1 1 ) ( ) ( ) )( ( (1)
where (xi, iy ) is the ith pair observation value, i1,2,3...,n. x,y are sample mean for x and y respectively.
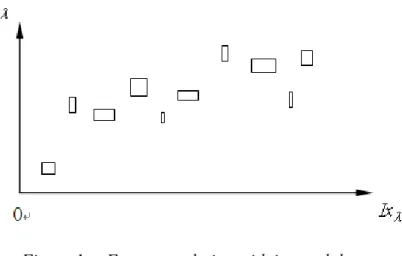
Pearson correlation is a straightforward approach to evaluate the relationship between two variables. However, if the variables considered are not real numbers, but fuzzy data, the formula above is problematic. For example, Mr. Smith is a new graduate from college; his expected annual income is 50,000 dollars. However, he can accept a lower salary if there is a promising offer. In his case, the annual income is not a definite number but more like a range. Mr. Smith’s acceptable salary range is from 45,000 to 50,000. We can express his annual salary as an interval [45000, 50000]. In addition, when Mr. Smith has a job interview, the manager may ask how many hours he can work per day. In this case, Mr. Smith may not be able to provide a definite number since his everyday schedule is different. However, Mr. Smith may tell the manger that his expected working hours per day is an interval [8, 10].
We know Mr. Smith’s expected salary ranges from [45000, 50000] and his expected working hours are [8, 10]. If we collect this kind of data from many new graduates, how can we use this data and calculate the correlation between expected salary and working hours? SupposeIxis the expected salary for each new graduate, Iyis the working hours they desired, then the scatter plot for these two sets of fuzzy interval numbers would approximate that shown in Figure 1.
Figure 1. Fuzzy correlation with interval data
For the interval valued fuzzy number, we need to take out samples from population X and Y. Each fuzzy interval data for sample X centroids has xi, and for sample Y has centroids yi. For the interval data, we also
correlation between the expected salary and working hours are high, then we can expect two things: (1) the higher salary the new employee expects, the more working hours he can endure. (2)The wider the range of the expected salary, the wider the range of the working hours should be. However, how should one combine the information from both centroid and length? If they are combined with equal weight, it is possible that the combined correlation would exceed the boundaries of 1 or -1. In addition, the effect of length should not be greater than the impact of centroids. In order to get the rational fuzzy correlations, we used natural logarithms to make some adjustments.
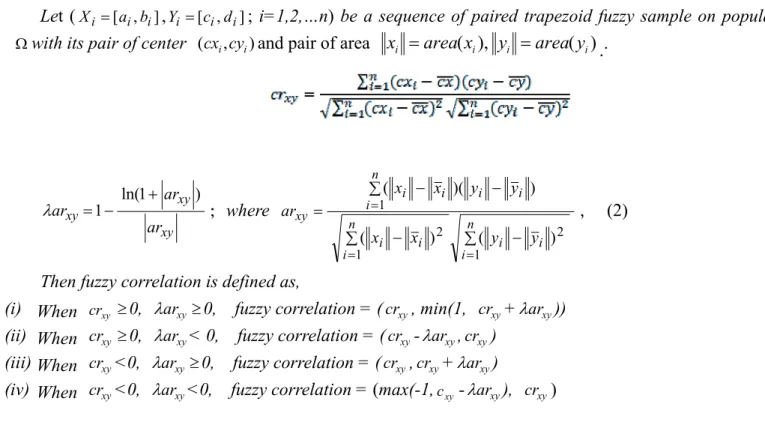
Let (Xi [ai ,bi],Yi[ci ,di]; i=1,2,…n) be a sequence of paired trapezoid fuzzy sample on population
with its pair of center (cxi,cyi)and pair of area (xi area(xi), yi area(yi). The adjust correlation for
the pair of area will be Definition 2.1
Let (Xi [ai ,bi],Yi[ci ,di]; i=1,2,…n) be a sequence of paired trapezoid fuzzy sample on population
with its pair of center (cxi,cyi)and pair of area xi area(xi), yi area(yi)..
, n i i i n i i i n i i i i i xy y y x x y y x x ar 1 2 2 1 1 ) ( ) ( ) )( ( , (2)
Then fuzzy correlation is defined as as ,
FC= ,
We choose a pair of depend on the weight of practical use. For instance, if we think the location correlation is much more important than that of e scale, will be a good suggestion.
Example 1. Suppose we have the following data as shown in Table 1.
Table 1. Numerical example for interval-valued fuzzy data
student X Y
Data center length data center length
A [23,25] 24 2 [1,2] 1.5 1 B [21,26] 23.5 5 [0,3] 1.5 3 C [29,35] 32 6 [0,1] 0.5 1 D [28,30] 29 2 [1,4] 2.5 3 E [26,28] 27 2 [2,3] 2.5 1 (fuzzy) mean 27.1 3.4 1.7 1.8
In this case, the correlation between the two centers is
26 . 0 ) 7 . 1 ( ) 1 . 27 ( ) 7 . 1 )( 1 . 27 ( 1 2 2 1 1 n i i n i i n i i i xy cy cx cy cx cr ,
05 . 0 ) 8 . 1 ( ) 4 . 3 ( ) 8 . 1 )( 4 . 3 ( 1 2 2 1 1 n i i n i i n i i i xy y x y x ar .
Table 2 is a list of conbinations for chosing . The fuzzy correlation will be computed by with 01,21. Such as, when 10.7 and 20.3 then FC0.7(0.26)0.30.050.17.
Table 2. Different conbinations of .
(1,0) (.9,.1) (.8,.2) (.7,.3) (.6,4) (.5,.5) (.4,.6) (.3,.7) (.2,.8) (.1,.9) (0,1) FC -0.26 -0.23 -0.20 -0.17 -0.14 -0.11 -0.08 -0.05 -0.01 0.02 0.05
Considering the contribution of (area) length correlation to the fuzzy correlation, the idea of correlation interval is proposed. Suppose we fix the (area) length correlation by the following adjusted values.
xy xy xy ar ar r 1ln(1 ) ; where n i i i n i i i n i i i i i xy y y x x y y x x ar 1 2 2 1 1 ) ( ) ( ) )( ( , (2)
since 1arxy 1, the range of rxy will be 0<rxy<0.3069. We will have the following definition for
fuzzy correlation interval. Definition 2.2
Let (Xi [ai ,bi],Yi[ci ,di]; i=1,2,…n) be a sequence of paired trapezoid fuzzy sample on population
with its pair of center (cxi,cyi)and pair of area xi area(xi), yi area(yi)..
xy xy xy ar ar ar 1 ln(1 ) ; where n i i i n i i i n i i i i i xy y y x x y y x x ar 1 2 2 1 1 ) ( ) ( ) )( ( , (2)
Then fuzzy correlation is defined as,
(i) When crxy 0, arxy0, fuzzy correlation = (crxy, min(1, crxy+arxy))
(ii) When crxy 0, arxy< 0, fuzzy correlation = (crxy-arxy,crxy)
(iii) When crxy<0, arxy0, fuzzy correlation = (crxy,crxy+arxy)
(iv) When crxy<0, arxy<0, fuzzy correlation = (max(-1,cxy-arxy), crxy)
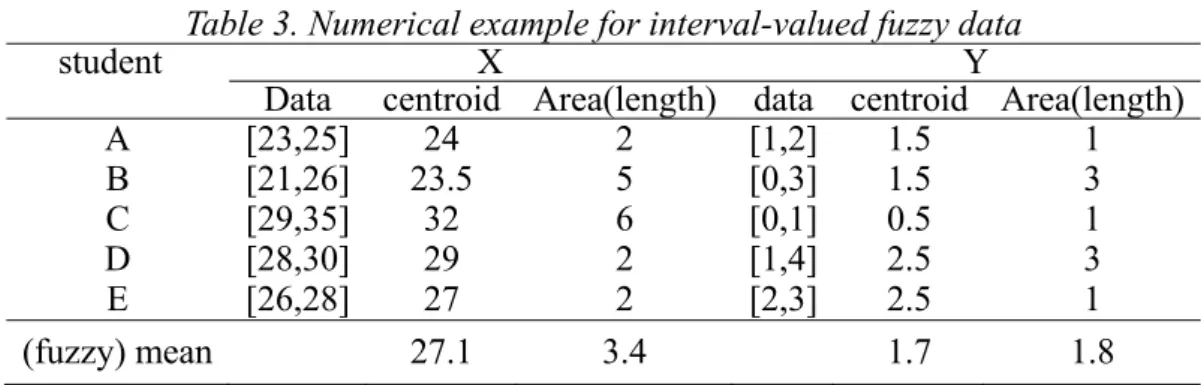
Table 3. Numerical example for interval-valued fuzzy data
student X Y
Data centroid Area(length) data centroid Area(length)
A [23,25] 24 2 [1,2] 1.5 1 B [21,26] 23.5 5 [0,3] 1.5 3 C [29,35] 32 6 [0,1] 0.5 1 D [28,30] 29 2 [1,4] 2.5 3 E [26,28] 27 2 [2,3] 2.5 1 (fuzzy) mean 27.1 3.4 1.7 1.8
In this case, the correlation between the two centroids is
26 . 0 ) 7 . 1 ( ) 2 . 27 ( ) 7 . 1 )( 2 . 27 ( 1 2 2 1 1 n i i n i i n i i i xy cy cx cy cx cr .
Similarly, the correlation between two lengths is
05 . 0 ) 4 . 1 ( ) 6 . 3 ( ) 4 . 1 )( 6 . 3 ( 1 2 2 1 1 n i i n i i n i i i xy y x y x ar 02 . 0 05 . 0 ) 05 . 0 1 ln( 1 xy ar .
Since the centers correlation arxy0, and the area(length) correlation arxy0, thus, fuzzy correlation = (r, r+arxy)) =(-0.26, -0.26+0.02)=(-0.26, -0.24). This implied that the relationship between the X and Y are quite small.
Another interesting idea is taking all possible correlations into consideration. That is we calculate the correlations for all endpoints of intervals. Then we take the mean of all possible correlations as our center of the fuzzy correlation. While the range is chosen by the three standard deviation, that is
12 ) ( 3 2 max min r r . Here we apply the idea of three standard deviation from quality control.
Definition 2.3
Let and be a sequence of paired fuzzy sample on population Ω. Let , j =1,2, k =1,2.
4 2 1 2 1 j k jk r r and
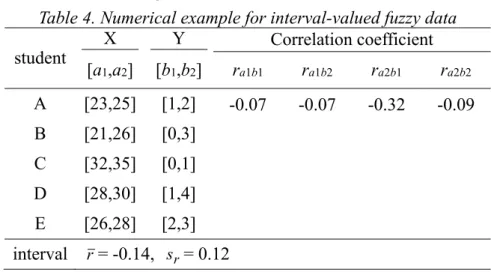
4 2 1 2 1 2 j k jk r r r s .Example 3. Suppose we have the following data as shown in Table 4.
Table 4. Numerical example for interval-valued fuzzy data
student X Y Correlation coefficient
[a1,a2] [b1,b2] ra1b1 ra1b2 ra2b1 ra2b2
A [23,25] [1,2] -0.07 -0.07 -0.32 -0.09 B [21,26] [0,3] C [32,35] [0,1] D [28,30] [1,4] E [26,28] [2,3] interval r= -0.14, sr= 0.12
Since the mean and Standard Deviation of are -0.14 and 0.12, thus, fuzzy correlation = ( -0.26,-0.02). This implied that the relationship between the X and Y are small.
A correlation coefficient is a number between -1 and 1 which measures the degree to which two variables are linearly related. If there is perfect linear relationship with positive slope between the two variables, we have a correlation coefficient of 1; if there is positive correlation, whenever one variable has a high value. Thus, base on the measure of evaluation, the degree of the population correlation coefficient, we will be considered for the correlation of fuzzy interval. As the correlation of fuzzy interval, [rlow, rup], is computed then the value of fuzzy correlation can be evaluated that is defined as,
(i) When [rlow, rup][ -0.10, 0.10 ], the fuzzy correlation is not significant.
(ii) When [rlow, rup][ -0.39, -0.11 ] or [0.11, 0.39 ], the fuzzy correlation is low value.
(iii) When [rlow, rup][ -0.69, -0.40 ] or [0.40, 0.69 ], the fuzzy correlation is middle value.
(iv) When [rlow, rup][ -0.99, -0.70 ] or [0.70, 0.99 ], the fuzzy correlation is high value.
3. Empirical studies
In this section, there are two empirical example will be considered to study the relationship with three schemes. In the first part, we employ the fuzzy interval data to investigate the relationship between climate and the price of vegetable from 2009 to 2011 in Taiwan. In the second part, we apply the exchange rate and the price of agriculture in Thailand.
3.1 Correlation between Climate and Agriculture Price in Taiwan
Having 33 samples are collected from the Central Weather Bureau and Agriculture and Food Agency Council of Agriculture Executive Yuan in Taiwan. We want to study which factors will impact the relationship between climate (X) and the price of vegetable (Y). The result presents the correlation for fuzzy data and in comparison with the price of vegetable.
Scheme Correlation coefficient Fuzzy Correlation by definition
1 .212
Fuzzy Interval by definition 2 (.339, .489) Fuzzy Interval by definition 3 (.348, .480)
Based on Table 5, we have the following findings. First, besides the correlation of temperature and vegetable price is positive, this result present that the temperature is increasing, the price of vegetable can be affected increasing. Second, the correlation coefficient of both new method and length and center are close. This means there is almost middle relationship between temperature and vegetable price in Taiwan.
3.2 Correlation of both pair Agriculture Price
There are 17 samples are collected from Thailand bank and Agriculture and Food Agency Council in Thailand. The results show the correlation for the exchanges rate and various price of agriculture with three approaches of evaluation of correlation coefficient. The results are listed in Table 6.
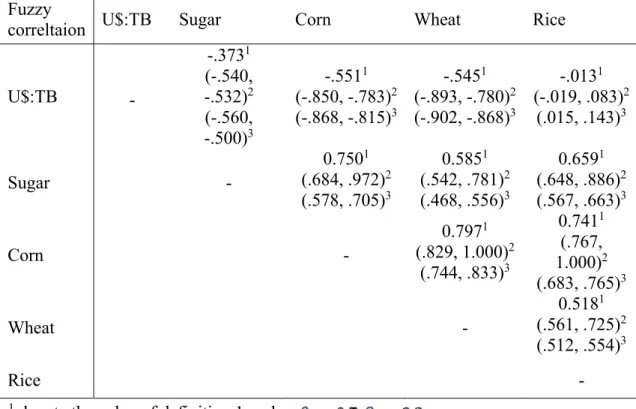
Table 6 Correlations interval based on Temperature and the price of Agriculture in Thailand Fuzzy
correltaion U$:TB Sugar Corn Wheat Rice
U$:TB - -.3731 (-.540, -.532)2 (-.560, -.500)3 -.5511 (-.850, -.783)2 (-.868, -.815)3 -.5451 (-.893, -.780)2 (-.902, -.868)3 -.0131 (-.019, .083)2 (.015, .143)3 Sugar - 0.7501 (.684, .972)2 (.578, .705)3 0.5851 (.542, .781)2 (.468, .556)3 0.6591 (.648, .886)2 (.567, .663)3 Corn - 0.7971 (.829, 1.000)2 (.744, .833)3 0.7411 (.767, 1.000)2 (.683, .765)3 Wheat - 0.5181 (.561, .725)2 (.512, .554)3 Rice -
Note: 1 denote the value of definition 1 under . 2 denote the value of definition 2.
3 denote the value of definition 3.
In the Table 6, we have the following findings. First, besides the correlation of exchange rate and the price of agriculture is negative, and this result denotes that the exchange rate decreases then the price of agriculture increase. Second, the correlation coefficient is high level for exchange rate and the price of corn, wheat, this means the price of corn and wheat have a lot of effect to exchange rate. In addition, the price of sugar will affect a little by exchange rate, and the price of race can not be influenced by exchange rate. Third, the any both price of agriculture are positive, and there are at the least middle relationship for any pair price of agriculture. This result show that one price of agriculture will affect other price of agriculture, such as the price of wheat can be affected by the price of rice.
4. Conclusions
Correlation between any two variables has wide applications in many applications. Previous studies have derived some solutions for calculating the correlation coefficient for fuzzy numbers. A common deficiency of those studies is that the correlation coefficients calculated are crisp values, instead of the intuitively believed fuzzy numbers. This paper uses a simple way to derive fuzzy measures based on the classical definition of Pearson correlation coefficient which are easy and straightforward. Moreover, the range of the calculated fuzzy coefficient is a fuzzy number with domain [-1, 1], which consist with the conventional range of Pearson correlation. In the formula we provided, when all observations are real numbers, the developed model becomes the classical Pearson correlation formula.
There are some suggestions for future studies. First, the main purpose of this study is to provide the formula of calculating fuzzy correlations. Only few samples are collected to illustrate how to employ the formula. Future interested researchers can use formula and collect a large-scale fuzzy questionnaires to make this formulas implement in practice. Second, when calculating the fuzzy correlation, we adopt arxyto adjust
the correlations, but researchers can set up their own arxyvalues if there are defensible reasons. However, it is suggested that the impact of length correlation should not exceed the impact of centroid correlation. Third, this study only considered the fuzzy correlation for continuous data. It would be interested to investigate the fuzzy correlation for discrete fuzzy data.
In practice, many applications are fuzzy in nature. We can absolutely ignore the fuzziness and make the existing methodology for crisp values. However, this will make the researcher over confident with their results. With the methodology developed in this paper, a more realistic correlation is obtained, which provides the decision maker with more knowledge and confident to make better decisions.
References
Bustince, H & Burillo , P. (1995). Correlation of interval-valued intuitionistic fuzzy sets, Fuzzy Sets and Systems, 74, 237-244.
Chiang, D.A. &Lin, N.P. (1999). Correlation of fuzzy sets, Fuzzy Sets and Systems, 102, 221-226.
Dubois, D. & Prade, H. (1991). Fuzzy Sets in Approximate Reasoning, Part 1: Inference with Possibility Distributions, Fuzzy Sets and Systems, 40, 143-202.
Hong, D. & Hwang.S. (1995). Correlation of intuitionistic fuzzy sets in probability space, Fuzzy Sets and Systems, 75, 77-81.
Hong, D. (2006). Fuzzy measures for a correlation coefficient of fuzzy numbers under Tw (the weakest t norm)-based fuzzy arithmetic operations, Fuzzy Sets and Systems , 176,150-160.
Liu.S. & Kao.C.(2002). Fuzzy Measures for correlation coefficient of fuzzy numbers. Fuzzy Sets and Systems,128, 267-275.
Lowen, R. (1990) A fuzzy language interpolation theorem. Fuzzy Sets and Systems, 34, 33-38. Ruspini, E. (1991) Approximate Reasoning: past, present, future. Information Sciences. 57, 297-317.
Wu, B.& Hsu, Y.(2002). The Use of Kernel Set and Sample Memberships in the Identification of Nonlinear Time Series., Soft Computing Journal., 8(3), 207-216.
Zedah, L. A. (1999). Fuzzy sets. Information and Control,8,338-353.
科技部補助專題研究計畫成果報告自評表 請就研究內容與原計畫相符程度、達成預期目標情況、研究成果之學術或應用價值(簡要敘 述成果所代表之意義、價值、影響或進一步發展之可能性)、是否適合在學術期刊發表或申請 專利、主要發現(簡要敘述成果是否有嚴重損及公共利益之發現)或其他有關價值等,作一 綜合評估。
1.
請就研究內容與原計畫相符程度、達成預期目標情況作一綜合評估 □ 達成目標 □ 未達成目標(請說明,以100 字為限) □ 實驗失敗 □ 因故實驗中斷 □ 其他原因 說明:2.
研究成果在學術期刊發表或申請專利等情形: 論文:□已發表 □未發表之文稿 □撰寫中 □無 專利:□已獲得 □申請中 □無 技轉:□已技轉 □洽談中 □無 其他:(以100 字為限)3.
請依學術成就、技術創新、社會影響等方面,評估研究成果之學術或應用價值(簡要敘述 成果所代表之意義、價值、影響或進一步發展之可能性),如已有嚴重損及公共利益之發 現,請簡述可能損及之相關程度(以500 字為限) 附件二ISME2013 (Oct. 11-13, 2013)
科技部補助專題研究計畫出席國際學術會議心得報告
日期:103 年 8 月 25 日
1. The 10th International Symposium on Management Engineering, 於 2014 年 10 月 11 日至 10 月13 日在 Hangzhou, China 舉行, 由 Zhejiang Gongshang University, International Society of Management Engineers 主辦,. 來自各國之學者專家約有 70 餘人參加, 包括地主國外, 韓國 台灣, 美國, 加拿大, 澳洲, 南非, 馬來西亞, 捷克等 10 餘國. This conference aims at bringing together researchers in Management Engineering for an opportunity to present and discuss theoretical and applied research problems as well as to foster research collaborations. The main theme of this Tenth International Meeting is Financial Econometrics and the conference is open to any topics in economics. The Tenth Conference will feature two keynote addresses: (1) Professor Junzo Watada, Waseda University (2) Professor Kuldeep Kumar, Bond University:
2 本次大會就以下幾項重點主題進行研討
Our research studies are very much related to social and humanity sciences even though we are greatly concerned with engineering. The production cannot only be discussed from the perspective of production engineering but also should be decided from the scope of management, marketing, economy, etc. Many research topics are multidirectional. This conference perspective should influence production engineering from the perspective of the management and
information as same as management and information should not be self-contained and self-absorbed science. All the fields are interrelated. Therefore, we have to work on
interdisciplinary fields proposed in this IMIP symposium.. 以及一些新觀念如: Perception measurement, Stochasticvalidity,創新管理與創新計算等新看法。
二. 攜回的資料:
1. The 10th International Symposium on Management Engineering研討會論文集 2.與 Professor Nguyen, Hung, Vladick Kreinovich 等學者討論有關最近著作與研究結果。 三. 建議與其他 目前筆者在政大應數研究所開設模糊統計與時間數列分析與預測課程多年,深感學術 研究發展日新月異、一日千里。國科會能給予補助出國出席國際學術研討會,收穫相 當大。希望將來能多利用課餘時間出國做短期研究,吸收國外新知、及研究方向。回 國後繼續開設模糊時間數列分析與預測課程,指導博、碩士班研究生,籌辦國際學術 研討會,推動國際財金與管理學術研究工作。並於國際著名學術論文期刊,發表學術 論文。 計畫編號 MOST 102-2410-H-004 -182 - 計畫名稱 基於結構關聯分析之模糊資料型的財經時間數列相關程度探討 出國人員 姓名 吳柏林 服務機構及職稱 政大應數系 會議時間 2013 年 10 月 11 日至 2013 年 10 月 13 日 會議地點 Hangzhou, China
會議名稱 (中文) (英文) The 10th International Symposium on Management Engineering
發表題目
(中文)
(英文) The quality of score comparison is not strained: A new approach on students’ academic performance evaluation with fuzzy data
Published Paper
The quality of score comparison is not strained: A new approach on students’
academic performance evaluation with fuzzy data
Hung-Yao Kuo
Department of Ed. Policy and Administration,
National Chi Nan University, Taiwan [email protected]
Berlin Wu
Department of Mathematical Sciences,
National ChengChi Univ., Taiwan [email protected]
Wentsung Lai
Department of Ed. Policy and Administration,
National Chi Nan University, Taiwan [email protected]
Abstract: This study devised and applied a novel defuzzification method to generate and review
calculations of fuzzy values derived from the scores of 2 student mathematical tests. For similar or identical score averages containing variable differences that are not typically detected using traditional measurement tools, we assigned a “progress value” to distinguish the scores. This new progress value was then used to select students with differing academic potentials to participate in math competitions. From each of the 3 classes that participated in the study, we chose 10 students as subjects, 30 in total. We used nonparametric statistics to analyze and compare the obtained defuzzification values. Also can test the school whether in accordance with provisions of Ministry of Education to implement normal class. The conclusions of major findings were summarized as follows. First, although the averages are equal, but their progress value may be different. Second, we can sort from the group of same average student, and according to the sorting to find who suit to take part in math competition.Third, we find the school implements the normal class in accordance with the provisions of Ministry of Education.
Keywords: defuzzification, progress value, sort, normal class 1. Introduction
The question of how to distinguish students based on similarly averaged test scores for determining who is most suitable to participate in other scholastic competitions has not been addressed by studies on the use of fuzzy logic in educational assessment. A comparison between students is difficult when the list lacks discrimination. This study
presents a comparison of sorted scores by using a unique form of discrimination analysis based on a novel definition of interval fuzzy scores to calculate a defuzzification value (Harloff, 2011). The new definition and score analysis method were used to assess the performance levels among several similar student tests. This effectively overcomes the
problem of sorted-score comparison. Student interval fuzzy scores were defined as (a, b), where a and b are two test scores for the same student. Interval fuzzy scores were then transformed to
defuzzification scores based on Harloff (2011). This strategy enabled using the defuzzification value to compare both the sorted scores in and among themselves, and the sorted scores with those that, by using traditional scoring
measurements, generated similar or identical averages. It also enabled nonparametric analysis of the defuzzification values. Thus, medians between groups could be tested.
A review of relevant literature was divided into three parts. The first part
ISME2013 (Oct. 11-13, 2013)
theory. Zadeh’s fuzzy theory explains several phenomena; and since its inception, the theory has been well developed. Recent research has developed new concepts and methods related to fuzzy theory statistical analysis (Wu & Lin, 2002; Dubois et al., 2005; Sun & Wu, 2007; Wang & Chen, 2010; Hsu et al., 2009). The second part of the literature review consisted of researching interval fuzzy numbers and enhanced methods for applying fuzzy theory (Suleman & Suleman, 2012; Liu et al., 2008; Harloff, 2011; Yager et al., 2001; Fan, 2010). The third part of the literature review
consisted of researching the sorting of fuzzy numbers, which has resulted in the proposal of many new methods (Sengupta & Pal, 2000; Lin & Chen, 2004; Nguyen & Wu, 2006; Lee & Lee, 2001; Hung et al., 2011; Ravi et al., 2010; Chu & Lin, 2009; Lin et al., 2006). This study similarly proposes a novel model for comparing student scores by transforming interval fuzzy scores into a defuzzification value, which enables a more precise sorting of students. This study solved the problem of sorting scores that, by using traditional measuring tools, generate identical or similar averages. Therefore, this paper proposes a defuzzification method for discriminating student scores containing identical or similar averages.
2. Research methods 2.1. Interval fuzzy number
Definition 2.1 of interval fuzzy scores. This study presents a novel definition of interval fuzzy scores that can be used as an analytical tool in discriminating student scores. We defined student performance interval fuzzy scores as (a, b), where a and b are two test scores for one student and a ≤ b. For example, a student achieved 88% and 78% as his or her scores on two math tests. Therefore, his or her interval fuzzy scores are (80, 90) and the students' mathematical ability is between 80 and 90 points. Using a mean of (80 + 90) / 2 = 85 is simpler, but interval fuzzy scores are a closer measurement of actual performance capabilities because human abilities typically include subtle differences that distinguish one from another and, therefore, require nuanced or “fuzzy” descriptions. This study used a novel interval
fuzzy score model to sort and analyze indicators of student performance.
Definition 2.2 defines the defuzzification of interval fuzzy scores.
Let X = (a, b) be an interval fuzzy number; c is the range center; and X = |b-a| is the entire distance. The defuzzification value of the interval fuzzy number isxf .
) 1 . 2 ( ) ln( 2 e X X c xf ) 2 . 2 ( ) ln( 2 e X X
Equation 2.2 is the defuzzification function of the interval length. Ifab, then xf
approaches the range center value 2
b a
. 2.2. Calculating the Domain ofxf by Using
Equation 2.1
If test scores are expressed as percentages, then the domain of xf is
calculated using Equation 2.1, because
Equation 2.2 has a maximal value of 10.8 and a minimal value of 0. The domain is
calculated using the following process: 0 2 0 )) ln( 2 ( lim lim ) ln( 2 lim 0 0 0 e X X X e X X X X 8 . 10 ) 100 ln( 2 100 )) ln( 2 ( lim lim ) ln( 2 lim 100 100 100 e X e X X e X X X X
Thus, Equation 2.2 has a minimal value of 0 and a maximal value of 10.8. Therefore, Equation 2.1 has a minimal value of c and a maximal value of c + 10.8. If test scores are expressed as percentages, then we let xf
maximal value be min (100, c +10.8) and their minimal value be c, where the domain of xf
matches educational requirements and habits. 2.3 The same average and X , but
different progress value
) 3 . 2 ( ) ln( 2 e X X c xf
e X
X ln
2 (2.4)
When the score increases, then X is positive; when the score decreases, then X is negative. For examples, refer to Table 2.1.
2.4 The same average but different
potential. For examples, refer to Table 2.2
2.5 Why We Use Fuzzy Statistics Since fuzzy theory was first introduced by Zadeh in 1965, its application in every research field employing fuzzy statistics has grown rapidly, similar to mushrooms after a rain storm. Many research fields employ fuzzy logic as a theoretical foundation and extend the logical concepts of the two-valued (bivalent) logic of traditional mathematics, thus breaching the limited thinking of binary logic. The concern of a scholar of fuzzy statistics is that human thinking cannot be measured or described using a single (truth value) option. In other words, human thinking should include each variable in a truth value range (from completely true to completely
false), thereby revealing the relative importance of each variable (Law, 1997; Nguyen & Wu, 2006; Wu, 2005).
In contrast to the traditional quantized questionnaire, the fuzzy questionnaire can reflect more accurately the possibilities
inherent in a fuzzy thinking specialty. Because human thinking and behavior more often reflect the uncertain or “fuzzy” nature of life situations and considerations, all languages can be deemed “fuzzy languages” because they employ tools for addressing uncertainty or variability (Wu, 2005). Applying fuzzy logic to the application and analysis of a questionnaire offers a novel approach to collecting and analyzing data. It therefore validates the varied experiences and abilities of people (Jiang, Wu & Hu, 2008).
Relative to traditional data, we can know the final or true/false value of a participant’s response, as well as his or her more precise “fuzzy” thinking. In other words, a
participant's true thoughts, beliefs, and even preferences are reflected more accurately in fuzzy logic.
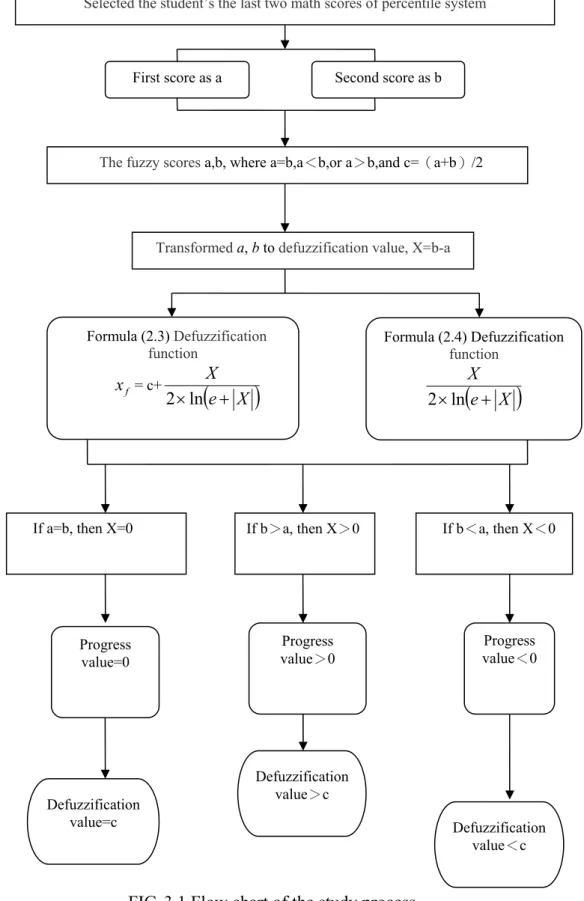
3. Research Method 3.1. Study Flow Chart
ISME2013 (Oct. 11-13, 2013)
FIG. 3.1 Flow chart of the study process
4. Empirical Study
4.1. Sort Ten Students’ Scores in Three Classes According to Defuzzification
Scores
In table 4.1, although the average of No.3 student was larger than to the average of No.4 student, but the progress value of No.3 student The fuzzy scores a,b, where a=b,a<b,or a>b,and c=(a+b)/2
Selected the student’s the last two math scores of percentile system
First score as a Second score as b
Transformed a, b to defuzzification value, X=b-a
Formula (2.3) Defuzzification function f x = c+
X e X ln 2 Formula (2.4) Defuzzification function
e X
X ln 2If a=b, then X=0 If b>a, then X>0 If b<a, then X<0
Progress value>0 Progress value=0 Progress value<0 Defuzzification value<c Defuzzification value>c Defuzzification value=c
was less than to the progress value of No.4 student, then we obtain defuzzification scores of No.3 student was less than to
defuzzification scores of No.4 student.The meanings of education imply that No.4
student had more potential than No.3 student . In table 4.2, although the average of No.6 student was equal to the average of No.10 student, but the progress value of No.6 student was less than to the progress value of No.10 student, then we obtain defuzzification scores of No.6 student was less than to
defuzzification scores of No.10 student.The meanings of education imply that No.10 student had more potential than No.6 student .
In table 4.3, although the average and interval length of No.1 student was equal to the average of No.4 student, but the progress value of No.1 student was positive and
increasing ; the progress value of No.4 student was negative and decreasing, then we obtain defuzzification scores of No.4 student was less than to defuzzification scores of No.1 student.The meanings of education imply that No.1 student had more potential than No.4 student .
4.3. Fuzzy Wilcoxon Rank-sum Test 4.3.1. Class 1 and Class 2
Results was shown in Table 4.4.Test class 1 and class 2 by Wilcoxon rank-sum Test ,the median of those two classes were not significantly different.
4.3.2. Class 2 and Class 3
Results was shown in Table 4.5.Test class 2 and class 3 by Wilcoxon rank-sum Test ,the median of those two classes were not significantly different.
4.3.3. Class 1 and Class 3
Results was shown in Table 4.6.Test class 1 and class 3 by Wilcoxon rank-sum Test ,the median of those two classes were not significantly different.
4.4. Fuzzy Kruskal-Wallis Test
Results was shown in Table 4.7.Test class 1 , class 2 and class 3 by Kruskal-Wallis test ,the median of those three classes were not
significantly different. 4.5. Discussion
We can use the new approach to find who suit to part in math competition? In table 4.1,4.2 and 4.3 showed that we can effectively overcomes the problem of sorted-score
comparison. There were three types to be divided. Frist, although the average of “A” student was larger than to the average of “B” student, but the progress value of “A” student was less than to the progress value of “B” student, then we obtain defuzzification scores of “A” student was less than to defuzzification scores of “B” student.The meanings of
education imply that “B” student had more potential than “A” student .Second, although the average of “A”student was equal to the average of “B” student, but the progress value of “A” student was less than to the progress value of “B” student, then we obtain
defuzzification scores of “A”student was less than to defuzzification scores of “B”
student.The meanings of education imply that “B” student had more potential than “A” student .Third, although the average and interval length of “A” student was equal to the average of “B” student, but the progress value of “A” student was positive and increasing ; the progress value of “B” student was negative and decreasing, then we obtain defuzzification scores of “B” student was less than to defuzzification scores of “A”
student.The meanings of education imply that “A” student had more potential than “B” student .
How to find the school whether to implement the normal class in accordance with the provisions of Ministry of Education in Taiwan? In table 4.4,4.5 ,4.6 and 4.7, we test class 1 and class 2 ; class 3 and class 2; class 3 and class 1 by Wilcoxon rank-sum Test, the median of those two classes were not significantly different.And we test class 1, class 2 and class 3 by Kruskal-Wallis test, the median of those three classes were not
significantly different. We can find this school is in accordance with the provisions of
ISME2013 (Oct. 11-13, 2013)
5. Conclusion
This study solved two research problems. The first is the problem of sorting scores when score discrimination is low or when score means are equal. The second is the problem of conducting nonparametric analysis by using fuzzy scores. The defuzzification value of the fuzzy scores solves both of these research problems. A novel fuzzy score definition, expressed in Equation 2.3, was used to conduct defuzzification sorting analysis. The results obtained from such analysis can be used to solve the problem of distinguishing identical scores and scores containing a low degree of discrimination, and can be used to accommodate the progress value to identify student potential more accurately. This method can also be used to evaluate schools and their compliance with stipulations by the Ministry of Education in implementing core curriculum classes.
Reference
[1] A.Suleman and F. Suleman (2012). Ranking by competence using a fuzzy approach, QUALITY & QUANTITY, vol.46, 323-339, doi:
10.1007/s11135-010-9357-1.
[2] A.Sengupta and T. K. Pal (2000). On comparing interval numbers, Eur. J. Oper. Res., vol.127, pp.28.
[3] B. L. Wu and Y. H. Lin (2002). The introduction of fuzzy mode and its applications, Information of Statistics with Measurement, vol.47, pp.23-27. [4] C. C. Lin and A. P. Chen (2004). Fuzzy
discriminate analysis with outlier detection by genetic algorithm,
Computers & Operations Research,
vol.31, no.6, pp.877.
[5] D. Dubois, H. Fargier, and J. Fortin (2005). The empirical variance of a set of fuzzy intervals, Proc. of the Int. Conf. on Fuzzy Systems, Reno, Nevada, 22-25, IEEE Press, pp.885-890.
[6] H. Liu, B. Wu and M. Liu (2008). Investors’ preference order of fuzzy
numbers, Computers and Mathematics with Applications, vol.55, pp.2623-2630. [7] H. Nguyen, and B. Wu (2006).
Fundamentals of Statistics with Fuzzy Data, Heidelberg: Springer-Verlag. [8] J. Harloff (2011). Extracting cover sets
from free fuzzy sorting data. QUALITY & QUANTITY, vol.45, pp.1445-1457, doi: 10.1007/s11135-011-9497-y.
[9] J. Lee and H. Lee (2001). Comparison of fuzzy values on a continuous domain, Fuzzy Sets Syst, vol.118, pp.419. [10] M. Sun and B. Wu (2007). New
statistical approaches for fuzzy data, International Journal of Uncertainty, Fuzziness and Knowledge-based Systems, vol.15, no.2, pp.89-106.
[11] N. Hung, K. Vladik, B. Wu, and X. Gang (2011). Computing Statistics under Interval and Fuzzy Uncertainty, Studies in Computational Intelligence, Springer Verlag.
[12] N. Ravi, V. Shankar, K. Sireesha, S. Rao and N. Vani (2010). Fuzzy Critical Path method based on metric distance ranking of fuzzy numbers, International Journal of Mathematical Analysis, vol.4, no.20, pp.995-1006.
[13] R. R. Yager, M. Detyniecki and B. Bouchon-Meunier (2001). A
context-dependent method for ordering fuzzy numbers using probabilities. Inf. Sci., vol.138, pp.237.
[14] S.K.Jiang , B.Wu and M.L.Hu (2008). Investors' preference order of fuzzy numbers, Computers and Mathematics, Vol.55, pp.2623-2630.
[15] T. C. Chu and Y. C. Lin (2009). Interval arithmetic based fuzzy TOPSIS mode, Expert Systems with Applications, vol.36, pp.10870-10876.
[16] T. C. Wang and Y. H. Chen (2010). Incomplete Fuzzy Linguistic Preference Relations under Uncertain Environments. Information Fusion, vol.11, no.2,
pp.201-207.
[17] T. H. Hsu, T. N.Tsai and P. L.Chiang (2009). Selection of the Optimum Promotion Mix by Integrating. A Fuzzy Linguistic Decision Model with Genetic Algorithms, Information Sciences,
vol.179, no 1-2, pp.41-52.
[18] Y. Lin, M. Yi and B. Wu (2006). Fuzzy classification analysis of rules usage on probability reasoning test with multiple raw rule score, Educational Technologies, vol.2, pp.54-59.
[19] Z. P. Fan (2010). An Approach to Solve Group-Decision-Making Problems with Ordinal Interval Numbers, IEEE Trans. Syst., Man, Cybern. B, vol.40, no5, pp.1413-1423.
Table 2.1 The same average and X , but different progress value
1th score 2th score Average X X progress value defuzzification value
80 90 85.0 10 10 1.97 86.97
90 80 85.0 10 -10 -1.97 83.34
Table 2.2 The same average but different potential.
1th score 2th score average X X progress
value defuzzification value sorting
85 85 85 0 0 0.00 85.00 6 84 86 85 2 2 0.65 85.65 5 86 84 85 2 -2 -0.65 84.36 7 83 87 85 4 4 1.05 86.05 4 87 83 85 4 -4 -1.05 83.95 8 82 88 85 6 6 1.39 86.39 3 88 82 85 6 -6 -1.39 83.62 9 81 89 85 8 8 1.69 86.69 2 89 81 85 8 -8 -1.69 83.31 10 80 90 85 10 10 1.97 86.97 1 90 80 85 10 -10 -1.97 83.03 11
Table 4.1 Class 1 (ten students) - Sorting by defuzzification scores
Student code math First
score a Second math score b 2 b a =c Interval length X X Progress value Defuzzification scores xf Sort by xf 1 76 85 80.5 9 9 1.83 82.33 5
ISME2013 (Oct. 11-13, 2013) 2 84 82 83.0 2 -2 -0.64 82.36 4 3 68 74 71.0 6 6 1.39 72.39 8 4 66 80 73.0 14 14 2.49 75.49 7 5 57 50 53.5 7 -7 -1.54 51.96 10 6 90 97 93.5 7 7 1.54 95.04 1 7 48 62 55.0 14 14 2.49 57.49 9 8 87 94 90.5 7 7 1.54 92.04 2 9 93 80 86.5 13 -13 -2.36 84.14 3 10 81 81 81.0 0 0 0.00 81.00 6
Table 4.2 Class 2 (ten students)-Sorting by defuzzification scores
Student
code math First score a Second math score b 2 b a =c Interval length X X Progress value Defuzzification scores f x Sort by xf 1 6 6 8 7 2.0 7 2 1 2 32.2 74.23 6 2 7 3 4 6 8.5 6 9 9 83-1. 66.67 7 3 8 2 4 8 3.0 8 2 40.6 83.64 4 4 9 0 4 9 2.0 9 4 51.0 93.05 1 5 5 4 8 4 1.0 5 6 6 39-1. 49.61 10 6 8 9 3 9 1.0 9 4 51.0 92.05 3 7 6 3 7 5 0.0 6 6 6 39-1. 58.61 8 8 7 8 0 8 9.0 7 2 40.6 79.64 5 9 6 3 4 5 8.5 5 9 9 83-1. 56.67 9 1 8 9 9 6 1.3 92.39 2
0 8 4 1.0 9
Table 4.3 Class 3 (ten students)-Sorting by defuzzification scores
Student code First math score a Second math score b 2 b a =c Interval length X X Progress value Defuzzification scores xf Sort by xf 1 66 73 69.5 7 7 1.54 71.04 5 2 80 85 82.5 5 5 1.22 83.72 4 3 56 62 59.0 6 6 1.39 60.39 9 4 74 68 71.0 6 -6 -1.39 69.61 6 5 91 95 93.0 4 4 1.05 94.05 1 6 70 63 66.5 7 -7 -1.54 64.96 7 7 54 57 55.5 3 3 0.86 56.36 10 8 88 92 90.0 4 4 1.05 91.05 2 9 78 89 83.5 11 11 2.10 85.60 3 10 69 63 66.0 6 -6 -1.39 64.61 8
Table 4.4 Class 1 and Class 2 -Wilcoxon rank-sum Test
Result:
Test class 1 and class 2 by Wilcoxon rank-sum Test ,the median of those two classes were not significantly different.
grade
class number
Lever
median Rank sum Defuzzification value 1 10 10.90 109.00 2 10 10.10 101.00 sum 20 Test statistic Defuzzification value Mann-Whitney U Statistics 46.00 Wilcoxon W Statistics 101.00 Z test -.30 Asymptotic significance (two-tailed) .76 Precise significance [2 * (one-tailed significance)] .80
ISME2013 (Oct. 11-13, 2013) Table 4.5 Class 2 and Class 3 -Wilcoxon rank-sum Test
Result:
Test class 2 and class 3 by Wilcoxon rank-sum Test ,the median of those two classes were not significantly different. grade class number Lever median Rank sum Defuzzification value 2 10 10.60 106.00 3 10 10.40 104.00 sum 20 Test statistic Defuzzification value Mann-Whitney U Statistics 49.00 Wilcoxon W Statistics 104.00 Z test -.076 Asymptotic significance (two-tailed) .94 Precise significance [2 * (one-tailed significance)] .97
Table 4.6 Class 1 and Class 3-Wilcoxon rank-sum Test grade
class number
Lever
median Rank sum Defuzzification value 1 10 11.20 112.00 3 10 9.80 98.00 sum 20 Result:
Test class 1 and class 3 by Wilcoxon rank-sum Test ,the median of those two classes were not significantly different. Test statistic Defuzzification value Mann-Whitney U Statistics 43.00 Wilcoxon W Statistics 98.00 Z test -.53 Asymptotic significance (two-tailed) .60 Precise significance [2 * (one-tailed significance)] .63
Table 4.7 Classes 1, 2, and 3-Fuzzy Kruskal-Wallis Test
number median
Standard
deviation min max
Defuzzification value 30 75.41 14.04 49.61 95.04 Class 30 2.00 .830 1 3 Kruskal-Wallis test Grade
class number Level median Defuzzification value 1 10 16.60 2 10 15.20 3 10 14.70 Test statistic Defuzzification value Chi-square .25 Freedom 2
sum 30
Result:
Test class 1 , class 2 and class 3 by
Kruskal-Wallis test ,the median of those three classes were not significantly different.
Asymptotic significance
102 年度專題研究計畫研究成果彙整表
計畫主持人:吳柏林 計畫編號: 102-2410-H-004-182-計畫名稱:基於結構關聯分析之模糊資料型的財經時間數列相關程度探討 量化 成果項目 實際已達成 數(被接受 或已發表) 預期總達成 數(含實際已 達成數) 本計畫實 際貢獻百 分比 單位 備 註 ( 質 化 說 明:如 數 個 計 畫 共 同 成 果、成 果 列 為 該 期 刊 之 封 面 故 事 ... 等) 期刊論文 1 1 100% 研究報告/技術報告 1 1 100% 研討會論文 2 2 100% 篇 論文著作 專書 0 0 100% 申請中件數 0 0 100% 專利 已獲得件數 0 0 100% 件 件數 0 0 100% 件 技術移轉 權利金 0 0 100% 千元 碩士生 0 0 100% 博士生 0 0 100% 博士後研究員 0 0 100% 國內 參與計畫人力 (本國籍) 專任助理 0 0 100% 人次 期刊論文 0 0 100% 研究報告/技術報告 0 0 100% 研討會論文 0 0 100% 篇 論文著作 專書 0 0 100% 章/本 申請中件數 0 0 100% 專利 已獲得件數 0 0 100% 件 件數 0 0 100% 件 技術移轉 權利金 0 0 100% 千元 碩士生 1 1 100% 博士生 2 2 100% 博士後研究員 0 0 100% 國外 參與計畫人力 (外國籍) 專任助理 0 0 100% 人次其他成果