ASSESSMENT AND PROSPECTS OF ECONOMIC DEVELOPMENT IN
CHINA: 2003-2004
AUTOR
1:
CHEN-YUAN TUNG
Institute of International Relations National Chengchi University, Taiwan
FECHA:
Enero 2004
This yearly report first reviews economic and financial developments in China in 2003; the second part contains an analysis of the Renminbi issue; finally, this report concludes with an assessment of China’s economic performance in 2003 and prospects for 2004.2
1.Retrospective on the Chinese Economy in 2003 (first three quarters)
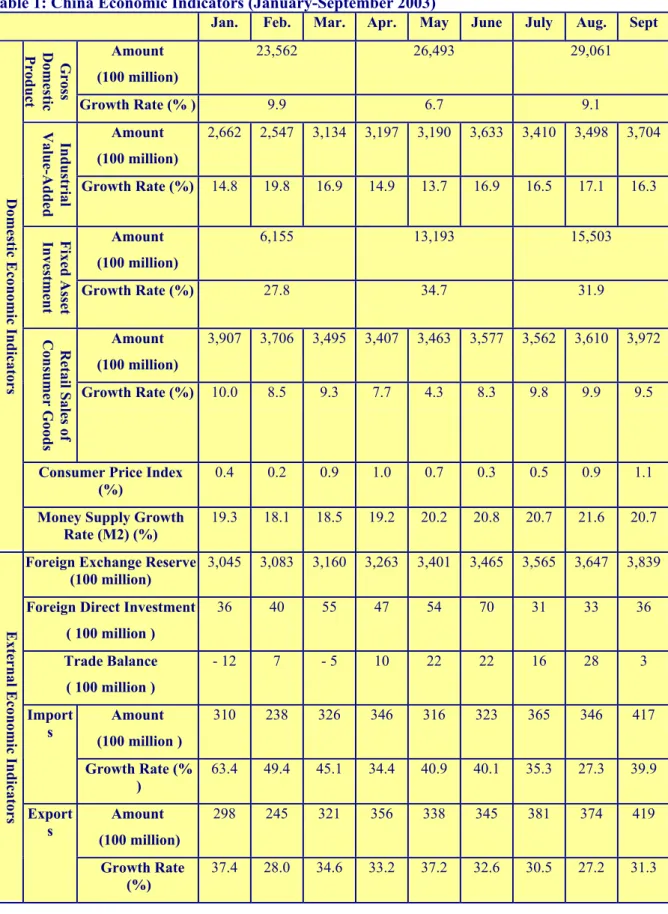
In the first three quarters of 2003, China experienced rapid-growing economy, with quarterly economic growth rates of 9.9%, 6.7%, and 9.1%. (See Table 1) China’s economic growth in the second quarter was negatively impacted by SARS; economic growth in the third quarter has completely recovered from the impact. According to an estimate by the National Bureau of Statistics of China, SARS reduced the country’s annual growth rate for 2003 by 0.8%.3 In the first three quarters, the gross domestic product (GDP) increased by 8.5% year over year (yoy). The People's Bank of China predicted that growth for the year as a whole would also be 8.5%.4
The rapid economic increase was mainly spurred by manufacturing. In the first three quarters, primary industry increased by 2.8%, secondary industry increased by 11.8%, and tertiary industry increased by 5.4%. In the first three quarters, the value-added of national industrial enterprises of a certain scale5 amounted to RMB 2,897.5 billion, an increase of 16.5% yoy. With respect to the composition of enterprises, value added of state-owned and state-held enterprises increased by 14.3% yoy; of collective-owned enterprises by 11.7%; of
1 Las opiniones expresadas en estos artículos son propias de sus autores. Estos artículos no reflejan necesariamente la opinión de UNISCI. The views expressed in these articles are those of the authors. These articles do not necessarily reflect the views of UNISCI
2 This article is first published in China Economic Analysis Yearly Report, Cross-Strait Interflow Prospect Foundation, December 2003.
3 Cheng Zhao and Zheng Liu, “Economic Growth in China Has Recovered to the pre-SARS Level,” (in Chinese), Xinhua General News Service, October 17, 2003.
4 Monetary Policy Report: 3rd Quarter 2003 (in Chinese), Analysis Group of Monetary Policy at the People's Bank of China, October 2003, p. 39.
5 Industrial enterprises of a certain scale refer to all state-owned enterprises and non state-owned enterprises with annual sales revenue of over RMB 5 million.
share-issuing enterprises by 17.9%; and of enterprises with funds from Hong Kong, Macao, and Taiwan by 19.6%.
The five major industries spurring industrial growth in China included electronic equipment, electronic appliances and equipment, transportation equipment, the metallurgical industry, and the chemical industry. In the first three quarters, the contribution rate of these five major industries to the overall industrial growth was as high as 50.7%, pulling up the overall growth rate by 8.4%. In terms of specific products, the production of metallurgical equipment increased by 122.4% yoy, computers by 102.8% yoy, micro-computers by 91.4% yoy, power equipment by 65%, optical fiber communication equipment by 60.6%, atmospheric antipollution equipment by 52%, semiconductor integrated circuits by 36.4%, automobiles by 35.7%, and steel by 21.6%.
In terms of demand, the rapid economic growth resulted, primarily, from the rapid expansion of investment. In the first three quarters of 2003, total investment in fixed assets amounted to RMB 3,435.1 billion, an increase of 30.5% yoy. State-owned fixed-asset investments increased by 31.4% (RMB 2,651.3 billion); collective investments increased by 36% (RMB 783.9 billion); individual investments increased by 24.7% (RMB 464.3 billion).
However, investment patterns were imbalanced. For example: among state-owned fixed asset investments, secondary industry investments experienced a rapid growth of 48.9% yoy. In particular, investments in raw and semi-finished materials industry and light and textile industry increased by 88% and 71% yoy respectively. Investments in the metallurgical industry experienced the most rapid growth, 119.3% yoy. In contrast, investments in primary industry merely increased by 8.5%, whereas investments in tertiary industry increased by 24.3%.
Investments in 2003 increased much more than in preceding years. In 2001 and 2002, fixed asset investments increased by only 12.1% and 16.1% respectively. Furthermore, the proportions of fixed asset investments in GDP increased from 33.5% in 1997, to 38.5% in 2001, and further to 42.2% in 2002. In the first three quarters of 2003, the proportion of fixed asset investments in GDP was as high as 43.4%, and an even higher figure is expected for the whole year. Such a proportion of investment has exceeded that of 1993 (37.7%), when China was experiencing inflation as a result of economic overheating. Inflation was then brought under control through macro-regulation and a “soft landing” was achieved in 1996. Chinese scholars are currently debating whether China is once again experiencing an overheated economy.
The current state-owned investment boom in the state sector is primarily fueled by local governments6, not by the central government. In the first three quarters of 2003, investments by the central government amounted to RMB 312.1 billion, accounting for 11.8% of state-owned and other fixed-asset investments, decreasing by 12% yoy. Investments by local governments amounted to RMB 2,339.2 billion, accounting for 88.2% of state-owned and other fixed-asset investments, increasing by 40.7% yoy.
Local governments have often been engaged in creating excess capacity and in low-efficiency investments in general. At a meeting on November 24, the Political Bureau of the Central Committee of the CPC emphasized, “blind investments and low-level repeated
6 State-owned and other fixed-asset investments refer to infrastructure construction, renovation and reform, and other investments excluding collective and individual investments in urban/rural areas.
construction are quite obvious in certain industries.”7 For example, by the end of October, 14 state-owned automobile companies had serious excess production; their unsold stock increased by 37.4% yoy. While local governments are falling over each other to establish development zones, 43% of the land in such zones is left unused.8
Bank loans were the primary source for local government investment financing. In the first three quarters of 2003, fixed-asset investments financed by bank loans increased by 50.3%, accounting for 24.4% of the total domestic fixed-asset investments. Once the economic bubble, especially in real estate, bursts, the fragile financial system with a high percentage of non-performing loans (NPL) will be severely impacted.9
To reduce financial risks associated with economic bubbles, on June 13, the People's Bank of China (PBoC) issued a Notice on Further Strengthening Management of Real Estate Credit, announcing new limitations on commercial bank loans for property development; the Notice also included limits on the amount and maturity of individual mortgage loans. In addition, to reduce liquidity in the banking system, the PBoC raised the deposit-reserve ratio by 1% on September 21, from 6% to 7%, and froze excess capital reserves of RMB 150 billion of commercial banks.10
In regards to consumption, in the first quarters of 2003, total retail sales of consumer goods in China increased by 8.6% yoy, amounting to RMB 3,269.9 billion. The bright sectors in terms of market sales included automobiles (up 77.5% yoy), communication equipment (up 74% yoy), architectural and decoration materials (up 46.6% yoy), furniture (up 23.2% yoy), electronic appliances and sound and video equipment (up 17.1% yoy), and culture and office articles (up 15.8%).
With respect to international trade, in the first three quarters of 2003, China’s exports amounted to US$ 307.7 billion, an increase of 32.3% yoy. Imports amounted to US$ 298.6 billion, an increase of 40.5% yoy. The trade surplus amounted to US$ 9.1 billion, representing a decrease of US$ 10.9 billion yoy. In foreign direct investments, in the first three quarters, the FDI contractual amount in China was US$ 79.2 billion, an increase of 36% yoy, whereas realized FDI amounted to US$ 40.2 billion, an increase of 11.9% yoy.
For most of the first three quarters of 2003, prices in China have remained relatively stable. The consumer price index (CPI) increased by 0.7% yoy. Food prices increased on average by 2.2%, driving total prices up 0.7%, while the average price of services increased by 2.2%, pulling total prices upward 0.5%. Meanwhile, prices of other goods, including in particularly manufactures, generally decreased. However, in November CPI rose by their biggest margin in six years (3%) sending out a clear signal that China is not inflation-proof. One striking aspect of China’s emerging inflation in November was that it has not affected the manufacturing sector, where some 90 percent of products are in oversupply. The main impetus behind the surprisingly sharp increase of the CPI in November came from farm and food products, in particular vegetables. We are thus seeing the emergence of an usual pattern:
7 Yunxiang Zhang, “The Chinese Fiscal Policy to Adjust” (in Chinese), Jingji Ribao [Economic Daily], November 25, 2003, p. 11.
8 John Lanhee Lee and Ramoncito de la Cruz, “The Sales of Chinese Made Automobiles in China for the First Ten Months Increased by 67.7%,” The Wall Street Journal (Chinese Edition), November 25, 2003. Ze-hong Lin, “Chinese Central Government Will Take Charge of Land and Resource Management,” (in Chinese),
Zhongguo Shibao [China Times], November 11, 2003.
9 Min Zhang, “China Half-Yearly Update,” World Bank, October 16, 2003, p. 3.
10 “The People’s Bank of China Injected RMB 50 billion into the Market This Week,” The Wall Street Journal, (Chinese Edition), August 28, 2003.
continued price stability (or deflation) for most industrial products and inflation for farm and food products.
In regards to income, the income of urban and rural residents continued to increase, however, the gap between urban and rural residents widened further. In the first three quarters, the per-capita disposable income of urban residents reached RMB 6,347, an increase of 9.5% yoy. The per-capita cash income of peasants was RMB 1,802, an increase of 3.8%. Hence, the income gap between urban and rural residents expanded. In the first three quarters, classifying residents into five groups in accordance with disposable income, the per-capita disposable income of families with the highest income (highest 20%) was RMB 13,120, whereas the per-capita disposable income of families with the lowest income (lowest 20%) was RMB 2,433. The ratio of per-capita disposable income, between highest and lowest income quintiles, rose from 5.2:1 in 2001 to 5.4:1 in 2003.
With respect to employment, the rate of registered urban unemployment increased from 4% at the end of 2002 to 4.2% at the end of June, 2003. Unemployment is expected to go up to 4.4% at the end of 2003 (nearly 8 million registered unemployed). According to one estimate, 40% of college graduates could not find jobs in the summer of 2003, a surprisingly high figure that needs to be watched carefully.11
Nevertheless, the real urban unemployment was much higher than the official figure — apart from the registered unemployed, real unemployment includes furloughed workers and displaced persons. In September 2002, Premier Zhu Rongji indicated that the urban unemployment rate in China was around 7%.12 However, the real unemployment figure may
have been underestimated. At the end of the third quarter, there were 18.59 million furloughed workers, nationwide. That is to say, at the third quarter, real total urban unemployment, including registered unemployment and furloughed numbers, may actually be 26.59 million, triple the registered unemployment.
The real unemployment in China can be described in different ways. A survey conducted in the Northeast area in China indicated that many registered unemployed have been engaged in certain jobs, but they worked invisibly, in order to receive the subsidy from the government. In fact, management of unemployment in China is far from perfect; figures are affected by many factors, including personal relationships. Even governmental managers know that some registered unemployed find jobs in private enterprises, but they will not investigate unless the unemployed make reports. Therefore, some registered unemployed, with jobs, still receive subsidies from the government. In short, management of unemployment in China is still in disorder, and the real numbers are difficult to gauge.13
11 Min Zhang, “China Half-Yearly Update,” World Bank, October 16, 2003, p. 3.
12 “Zhu Rongji Says China’s Unemployment Rate is 7%,”(in Chinese), Zhongguo Shibao, September 24, 2002, p. 11. 13 Jianguo Qi’s comment on the draft of this paper on November 19, 2003. Qi is Vice Director of Quantitative
Table 1: China Economic Indicators (January-September 2003)
Jan. Feb. Mar. Apr. May June July Aug. Sept Amount (100 million) 23,562 26,493 29,061 Gross D om es tic P ro d u ct Growth Rate (% ) 9.9 6.7 9.1 Amount (100 million) 2,662 2,547 3,134 3,197 3,190 3,633 3,410 3,498 3,704 In d u str ia l V alu e-A d d ed Growth Rate (%) 14.8 19.8 16.9 14.9 13.7 16.9 16.5 17.1 16.3 Amount (100 million) 6,155 13,193 15,503 F ix ed A ss et In ve stm en t Growth Rate (%) 27.8 34.7 31.9 Amount (100 million) 3,907 3,706 3,495 3,407 3,463 3,577 3,562 3,610 3,972 R et ail S ale s o f C on su m er G oo d s Growth Rate (%) 10.0 8.5 9.3 7.7 4.3 8.3 9.8 9.9 9.5
Consumer Price Index
(%) 0.4 0.2 0.9 1.0 0.7 0.3 0.5 0.9 1.1 D om es tic E co n om ic In d ic at or s
Money Supply Growth
Rate (M2) (%) 19.3 18.1 18.5 19.2 20.2 20.8 20.7 21.6 20.7 Foreign Exchange Reserve
(100 million)
3,045 3,083 3,160 3,263 3,401 3,465 3,565 3,647 3,839
Foreign Direct Investment ( 100 million ) 36 40 55 47 54 70 31 33 36 Trade Balance ( 100 million ) - 12 7 - 5 10 22 22 16 28 3 Amount (100 million ) 310 238 326 346 316 323 365 346 417 Import s Growth Rate (% ) 63.4 49.4 45.1 34.4 40.9 40.1 35.3 27.3 39.9 Amount (100 million) 298 245 321 356 338 345 381 374 419 E xt er n al E co n om ic In d ic at or s Export s Growth Rate (%) 37.4 28.0 34.6 33.2 37.2 32.6 30.5 27.2 31.3 Notes:
1. The figures of the domestic economic situation table are in RMB; the figures of the external economic situation are in USD.
2. Data source of Gross Domestic Product, Industrial Value-Added, Fixed Asset Investment, Retail Sales of Consumer Goods, and Consumer Price Index: National Bureau of Statistics of China web site. (http://www.stats.gov.cn)
3. Data source of Money Supply Growth Rate (M2) and Foreign Exchange Reserve: The People’s Bank of China (www.pbc.gov)
4. Data source of Foreign Direct Investment, Imports and Exports: Ministry of Commerce of the People’s Republic of China web site ( http://www.mofcom.gov.cn ) The FDI from January to September amounted to US$ 40.2 billion, and the trade balance amounted to US$ 9.1 billion.
2.Financial Situation
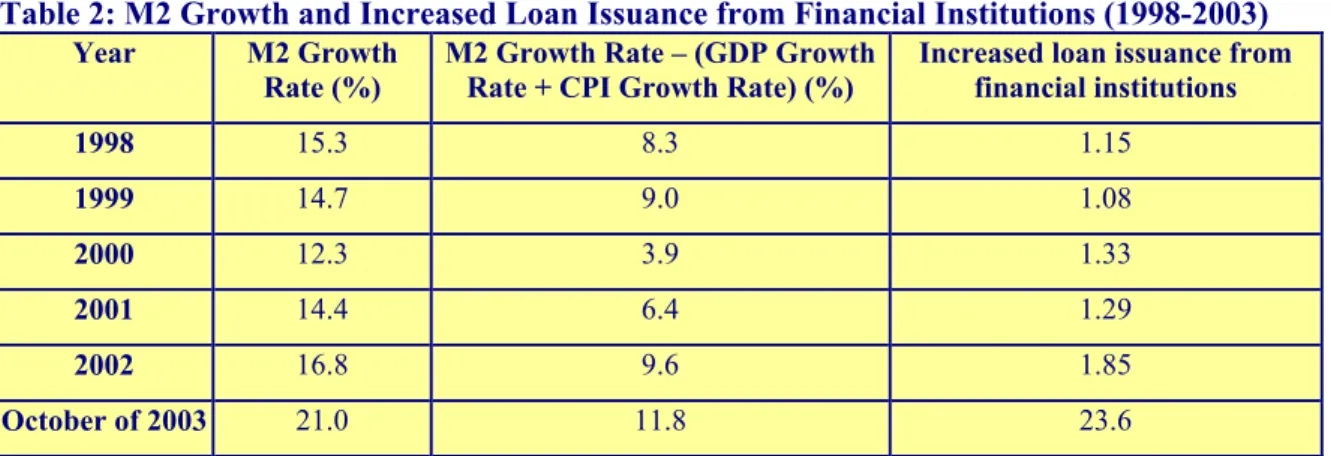
Since the beginning of 2003, outstanding credit in China has increased rapidly. Since May, the M2 (broad money) growth rate has been above 20%; in the first half of 2003, the amount of loans was already close to the level of 2002’s figure for the whole year. At the end of October, the M2 balance amounted to RMB 21.45 trillion, an increase of 21% yoy, whereas the M1 balance (narrow money) amounted to RMB 8.03 trillion, an increase of 19.6% yoy. In contrast, the average M2 growth during 1998-2002 was 14.7%. In addition, at the end of October, the outstanding balance of domestic and foreign currency loans from financial institutions amounted to RMB 16.73 trillion, an increase of RMB 2.75 trillion or 19.3%, compared with the end of 2002. In contrast, the average loan issuance from financial institutions during 1998-2002 only amounted to RMB 1.34 trillion. Furthermore, the M2 growth rate is higher than the sum of growth rates of GDP and CPI, by 7.4% during 1998-2002 and 11.8% at the end of October of 2003. (See Table 2)
Table 2: M2 Growth and Increased Loan Issuance from Financial Institutions (1998-2003)
Year M2 Growth
Rate (%) M2 Growth Rate – (GDP Growth Rate + CPI Growth Rate) (%) Increased loan issuance from financial institutions
1998 15.3 8.3 1.15 1999 14.7 9.0 1.08 2000 12.3 3.9 1.33 2001 14.4 6.4 1.29 2002 16.8 9.6 1.85 October of 2003 21.0 11.8 23.6
Source: Yifen Tao, “The China Economic Analysis: Banking and Finance” [in Chinese], manuscript, pp. 4-5.
In its Monetary Policy Report for the 3rd quarter of 2003, the PBoC emphasized the need to take measures to deal with the dramatic credit expansion. The PBOC asserted, “Taking no action would encourage low-level repeated construction, aggravate the structural contradiction, increase potential systemic financial risks, and cause adverse effects on economic sustainable development.”14 In order to reduce financial risks, China raised the
deposit-reserve ratio by 1% on September 21, from 6% to 7%, and froze excess reserves of RMB 150 billion of commercial banks.15
The M2 growth rate dropped from 21.6%, at the end of August, to 20.7%, at the end of September, and went up to 21% at the end of October. That is to say, raising the
14 Monetary Policy Report, p. 1. 15 Monetary Policy Report, p. 10.
reserve ratio by 1% cannot dramatically slow down the structural contradiction and the expansion of systemic financial risks. However, Beijing seems unwilling to continue to raise the deposit-reserve ratio, relying primarily on open market operations by the central bank to control the rate of domestic credit expansion. In Monetary Policy Report, the PBoC predicted that the M2 growth rate in 2003 would go up to 20%, nearly the same figure as that of September.16
In regards to non-performing loans (NPL) on the books of banks, the PBoC indicated, “The balance of non-performing loans dropped slowly, whereas the amount of loss was still increasing.”17 This suggests that the reduction in NPLs is less effective. However, the China Banking Regulatory Commission (CBRC), established this April, announced that by the end of September of 2003, the absolute balance of the NPLs classified in five-category risk-based asset of wholly state-owned commercial banks (four state-owned banks) dropped by RMB 88.876 billion, compared with the beginning of the year. Further, the NPL rate dropped by 4.83 percentage points, compared with the beginning of the year.18 In the first three quarters, NPL rate in China were reduced by 4.83%, which seems to demonstrate the great improvement of NPLs in China. Why did these two official organizations have such contradictory explanations?
The balance of NPLs amounted to RMB 1,988 billion, a decrease of RMB 88.88 billion compared with the beginning of 2003.19 In addition, the balance of total loans of four state-owned banks increased from RMB 8021.72 billion in the beginning of 2003 to RMB 9,289.72 billion at the end of the third quarter, 2003. Based on these figures, we can infer that in the first three quarters of 2003, the decrease of NPL rate by 4-5% did not result from the significant decrease of NPLs by state-owned banks. The NPLs were only reduced by RMB 88.88 billion in the first three quarters of 2003. Instead, the expansion of the total amount of loans by state-owned banks contributed to the decreasing rate of NPLs. During the first three quarters, the loans of state-owned banks increased by RMB 1,268 billion.
Secondly, in recent years, the medium and long-term credit business of commercial banks, including infrastructure loans and personal housing loans, increased rapidly. At the end of the third quarter of 2003, medium and long-term loans accounted for 39% of all loans outstanding by financial institutions, an increase of 18% compared with 1997; in regards to increment, in the first three quarters, the medium and long-term loans accounted for 46% of various newly increased loans. In particular, all kinds of real estates loans, including housing development loans and personal housing loans, increased by RMB 426.4 billion, accounting for 37% of the total increase in medium and long-term loans. Therefore, that the medium and long-term loans listed above are quality assets in accordance with current categories is one of the important factors resulting in the decreasing amount of NPLs and the decreased rate, but the problem of NPLs has not been solved yet. Once the economic bubble, especially in the real estate section, bursts, the financial system will be severely impacted, and NPLs will increase sharply.
Therefore, the emphasis of the PBoC on “the systemic credit risks,” “the slowly decreasing non-performing loans,” and “the difficult task of dissolving financial risks”20 did
16 Monetary Policy Report, p. 39. 17 Monetary Policy Report, p. 5.
18 China Banking Regulatory Commission, “Enhancement of Monitoring the Non-Performing Loan of State-owned Banks by the China Banking Regulatory Commission” [in Chinese], October 31, 2003.
19 Shuangning Tang, “Acceleration of Bank Reforms in China in Response to the Accession of WTO” [in Chinese], China Banking Regulatory Commission, November 11, 2003, p. 3.
not contradict the statistics of the China Banking Regulatory Commission. The problem of NPLs has not been fundamentally solved; rather, the extensive increase of medium and long-term loans has probably made the problem worse. Financial officials in China have generally recognized an increasing possibility of financial risks in China.21
In an interview in the beginning of November, the PBoC president, Zhou Xiaochuan, clearly pointed out, “China was determined to improve the financial system, dispose of non-performing assets, and increase capital injection into banks.” This is the first time that the Chinese government has proposed fund injection into banks, since 1998 when it injected RMB 270 billion into four major state-owned banks. According to statistics of the State Council, the four major state-owned banks requested a capital injection of about RMB 800 billion from the government. It is only a fraction of what will ultimately be needed for full recapitalization to an 8% capital adequacy ratio.22
Finally, with respect to the disposal of NPLs, until September 30th of 2003, four asset management companies (AMCs) totally disposed of RMB 415.47 billion worth of non-performing assets (not including the debt-to-equity swap), retrieving RMB 86.19 billion of cash, which accounted for 20.75% of the disposed non-performing assets (rate of cash recovery).23 That is, the Ministry of Finance would be ultimately responsible for RMB 329.23 billion of losses incurred by the four AMCs. The largest and internationally most active of the four, Huarong, is currently preparing the auction of an additional RMB 25 billion of distressed assets.
3.Dilemma of RMB Exchange Rate: Fixed Real Exchange Rate or
Revaluation?
Since 1994, China has adopted a de-facto fixed nominal exchange rate of the RMB, which has stood at 8.28 to the US dollar for the past 8 years. Since the beginning of 2002, the dollar depreciated against other major currencies by a wide margin. For example, from January 1 of 2002 to July 9 of 2003, the US dollar depreciated against the Euro by 28%, against the Indonesian Rupiah by 27%, against the Korean Won and Japanese Yen by 12%, and against the Thailand Baht and Singapore dollar by 7%. Based on the de-facto fixed RMB/dollar rate, the RMB depreciated against these currencies by the same margin.
It is generally estimated that the RMB is under-valued by 15-25%.24 Nevertheless, China
decided to maintain the de-facto fixed RMB/US dollar exchange rate so as to protect export competitiveness and avoid further deflation. China’s insistence on the de-facto fixed rate of
21 Dehua Bai, “The People’s Bank of China to Take Seven Measures for Financial Stability,” (in Chinese),
Gongshang Shibao [Business Times], October 16, 2003.
22 Ruiyun Han, “RMB 800 billion of Fund Injection by Zhou Xiaochuan?”(in Chinese), Renmin Ribao [People’s Daily], November 4, 2003. James Kynge and Richard Mcgregor, “China Set to Agree Plan to Recapitalise Big Banks,” Financial Times, November 24, 2003, p. 6.
23China Banking Regulatory Commission, “Financial Property Management Companies Disposed Non-Performing Assets with Multiple Approaches” [in Chinese], October 27, 2003.
24 Jianguo Qi, Vice Director of Quantitative Economy & Technology Economy Institute at Chinese Academy of Social Sciences, estimated that the RMB was only undervalued by 7% and the RMB/dollar rate would go up to 7.7 within a year. Please see Qi’s comment on the draft of the paper on November 19, 2003. Other estimations include: Hong Liang, “Chinese Renminbi: Whose Problem Is It?” Economic Flash, Goldman Sachs, September 29, 2003. Gene Hsin Chang, “China Should Be Prepared for the Challenge of RMB Revaluation,”
China Economic Analysis Working Paper No. 5, Cross-Strait Interflow Prospect Foundation, October 2003.
Morris Goldstein, “China’s Exchange Rate Regime,” Testimony at the US House of Representatives, Washington, DC, October 1, 2003.
the RMB has created an increasing imbalance between the exchange rate, domestic interest rates, and prices, leading to difficulties for the Chinese government in conducting macro economic policy.
First of all, in spite of the insistence on the de-facto fixed RMB/US dollar exchange rate by the Chinese government, the general expectation of RMB appreciation in the market resulted in the inflow of speculative hot money and dramatic increasing foreign exchange reserves. Foreign exchange reserves totaled US$ 401 billion at the end of October, an increase of US$ 114.6 billion (40%) compared to the end of 2002, and US$ 188.8 billion (89%) compared to the end of 2001. The main sources of the rapidly increasing foreign exchange reserves are: (1) China’s current account surplus, (2) foreign direct investment, and (3) speculative hot money inflows. During the first ten months of 2003, foreign direct investment amounted to US$ 43.6 billion, and the current account surplus amounted to US$ 14.9 billion. Thus, speculative hot money inflows may be as high as US$ 56 billion. (=114.6-43.6-14.9)
To maintain the de-facto fixed real exchange rate, the Chinese government must purchase large amounts of excess foreign exchange offered in the market, resulting in the dramatic increase of money supply. Since May of 2003, the M2 (broad money) growth has been above 20%. At the end of October, the M2 balance amounted to RMB 21.45 trillion, an increase of 21% yoy.
Since the beginning of 2002, prices of production materials in China have been rising, because of the rapid investment growth and the strong demand of exports. This will also contribute- with a time lag- to an upward pressure on other domestic prices. From January 2002 to August 2003, the price of production materials increased by 16%, which generated upward pressure on the overall price level. Affected by the rising price of production materials, the CPI in China increased from -1.3% in April 2002 to 1.8% in October and 3% in November 2003. The CPI increased by 4.3% during one and half year.
In order to keep prices stable and prevent an economic bubble (especially in real estate), the Chinese government, on September 21, raised the deposit-reserve ratio by 1% (from 6% to 7%). This, combined with extremely active central bank open market operations to mop up excess liquidity, resulted in an increase in short-term interest rates. Rising domestic interest rates will invite more speculative capital inflows and thus increase the pressure for action on the exchange rate. Rising interest rates will also tend to reduce consumption and investment growth, which may have an adverse impact on economic growth in the months ahead. Therefore, raising interest rates is not a feasible option for China to solve the imbalance of the exchange rate.
To reduce the pressure for RMB appreciation, in August and September China has recently adopted a number of liberalization measures affecting both current and capital accounts transactions. However, large FDI and speculative hot money inflows resulted in the continuous expansion of foreign exchange reserves. From June to August 2003, the foreign exchange reserves increased by US$ 8.2 billion per month on average; but the foreign exchange reserves increased as much as US$ 19.2 billion in September and US$ 17.1 billion in October.
In particular, Chinese and foreign-invested enterprises have borrowed large amounts of short-term debts denominated in US dollar, looking to avoid risks and conduct speculation on the exchange rate. At the end of June 2003, China’s external debt amounted to US$ 182.6 billion, an increase of 8.3% compared to the end of 2002. Medium and long-term external debt constituted 65% of the external debt, whereas short-term external debt constituted 35%.
However, 80% of the external debt increase during the first half of 2003 was short-term. The short-term external debt increased by 30% in July, and 35% in August.
Hot money inflows and short-term external debt increases will entail risks for economic development in China. On the one hand, according to the experience of other countries, a large proportion of short-term external capital entering China may be used for real estate development, possibly resulting in a dangerous economic bubble. On the other hand, if the percentage of short-term external debt in total external debt continues to rise, monetary system risks will also increase, especially given the high NPL ratio in the banking system.25
Although China raised the deposit reserve ration by 1% on September 21, but the currency issue continued to increase because of the generous foreign exchange reserves. The M2 balance increased by 21.6% at the end of August and increased by 20.7% at the end of September after the deposit reserve ratio was raised on September 21. At the end of October, the M2 balance went up to 21% again, increasing the imbalance of the internal structure of Chinese economy.
Since June of 2003, the Chinese government has reiterated constantly that the RMB exchange rate would remain stable. However, the expectation of RMB appreciation has not reduced; instead, the speculative psychology seems to have intensified. This is for example evident from the price trend of non-delivery forward contracts (NDF) of the RMB. By mid-June of 2003, the discount of one-year RMB NDF was less than 0.1. That implies that RMB is expected to appreciate to 8.18 to the US$ within a year; the expected range of appreciation is around 1.2%. From mid-June to mid-September, the discount of one-year RMB NDF contracts is between 0.1 and 0.1, which implies that the expected range of RMB appreciation widened to 1.2-2.4%.
Since mid-September, the expectation of RMB appreciation in the market has intensified, although the Chinese government firmly held to the view that the RMB/US$ exchange rate should be kept stable while liberalization measures on current and capital account transactions aimed at balancing the external accounts are being introduced. On September 5, the discount of one-year RMB NDF contracts was 0.1745, increasing to 0,265 on September 23, 0.4572 on October 8, 0.3775 on October 23, and 0.366 on November 19. That is to say, international investors expect that RMB/US$ exchange rate will appreciate to 7.8-7.9 or by 4.5-5.5% within a year.
On September 21, China raised the deposit reserve ratio by 1% in order to reduce the risk of inflation, increasing the upward pressure on interest rates. The difficulty in the sales of Chinese treasury bonds reveals investor worries about the possibility of rising interest rates. On September 15, the Chinese government issued RMB 24 billion of treasury bonds, but the market response was surprisingly cold. Only two thirds of the bonds were subscribed, and most of them were bought by the distributors appointed by the government. On September 18, the Chinese Ministry of Finance even canceled another issue of RMB 26 billion of treasury bonds. Meanwhile, investors show little interest in the RMB 200 billion of treasury bonds to be issued in the fourth quarter.
For the past six years, China has continuously implemented a fiscal expansion policy, resulting in a huge volume of fiscal deficits, which must be made up by issuing treasury bonds. China issued RMB 592.9 billion of treasury bonds altogether in 2002, and Chinese officials estimate that they will issue RMB 637.6 billion in 2003. However, the increase of
25 Shuangning Tang, “Acceleration of Bank Reforms in China in Response to the Accession of WTO” [in Chinese], China Banking Regulatory Commission, November 11, 2003, p. 3.
short-term interest rates and expectations of further increases will cause the price of treasury bonds to fall. Since this increases the cost of borrowing, the government may have to reduce or discontinue its fiscal stimulus policies, which are still imperative for expanding domestic demand.
What will happen to the Chinese economy if China appreciates its currency by 10-15%? The Chinese government has two major concerns: deflation and unemployment. Nevertheless, China’s trade is primarily based on processing trade; therefore, the impact of an RMB appreciation on deflation, or China’s global competitiveness in world trade, will not completely reflect the range of nominal appreciation. In 2002, 55.3% of China’s exports were processing exports, whereas the processing imports accounted for 41.4%. An RMB appreciation will have little impact on domestic prices, because almost half of China’s imports are raw materials and semi-finished components, which will re-export after processing. In fact, an appropriate RMB appreciation will alleviate the pressure of inflation, resulting from excess currency issue. Meanwhile, negative effects of the RMB appreciation on China’s competitiveness in exports will be offset by the reduced cost of imports.
Although China has accelerated current and capital account liberalization measures, the inflow of hot money, the massive foreign reserves, and the imbalance of the economy have not yet been alleviated. In addition, major industrial countries, including the U.S., Japan, and Europe, have strongly requested that China allow the RMB to appreciate. The Chinese government is seriously deliberating on the most appropriate way to appreciate the RMB. In an interview on October 19, the PBoC president, Zhou Xiaochuan, pointed out, China is considering expanding the floating range of the RMB exchange rate from 1% to 5% and improving the current exchange rate system. For example, Zhou added, the RMB is to peg to a basket of currencies, instead of the greenback only, and this may also result in RMB appreciation.26
Nevertheless, a more practical way to solve the exchange rate dilemma would be an up-front RMB appreciation of 10-15%, a widening of the floating range from 1% to 5-7%, and a system change from a de-facto fixed U.S. dollar peg to a system linking the RMB to a basket of currencies.27 If China does not allow for an appropriate RMB appreciation, an inflow of hot money and the dramatic expansion of foreign reserves may continue, resulting in the growing imbalances between the exchange rate, interest rates, and prices, making macro economic management increasingly difficult. Meanwhile, China has to convince market participants with an up-front RMB appreciation; minor or tardy exchange rate adjustment may attract more speculative capital inflows aggravating domestic economic imbalances and increasing pressures for RMB appreciation.
4.Assessment and Prospects
In the first three quarters of 2003, China experienced a rapidly growing economy, with a growth rate of 8.5%, spurred by the expansion of investment and exports. In the first three quarters, the increase of total investment in fixed assets increased to 30.5%, and exports increased by 32.3% yoy. In particular, most of the investment was focused on industrial sectors, and was led by local governments. Consumption increased by 8.6% yoy in the first
26 “Chinese Central Bank Governor on Exchange Rate of RMB,” Xinhua General News Service, October 19, 2003.
27 The suggestion is quite similar to that of Morris Goldstein and Nicholas Lardy at the Institution for International Economics. Please see Morris Goldstein and Nicholas Lardy, “Two-Stage Currency Reform FOR China,” Asian Wall Street Journal, September 12, 2003.
three quarters. In addition, the income gap between urban and rural areas expanded, whereas unemployment increased gradually.
The dramatic expansion of investment, along with the rapid increase of M2 growth and loans, caused widespread concern about economic overheating. In fact, some indications of overheating have appeared in some parts of the economy, including metal, real estate, automobiles, cement, textile, machinery, and raw materials. In most part of the manufacturing sector, however, China is still facing deflationary pressure due to excess supply. For the time being, the mounting investment has resulted in the rapid expansion of metal, real estate, and automobile sectors, as well as various development zones in different areas. In next few years, the supply in these sectors might exceed the demand, resulting in overproduction, leading to the burst of an economic bubble, particularly in the sector of real estate.28
A more serious problem is that many development projects and investments are dominated by local governments, resulting in low efficiency and hindrance of the development of private enterprises. Aside from the necessary investment in public construction, the government has the lowest efficiency with regard to development. In fact, there are huge amounts of unused private capital, which is the result of investment obstacles that were set forth by the government. For example, private enterprises cannot enter certain economic fields, such as telecommunication, urban infrastructure, finance, education, media, and land management, etc. Further, the implementation of an active fiscal policy enhanced the dominating position of the government in investment, and weakened the development tendencies of private enterprises. Therefore, to maintain the rapid economic growth in China, without causing inflation and imbalance of economic structure, the Chinese government needs to accelerate economic reforms, transform the functionality of the government, promote the development of private enterprises, and improve the consumption of residents.29
In particular, concerning the policy for development of private enterprises, at the 16th National Congress of the Communist Party of China (CPC), the Chinese authority proposed the promotion of the development of a non-public economy, which would grant private enterprises the same treatment in investment, financing, taxation, land use and foreign trade. Protection of private assets was also emphasized at the meeting.30 In October 2003, at the Third Plenary Session of the 16th CPC Central Committee, a decision on issues regarding the improvement of the socialist market economic system [abbreviated as the Decision] was approved. The Decision calls for “vigorously encouraging, supporting, and guiding the development of non-public sectors of the economy.” The Decision emphasizes, “A non-public economy, including individual and private businesses, is the major force to promote [Chinese] social productivity. [The Chinese government must] eliminate systemic obstacles for the development of a non-public economy, by amending relevant regulations and policy.”31
28 Deshui Lee, “Can Chinese Economy Maintain Rapid Growth Steadily in the Long Term?” [in Chinese], National Bureau of Statistics of China, November 9, 2003. “Excess Investment Aggravates Deflation Risks in China,” The Wall Street Journal (Chinese edition), November 12, 2003. Junwei Lian, “Automobile Production in China to Have 20% of Excess” (in Chinese), Gongshang Shibao, November 13, 2003. Lian Junwei, “Excess Metal Production in China to Amount to 1400 billion tons in 2005” (in Chinese), Gongshang Shibao, November 13, 2005.
29 Qi Jianguo’s comment on the draft of this paper, November 19, 2003.
30 Lecture on Learning the Sixteenth National Congress for CCP Members and Cadres [in Chinese], Writing Group (ed.), (Beijing: Xuixi Chubangshe, 2002), pp. 19-28.
31 A Hundred Questions on the Decision of the Third Plenary Session of the 16th CPC Central Committee [in Chinese], Writing Group (ed.), (Beijing: Dangjiang Duwu Chubangshe, 2003), p. 4.
With respect to finance, although the rate of the NPLs classified in five-category risk-based assets of four state-owned banks decreased by 4.83%, it seems too early to say that the state-owned banks in China have made fundamental changes and improved the loan quality. First, the dramatic decrease of the NPL rate primarily resulted from the expansion of the total amount of loans by state-owned banks. Second, the medium and long-term credit business of commercial banks, including infrastructure and personal housing loans, increased rapidly; these loans are healthy assets in accordance with current categories. Once the economic bubble, especially in the real estate sector, bursts, the financial system will be severely impacted, and NPLs will increase sharply.
If the Chinese government were to adopt an overall contraction policy to avoid financial risks, the problem of deflation would become worse, and healthy investments would be inhibited. That would impact the overall economic growth and aggravate social instability. Therefore, the Chinese government adopted a selective contraction policy --- to limit real estate loans, for example, to cool down the overheated development in the industry. However, the selective contraction policy did not have significant effects so far in controlling overheating. After the contraction measures in real estate loans in June and the raised deposit reserve ratio by 1% in September, the growth rate of real estate development and investment only dropped from 34% yoy for the first 6 months to 32.8% yoy for the first three quarters.
The exchange rate dilemma further aggravated the imbalance of the internal structure of the Chinese economy, leading to difficulties for the Chinese government in conducting macro economic policy. While the RMB is under-valued by 15-25%, the Chinese authority insists on maintaining the de-facto fixed RMB/US dollar exchange rate, leading to the strong expectation of RMB appreciation in the market and hot money inflows. To maintain a fixed exchange rate, the Chinese government has to buy excess foreign exchange offered in the market. This has resulted in a dramatic increase of the money supply, leading to further expansion of loans and investment. The Government’s selective contraction approach to redress overheating has not solved the problem. A more generalized anti-overheating policy may be needed soon. This could take the form of domestic interest rate increases and a further upward adjustment of deposit reserve requirements.32
It is generally expected that economic growth in 2003 will be appreciably higher than in 2002, but that 2004 will see a reduction in the growth rate. According to the PBoC, China’s growth rate will be 8.5% in 2003 and 7% in 2004.33 The Chinese Academy of Social Sciences estimates that the economic growth would go up to 8.2% in 2003 and 8% in 2004.34 The International Monetary Fund estimates an economic growth rate of 8.5% in 2003 and 8% in 2004.35 The Deutsche Bank forecasts that the economic growth rate will be 8.7% in 2003 and 8.5% in 2004.36
In spite of the optimistic estimations for economic growth in 2004 by economic research institutions, the Chinese government needs to handle the financial risks resulting from the dramatic expansion of investment, loans, and currency issue with caution. Otherwise, once the
32 Political Bureau of the Central Committee of the CPC has decided to adjust the active fiscal policy at the meeting on November 24, 2003. Yunxiang Zhang, “Chinese Academy of Social Sciences Says the Necessity to Adjust the Active Fiscal Policy in China” (in Chinese), Jingji Ribao, October 20, 2003, p. 11.
33 Monetary Policy Report, p. 39.
34 Yunxiang Zhang, “Chinese Academy of Social Sciences Says the Necessity to Adjust the Active Fiscal Policy in China” (in Chinese), Jingji Ribao, October 20, 2003, p. 11.
35 International Monetary Fund, “IMF Concludes 2003 Article IV Consultation with the People’s Republic of China,” Public Information Notice No. 03/136, November 18, 2003.
economic bubble bursts and leads to a financial crisis, China will need a considerable amount of time and efforts to recover from the impact.
There are several measures that should be taken to reduce financial risk. First, China must implement fundamental reforms in financial and investment systems, including the fiscal and state-owned enterprise system, in order to make investments more efficient. Financial reforms are never easy, but they are essential to solving many problems in China. China should be determined to implement these reforms as soon as possible, or the costs associated with them will only increase over time.
On December 10, 2003, the PBoC has sharply raised the maximum interest rates that banks can charge for commercial loans from January 1, 2004. The PBoC would allow banks and urban credit co-operatives to widen the floating margins on lending rates from 30% above a base rate set by the central bank to 70% and allow rural credit co-operatives to 100% above the base rate. The floor lending rates (presently 10 percent below the base rate) remain unchanged. This reform will allow banks to price loans more effectively according to credit risks, and improve the access of small and medium enterprises (particularly private enterprises) to bank lending.37
Furthermore, the Chinese government must seriously consider an appropriate appreciation of the RMB, in order to alleviate the expectation of RMB appreciation in the market and the pressure of structural imbalance at home. An appropriate RMB appreciation can prevent the continuous inflow of hot money, lift the pressures of an excess money supply and the increase of interest rates, reduce NPLs resulting from the economic bubble, as well as reduce financial risks of excess short-term external debts.