國 立 交 通 大 學
材 料 科 學 與 工 程 研 究 所
博 士 論 文
利用微波加熱法純化奈米碳管與在碳管
上合成白金觸媒之探討
Investigation of Purification of Carbon Nanotubes
and Synthesis of Pt Catalysts on Carbon Nanotubes
by Using Microwave Heating Method
研 究 生: 陳 建 銘
指 導 教 授: 陳 家 富 博 士
呂 志 鵬 博 士
利用微波加熱法純化奈米碳管與在碳管上
合成白金觸媒之探討
Investigation of Purification of Carbon Nanotubes and
Synthesis of Pt Catalysts on Carbon Nanotubes by Using
Microwave Heating Method
研 究 生: 陳 建 銘
Student:
Chieng-ming
Chen
指導教授: 陳 家 富 博 士 Advisor: Dr. Chia-Fu Chen
呂 志 鵬 博 士 and Dr. Jihperng Leu
國 立 交 通 大 學
材 料 科 學 與 工 程 研 究 所
論 文 初 稿
A Thesis
Submitted to Institute of Materials Science and Engineering
College of Engineering
National Chiao Tung University
In Partial Fulfillment of the Requirements
For the Degree of Doctor of Philosophy
In Materials Science and Engineering
January 2008
Hsinchu, Taiwan, Republic of China
利用微波加熱法純化奈米碳管與在碳管上
合成白金觸媒之探討
研究生:陳建銘 指導教授:陳家富、呂志鵬 博士
國立交通大學
材料科學與工程研究所
摘 要
奈米碳管具有獨特且優異的化學及物理特性,深具潛力應用於各個領 域,例如:場發射顯示器、儲氫材料、化學感測器、奈米電子元件與複合材 料等。合成奈米碳管主要的方法有:雷射蒸發法、電弧法與化學氣相沉積法, 在這些方法中,過渡金屬(Fe, Co, Ni)常用來作為奈米碳管之成長之觸媒,觸媒 存在奈米碳管中會降低奈米碳管的應用特性,本研究論文利用微波輔助酸處 理製程去除多層管壁奈米碳管中之金屬觸媒。多層管壁奈米碳管試樣先經過 超音波震盪分散後,再以微波輔助消化系統酸處理去除金屬觸媒,研究結果 顯示,以熱重分析儀量測純化前後奈米碳管中殘存之金屬觸媒量。在 5M 硝酸 中,微波消化15 分鐘,金屬觸媒含量可由 10.39 wt%快速減低至 1.52 wt%。 利用穿透式電子顯微鏡來觀察純化前後碳管的結構與金屬觸媒,而拉曼光譜 儀則探討奈米碳管之鍵結特性。結果顯示,硝酸可以快速吸收微波之熱與能, 可以避免因碳管長時間浸泡於酸溶液中,而對管壁所造成的破壞,進而達到 快速純化奈米碳管。另外,本論文研究並探討使用微波聚醇法有效且快速被覆 白金粒子於奈米碳管上。結果顯示,添加分散劑與保護劑使白金粒子均勻有效被 覆於奈米碳管表面,先對奈米碳管進行純化步驟,再利用微波聚醇法以使具有氯 鉑酸之乙二醇溶液內之白金觸媒粒子被覆在奈米碳管上。為了快速形成具有高密 度 且 均 勻 被 覆 白 金 粒 子 的 奈 米 碳 管 , 添 加 適 當 聚 乙 烯 吡 咯 烷 酮 (Polyvinylpyrrolidone, PVP)與十二烷基硫酸鈉(Sodium Dodecyl Sulfate, SDS)當界面活性劑與分散劑,結果顯示微波聚醇法所合成之白金粒子約4.1nm,其粒徑分 佈集中且均勻分散於奈米碳管表面。添加 SDS 可達到有效分散奈米碳管表面白 金粒子,而不會產生聚集現象。微波聚醇法所需反應時間約1.5min,白金被覆量 約54 wt%,所以微波聚醇法添加 SDS、PVP 可有效且快速均勻被覆白金粒子於 奈米碳管上。
Investigation of Purification of Carbon Nanotubes and
Synthesis of Pt Catalysts on Carbon Nanotubes by Using
Microwave Heating Method
Student: Chieng-Ming Chen Advisor: Dr. Chia-Fu Chen
and Dr. Jihperng Leu
Institute of Materials Science and Engineering
National Chiao Tung University
Abstract
Carbon nanotubes (CNTs) have excellent and unique performances and versatile applications, such as field emission display, hydrogen storage, chemical sensor, nano-electronic devices and composite materials. High-quality and well-aligned carbon nanotubes are essential to the potential applications. The synthesis methods of CNTs are arc-discharge, laser vaporization, and chemical vapor deposition. Transition metal (Fe, Co, Ni) are known to be catalysts for vapor grown CNTs synthesis. CNTs may found their limited applications as they contain metal catalysts in tubes. In this thesis, microwave-assisted acidic treatment process is used to purify multi-walled carbon nanotubes. Ultrasonic shaking was first applied to disperse CNTs samples. A acidic treatment with microwave-assisted digestion system was then used to dissolve metal catalysts. The result indicated that the amounts of catalyst metals reduced from 10.39 wt% to 1.52 wt% within 15 min of microwave digestion acid treatment with 5 M HNO3. A thermo-gravimetric analysis (TGA) was used to estimate the amount of
purification is characterized and TEM. The bonding characteristics of CNTs are studied by using a Raman spectrometer. That HNO3 can rapidly absorb microwave
heat and energy to shorten the acid treatment time prevents the structures of CNTs from destruction. A high-yield of multi-walled carbon nanotubes with high purity is then obtained.
In the second part of the thesis, CNTs are first purified by microwave digestion and Pt nanoparticles in ethylene glycol solution with Pt precursor (H2PtCl6) are coated
on CNTs by microwave polyol process. In order to briskly synthesize uniform Pt nanoparticles of high density dispersed on CNTs, poly(vinylpyrrolidone) (PVP) and sodium dodecyl sulfate (SDS) are adequately added in mixture reactants to act as the protective reagents and dispersants. The results show that Pt nanoparticles with narrow distribution and suitable diameter of about 4.1 nm were highly dispersed and loaded on the surface of CNTs by microwave digestion method. SDS was added to increase the dispersion of Pt on CNTs and to reduce the aggregation phenomenon. The microwave polyol processing duration was below 1.5min and the loading amount of Pt on CNTs was about 52 wt%. Pt nanoparticles can be uniformly and rapidly dispersed on CNTs by microwave polyol process with the addition of SDS and PVP.
致 謝
本論文能順利完成,要感謝的人實在太多了,首先感謝我的指導教授陳家富 老師,陳老師在論文研究上的指導與鼓勵,使得這篇論文能順利完成。更重要的 是陳老師對學生的照顧與愛護,讓我得以順利完成學業,開拓未來更寬廣的道 路。感謝博士論文審查委員汪大永老師、薛富盛老師、張立老師、呂志鵬老師、 陳密老師及許鉦宗老師對於本論文的指導與寶貴的建議,在此由衷的表示感謝。 接著要感謝如同家人們的實驗室同仁,感謝陳密學姐、林建良學長、蔡佳倫 學長、施士塵學長、陳建仲學長、彭若慈學姐、吳良科學長等在研究上提供的建 議與協助。感謝羅鴻鈞、許智勛、徐振航、王滋銘、曾靜怡同學以及施騰凱、劉 厥揚、洪淙琦、王瑞豪學弟與李依璇學妹等實驗室的學弟妹們,不僅在研究上熱 情相助,在校園生活中也留下許多寶貴的回憶與歡熱。另外感謝林智偉、蘇俊瑋、 胡晟民、林高照等由大學部至今的同學,感謝你們在實驗上的幫助。並感謝明新 科技大學化學工程系的彭永旺、游宏偉學弟等在研究上的努力。 同時也感謝國科會在經費上的補助,國家奈米元件實驗室及交大奈米科技中 心在分析設備上的支持。以及明新科技大學陳密老師允借的實驗設備,讓本論文 能夠順利完成。 最後,我要感謝我的家人及親戚們在這段時間所給予的支持與鼓勵,感謝兄 長陳木豪無私的付出支撐經濟重擔讓我無後顧之憂。僅以此論文獻給我最愛的親 人與在天國的母親。Contents
Abstract (Chinese)………Ⅰ Abstract (English)….………Ⅱ Acknowledgement………..………...Ⅴ Contents….………...………Ⅵ Table Captions…………..……….………....Ⅸ Figure Captions………..………...Ⅹ Chapter 1 Introduction ...1 1.1 Carbon nanotubes...11.1.1 Structure and properties of carbon nanotubes...2
1.1.1.1 Structure of carbon nanotubes ...2
1.1.1.2 Electronic properties of carbon nanotubes...4
1.1.1.3 Mechanical properties carbon nanotubes...7
1.1.2 Applications of carbon nanotubes...8
1.1.2.1 Energy storage ...8
1.1.2.2 Hydrogen storage ...9
1.1.2.3 Lithium intercalation...9
1.1.2.4 Electrochemical supercapacitors...10
1.1.2.5 Field emitting devices ...10
1.1.2.6 Transistors...11
1.1.2.7 Nanoprobes and sensors...11
1.1.2.8 Composite materials...12
1.1.2.9 Templates ...14
1.1.3 Carbon nanotube synthesis ...14
1.1.3.1 Arc discharge ...14
1.1.3.2 Laser ablation...15
1.1.3.3 Catalytic chemical vapor deposition (CVD)...16
1.1.3.4 Catalytic growth mechanisms of carbon nanotubes...17
1.2 Fuel cell...18
1.2.1 Classification of fuel cells...19
1.2.1.1 Polymer electrolyte membrane fuel cell ...20
1.2.1.2 Phosphoric acid fuel cell...21
1.2.1.3 Alkaline fuel cell ...21
1.2.1.4 Molten carbonate fuel cell ...22
1.2.2 Potential of direct methanol fuel cell ...24
1.3 Microwave Chemistry...27
1.3.1 Microwave-assisted synthesis of metallic nanostructures ...27
1.3.2 Possible effects of MW heating ...29
1.3.2.1 Thermal effects ...29
1.3.2.2 Effects of hot spots and hot surfaces...30
1.3.2.3 Superheating ...30
1.3.2.4 Non-thermal effects ...30
1.4 Motivation of this thesis...30
Chapter 2 Literature Review...34
2.1 Purification of carbon nanotubes ...34
2.1.1 Thermal oxidation...34
2.1.2 Microfiltration and ultrasonically assisted filtration...34
2.1.3 Acid treatment...35
2.1.4 Thermal oxidation combined with acid treatment ...36
2.2 Fundamental and structure of DMFC ...37
2.2.1 The Proton Exchange Membrane (PEM)...37
2.2.2 Electrodes Structure of DMFC ...40
2.2.3 Anode structure and principle of DMFC ...41
2.2.4 Cathode structure and principle of DMFC...42
2.2.5 Limits of DMFC ...46
Chapter 3 Experimental Details...50
3.1 Experiment Procedures ...50
3.1.1 Experiment flow chart of purification process...50
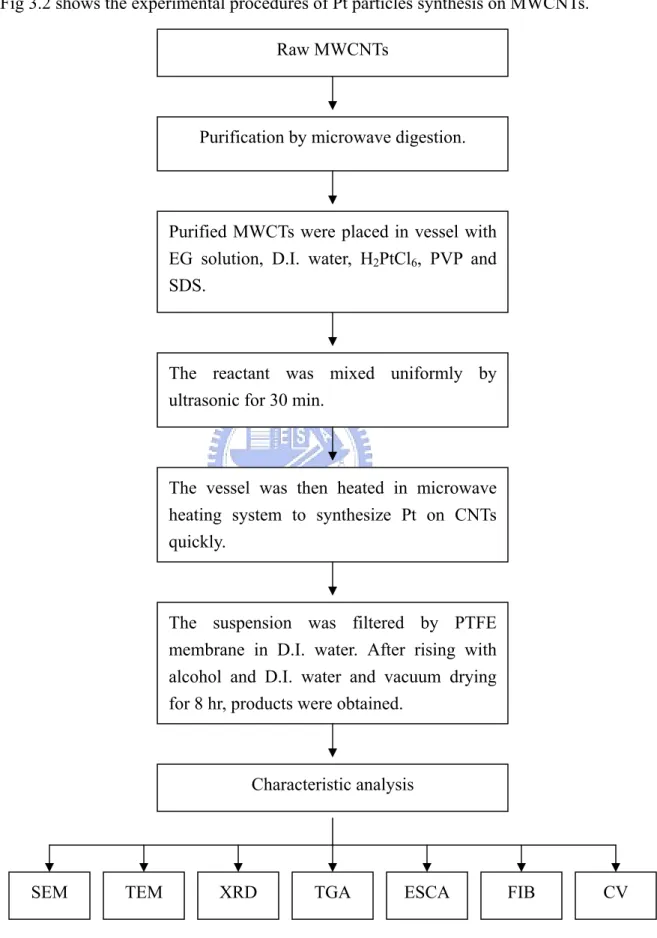
3.1.2 Experiment flow chart of Pt-synthesis process...51
3.2 Experiment equipments ...52
3.2.1 Microwave system ...52
3.3 Analysis instruments ...53
3.3.1 Thermogravimetric Analyzer (TGA) ...53
3.3.2 Scanning Electron Microscopy (SEM) ...54
3.3.3 Transmission Electron Microscopy (TEM) ...54
3.3.4 Raman Spectroscopy...55
3.3.5 Energy Dispersive X-ray Analysis (EDX)...56
3.3.6 X-ray Diffraction (XRD) ...56
3.3.7 Cyclic Voltammetry (CV) ...57
Chapter 4 Purification of MWCNTs Using Microwave Heating Method ...59
4.1 Purification of MWCNTs Synthesized by ECR-CVD...59
4.1.2 Characterization of the Purified MWCNTs and Discussions ...59
4.1.3 Summary...65
4.2 The effects of different experiment conditions on purification of MWCNTs66 4.2.1 Experiment Conditions and Procedures...66
4.2.2 Characterizations of MWCNTs of various experiment conditions and discussions ...67
4.2.3 Summary...76
4.3 Purification efficiency of multi-walled carbon nanotubes synthesized by thermal chemical vapor deposition ...77
4.3.1 Experiment condition and procedures ...77
4.3.2 Characterizations and discussion ...77
4.3.3 Summary...83
4.4 Reaction Model of Microwave-Assisted Purification of MWCNTS...84
4.4.1 TEM analysis and tube opening...84
4.4.2 TGA analysis and purification efficiency ...87
4.4.3 Microwave assisted technique and reaction model...88
4.4.4 Summary...93
Chapter 5 Coating Pt Particles on CNTs as DMFC Electrode Using Microwave Heating Method ...95
5.1 Experiment Procedures to Synthesize Pt Catalyst on MWCNTs...95
5.2 The effects of solutions on Pt particles synthesis ...96
5.3 The effect of PVP molecular weight on particle size and dispersion...107
5.4 The Effect of SDS on Pt particle dispersion ...110
5.5 The effect of temperature on loading amount of Pt ...119
5.6 The effect of time on Pt loading amount...128
5.7 Electrochemical properties of Pt/MWCNTs electrode ...140
5.8 Conclusions of Microwave-assisted synthesis Pt/MWCNTs electrode ...142
Chapter 6 Conclusions ...143
Table Captions
Table 1-1 Isomers of carbon ... 2 Table 1-2 Mechanical properties of CNTs compared with other Materials... 8 Table 1-3 Comparisons of various fuel cells... 24 Table 1-4 Physical parameters of typical solvents used for microwave heating ... 29 Table 4-1 Experiment condition of nitric acid concentration, soniction time, and
microwave-assisted purification time ... 66 Table 5-1 Summary of the experiment conditions ... 96
Figure Captions
Fig. 1-1 Isomers of carbon: diamond, fullerene, graphite, and CNTs ... 1 Fig. 1-2 Models of different CNTs structures ... 3 Fig. 1-3 TEM pictures of the ends of (a) a SWCNT, (b) a closed MWCNT, and (c)
an open MWCNT. Each black line corresponds to one graphene sheet viewed edge-on ... 4 Fig. 1-4 Schematic diagram showing how a hexagonal sheet of graphite is rolled to form a CNT... 5 Fig. 1-5 A single semi-conducting nanotube is contacted by two electrodes. The Si
substrate, which is covered by a layer of SiO2 300nm thick, acts as a
back-gate ... 11 Fig. 1-6 Use of a MWNT as AFM tip. VGCF stands for Vapour Grown Carbon
Fibre. At the centre of this fibre the MWNT forms the tip... 12 Fig. 1-7 Schematic illustration of the arc discharge system and TEM micrograph of the grown CNTs ... 15 Fig. 1-8 Schematic illustration of the laser ablation apparatus ... 16 Fig. 1-9 Schematic illustration of the catalytic deposition and TEM micrograph of
the grown CNT ... 17 Fig. 1-10 Schematics of tip-growth and base-growth for carbon filament growth 18 Fig. 1-11 Schematic diagram of a DMFC ... 25 Fig. 2-1 The structure of Nafion... 38 Fig. 2-2 Yeager's three-phase model of Nafion; a fluorocarbon region (A), an
interfacial zone (B) and an ionic cluster region (C) ... 39 Fig. 2-3 Membrane and electrode assembly (MEA) ... 41 Fig. 2-4 Exploded view of a DMFC ... 41
Fig. 2-5 Bridge model of oxygen reduction on Pt (z represents the oxidation state)
... 42
Fig. 2-6 CV of a platinum electrode in 0.5M H2SO4(aq)... 44
Fig. 3-1 Experiment flow charts of purification process... 50
Fig. 3-2 Experiment flow charts of Pt particles synthesis process... 51
Fig. 3-3 The microwave digestion system ... 52
Fig. 3-4 The Q500 Thermogravimetric Analyzer, TA Instruments... 53
Fig. 3-5 Schematic diagram of a TEM... 55
Fig. 3-6 Schematic diagram of Bragg’s law... 57
Fig. 3-7 Schematic diagram of a cyclic voltammetry experiment... 58
Fig. 4-1 shows a low magnification TEM image of raw carbon nanotubes ... 60
Fig. 4-2 shows a low magnification TEM image of MWCNTs after purification by microwave digestion ... 61
Fig 4-3 The TEM image of acid treated MWCNTs... 62
Fig. 4-4(a) TGA graphs of raw samples and purified MWCNTs ... 64
Fig. 4-4(b) TGA graphs of raw samples and purified MWCNTs ... 64
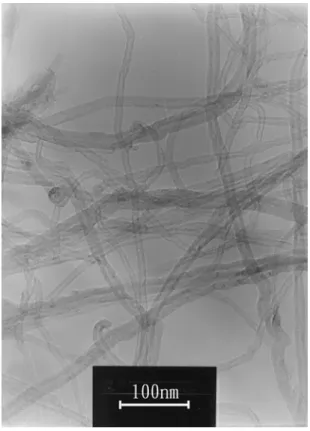
Fig. 4-5 The low magnification TEM image of raw MWCNTs ... 68
Fig. 4-6 The low magnification TEM image of purified MWCNTs... 68
Fig. 4-7 The catalysts embedded in the tip of MWCNTs were removed... 69
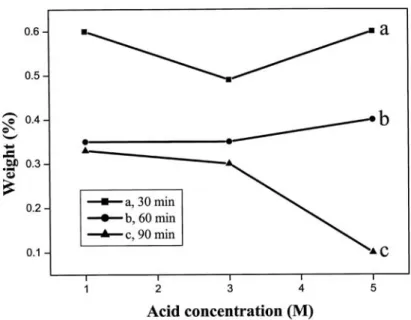
Fig. 4-8 The effect of acid concentration on purification ability for different processing time ... 70
Fig. 4-9 shows the effect of ultra-sonication time on purification efficiency of 5 M nitric acid... 71
Fig. 4-10 shows the result of TGA analysis of (a) raw and (b) purified samples .. 72
Fig. 4-11 The catalyst contents after purification with 5 M acid for various treatment times ... 73
Fig. 4-12 The Raman spectroscopy of raw and purified samples... 74
Fig. 4-13 The TEM image shows that raw sample contains multi-walled carbon nanotubes and catalyst ... 78
Fig. 4-14 The catalysts embedded in the tip were removed ... 78
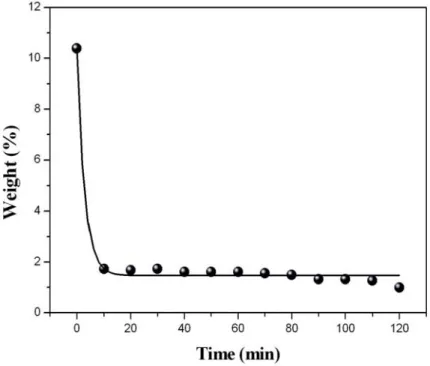
Fig. 4-15 The TGA analysis of (a) raw and (b)120min-purified sample ... 80
Fig. 4-16 The residual catalyst content of different digestion time ranges from 10 to 120 min... 80
Fig. 4-17 The catalyst covered by tens of graphene layer is difficult to remove... 81
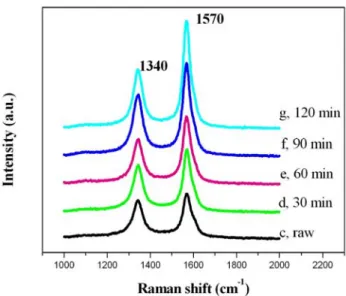
Fig. 4-18 Raman analysis of raw and purified sample for 30, 60, 90, and 120 min treatment... 82
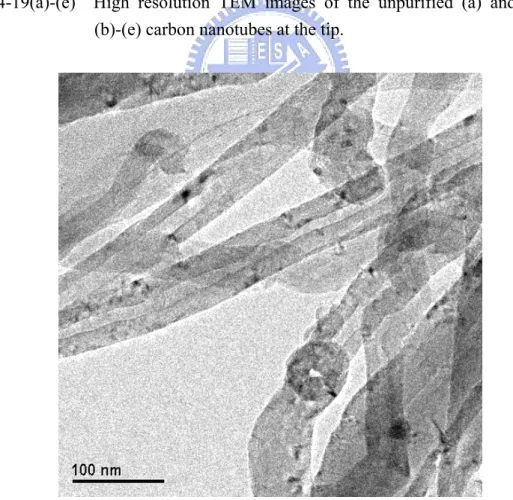
Fig. 4-19(a)-(e) High resolution TEM image of the unpurified (a) and purified (b-e) carbon nanotubes at the tip ... 86
Fig. 4-20 Low magnification TEM image of tubular wall structure of the purified carbon nanotubes ... 86
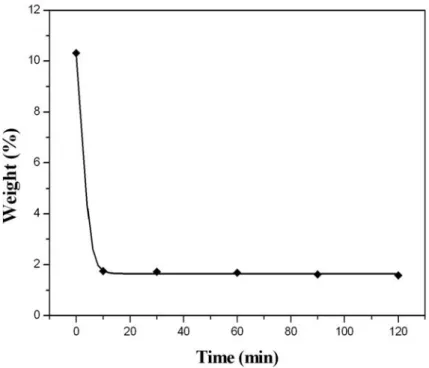
Fig. 4-21 The relationship between the amount of residual catalysts in the CNTs and processing time ... 88
Fig. 4-22(a)-(f) The reaction model of purification assisted by microwave dielectric heating for the CNTs ... 93
Fig. 5-1 The SEM image of sample prepared at 40°C in EG ... 97
Fig. 5-2 The SEM image of sample prepared at 60°C in EG ... 98
Fig. 5-3 The SEM image of sample prepared at 80°C in EG ... 98
Fig. 5-4 The XRD spectrum of sample prepared at 40°C in EG ... 99
Fig. 5-5 The XRD spectrum of sample prepared at 60°C in EG ... 99
Fig. 5-6 The XRD spectrum of sample prepared at 80°C in EG ... 100
Fig. 5-7 The SEM image of sample prepared at 80°C in EG with the addition of D.I. water... 101
Fig. 5-8 The XRD spectrum of sample prepared at 80°C in EG and D.I. water.. 101 Fig. 5-9 The SEM images of Pt catalyst synthesized on MWCNTs at different
temperature in ETOH/water with PVP. (a) 40°C (b) 60°C (c) 80°C... 103 Fig. 5-10 The XRD spectrum of Pt catalyst synthesized on MWCNTs at 40°C in
ETOH/water solution with PVP... 104 Fig. 5-11 The XRD spectrum of Pt catalyst synthesized on MWCNTs at 60°C in
ETOH/water solution with PVP... 104 Fig. 5-12 The XRD spectrum of Pt catalyst synthesized on MWCNTs at 80°C in
ETOH/water solution with PVP... 105 Fig. 5-13 The SEM images of Pt catalyst synthesized on MWCNTs at different
temperature in isopropyl-alcohol. (a) 40°C (b) 60°C (c) 80°C... 106 Fig. 5-14 The SEM images of Pt nanoparticles synthesized on MWCNTs by
heating the solution to 160℃ for 30 min with different molecular weight of PVP (a) PVP MW=8000, (b) 58000 (c) 1300000 ... 109 Fig. 5-15 The XRD spectrum of Pt nanoparticles synthesized on MWCNTs by
heating the solution to 160℃ for 30 min with different molecular weight of PVP...110 Fig. 5-16 The SEM images of Pt nanoparticles synthesized on MWCNTs with
different molecular weight of PVP and the addition of SDS.(a) PVP
MW=8000, (b) 58000 (c) 1300000 ...112 Fig. 5-17 The XRD spectrums of Pt nanoparticles synthesized on MWCNTs with
different molecular weight of PVP and the addition of SDS.(a) PVP
MW=8000, (b) 58000 (c) 1300000 ...113 Fig. 5-18 The TEM images of Pt nanoparticles synthesized on MWCNTs with
different molecular weight of PVP and the addition of SDS.(a) PVP
Fig. 5-19 The TEM images of Pt nanoparticles synthesized on MWCNTs with different molecular weight of PVP and the addition of SDS. (a)
8000:58000=1:1, (b) 58000:1300000=1:1 (c) 1300000:8000=1:1 ...115 Fig. 5-20 The XRD spectrums of Pt nanoparticles synthesized on MWCNTs with
different molecular weight of PVP and the addition of SDS. (a)
8000:58000=1:1, (b) 58000:1300000=1:1 (c) 1300000:8000=1:1 ...116 Fig. 5-21 The TEM images of Pt nanoparticles synthesized on MWCNTs with
different molecular weight of PVP and the addition of SDS. (a)
8000:58000=1:1, (b) 58000:1300000=1:1 (c) 1300000:8000=1:1 ...117 Fig. 5-22 Mechanism between Pt particle, SDS, and PVP...119 Fig. 5-23 The SEM images of Pt particles synthesized on MWCNTs at different
temperature for 30min. (a) 80°C (b) 100°C (c) 120°C ... 121 Fig. 5-23 The SEM images of Pt particles synthesized on MWCNTs at different
temperature for 30min. (d) 140°C (e) 160°C (f) 180°C ... 122 Fig. 5-24 The TEM images of Pt particles synthesized on MWCNTs at different t
temperature for 30min. (a) 80°C (b) 100°C (c) 120°C ... 123 Fig. 5-24 The TEM images of Pt particles synthesized on MWCNTs at different
temperature for 30min. (d) 140°C (e) 160°C (f) 180°C ... 124 Fig. 5-25 The XRD spectrums of Pt particles synthesized on MWCNTs at different
temperature for 30min. (a) 80°C (b) 100°C (c) 120°C ... 125 Fig. 5-25 The XRD spectrums of Pt particles synthesized on MWCNTs at different
temperature for 30min. (d) 140°C (e) 160°C (f) 180°C ... 126 Fig. 5-26 The Pt loading amounts at different reaction temperatures ... 127 Fig. 5-27 The SEM images of Pt particles synthesized on MWCNTs of different
reaction time at 140°C. (a) 1.5min (b) 2min (c) 5min... 129 Fig. 5-27 The SEM images of Pt particles synthesized on MWCNTs of different
reaction time at 140°C. (d) 10 min (e) 30min (f) 90min ... 130
Fig. 5-28 The TEM images of Pt particles synthesized on MWCNTs of different reaction time at 140°C. (a) 1.5min (b) 2min (c) 5min... 131
Fig. 5-28 The TEM images of Pt particles synthesized on MWCNTs of different reaction time at 140°C. (d) 10 min (e) 30min (f) 90min ... 132
Fig. 5-29 The XRD spectrums of Pt particles synthesized on MWCNTs of different reaction time at 140°C. (a) 1.5min (b) 2min (c) 5min... 133
Fig. 5-29 The XRD spectrums of Pt particles synthesized on MWCNTs of different reaction time at 140°C. (d) 10 min (e) 30min (f) 90min ... 134
Fig. 5-30 The Pt loading amount of different reaction time... 135
Fig. 5-31 The particle size distribution of Pt nanoparticles ... 136
Fig. 5-32 High magnification SEM image of Pt-dispersed spiral CNTs ... 137
Fig. 5-33 Cross section images of Pt-sputtered MWCNTs ... 138
Fig. 5-34 Cross section images of highly Pt-dispersed MWCNTs by microwave assisted polyol method... 138
Fig. 5-35 The XPS spectrum of Pt Pt 4f peak of the microwave synthesized Pt particles on MWCNTs ... 139
Fig. 5-36 The electrocatalytic activity of Pt catalyst was tested by cyclic voltammetry (CV) in electrolyte of 1.0M H2SO4... 141
Chapter 1 Introduction
1.1 Carbon nanotubes
Carbon is the sixth element in the periodic table and is listed at the top of column IV. Carbon can exist in various forms as diamond, graphite, carbon fibers, fullerences and CNTs. Crystal structures of these carbons are shown schematically in Fig 1-1. Carbon shows a variety of stable forms ranging from 0D fullerenes [1] to 1D conducting or semiconducting CNTs to 2D semi-metallic graphite to 3D semiconducting diamond, as shown in Table 1-1 [2].
Table 1-1 Isomers of carbon [2]. Dimension 0-D 1-D 2-D 3-D Isomer C60 Fullerene CNTs Carbyne Graphite Fiber Diamond Amorphous Hybridization sp2 sp2 ( sp) sp2 sp3 Density [g / cm3] 1.72 1.2-2.0 2.68-3.13 2.26 ~2 3.515 2-3 Bond Length [Å] 1.4 (C=C ) 1.46 (C-C) 1.44 (C=C ) 1.42 (C=C ) 1.44 (C=C) 1.54 (C-C)
Electronic Properties Semiconductor Eg = 1.9 eV
Metal or Semiconductor
Semimetal Insulator Eg = 5.47 eV
1.1.1 Structure and properties of carbon nanotubes 1.1.1.1 Structure of carbon nanotubes
CNTs consist of either one cylindrical graphene sheet (Single-walled nanotubes, SWCNTs) or several nested cylinders with inter-layer spacing of 0.34 - 0.36 nm, close to the typical spacing of turbostratic graphite, i.e. MWCNTs. There are many possibilities to form a cylinder with a graphene sheet [4]. A few configurations are shown in Fig. 1-2. Figure 1-2(a)-(c) are SWCNTs of (a) armchair, (b) zig-zag and (c) chiral type. Figure 1-2(d) represents MWCNTs formed by four tubes of increasing diameter with layer spacing of 0.34 nm. Rolling up the sheet along one of the symmetry axis gives either a zig-zag tube or an armchair tube. It is also possible to roll up the sheet in a direction different from a symmetry axis to obtains a chiral CNT. Besides the chiral angle, the circumference of the cylinder can also be varied.
Fig. 1-2 Models of different CNTs structures [5].
Pristine SWCNTs are usually closed on both ends by fullerene-like halfspheres that contain both pentagons and hexagons [4]. SWCNTs with well-defined spherical tip are shown in Fig. 1-3(a). MWCNTs in which the cap shape is more polyhedral than spherical are presented in Fig. 1-3(b). The opened MWCNTs in which the ends of graphene layers and the tube internal cavity are exposed are shown in Fig 1- 3(c). Defects in the hexagonal lattice are usually present in the form of pentagons and heptagons. Pentagons make a positive curvature of the graphene layer and are generally found at the cap as shown in Fig. 1-3(b), where each knick in the graphene layers points to the presence of pentagons in the carbon network. Heptagons give rise to a negative curvature of the tube wall [6]. Defects consisting of several pentagons and/or heptagons have also been observed. A simple model indicates that the diameter and/or chirality of the tube varies from one side of the defect to the other [7]. Such an arrangement forms a link between two different tubes and is accordingly called a junction.
Fig. 1-3 TEM pictures of the ends of (a) a SWCNT, (b) a closed MWCNT, and (c) an open MWCNT. Each black line corresponds to one graphene sheet viewed edge-on [8].
1.1.1.2 Electronic properties of carbon nanotubes
Figure 1-4 shows the cutting graphite sheet along the dotted lines which connects two crystalline graphite equivalent sites on a 2-D [9]. Each carbon atom has three nearest neighbors, rolling sheet of graphite into cylinder to form CNTs. The circumference of CNTs can be expressed in term of the chiral vector, Ch, and chiral angle, θ. The chiral vector is given by Eq. (1):
) , ( 2 1 ma n m na Ch = + ≡ (1) (n, m are integers, 0≦ |m| ≦ n ),
where a1 and a2 are primitive vector lengths both equal to 3 lC-C and lC-C is
C-C bond lengh. The chiral angel determines the amount of twist in the tube. Chiral angles exist in two limiting cases at 0° and 30°. The chiral angle is defined in Eq. (2) as 2 2 1 1 2 2 cos n m nm m n a C a C h h + + + = ⋅ ⋅ = θ (2)
Fig. 1-4 Schematic diagram showing how a hexagonal sheet of graphite is rolled to form a CNT [9].
The zig-zag CNTs correspond to the case of m = 0, and the armchair CNTs correspond to the case of n = m. The chiral CNT corresponds to the other (n, m) chiral vectors. The zig-zag CNT (n, 0) is generated from hexagon with θ= 0°, and armchair CNT (n, n) is formed from hexagon with θ= 30°. The chiral CNTs are formed from hexagon with 0°<θ<30°. The inter-atomic spacing of carbon atom is known so that the rolled up vector of CNT can define the CNTs diameter. The properties of carbon CNTs depend on the atomic arrangement, diameter, length and the morphology [10]. This diversity of possible configurations is indeed found in practice, and no particular type is preferentially formed. In most cases, layers of MWCNTs are chiral [11,12] different helicities [13]. The lengths of SWCNTs and MWCNTs are usually well over 1 µm and diameters range from ~1 nm (for SWCNTs) to ~50 nm (for MWCNTs).
The electronic properties of SWCNTs have been studied in a large number of theoretical researches [4,14-17]. These models show that the electronic properties vary between calculable metallic ways and semiconducting approaches, depending on the tube chirality (n, m) given by [1]
Metallic properties: n-m = 0 or (n-m)/3 = integer Semiconducting properties: (n-m)/3 ≠ integer
The study shows that about 1/3 of SWCNTs are metallic, while the other 2/3 of SWCNT are semiconductor with a band gap inversely proportional to the tube diameter. This is due to the very unusual band structure of graphene and is absent in systems that can be described by traditional free electron theory. Graphene is a zero-gap semiconductor with energy bands of p-electrons crossing the Fermi level at the edges of the Brillouin zone, leading to a Fermi surface made up of six points [18]. Graphene should show a metallic behavior at room temperature since electrons can easily cross from the valence to the conduction band. However, it behaves as a semi-metal because the electronic density at the Fermi level is quite low [1,18]. Rolling up the graphene sheet into a cylinder imposes periodic boundary conditions along the circumference and only a limited number of wave vectors are allowed in the direction perpendicular to the tube axis. When such wave vectors cross the edge of the Brillouin zone, and thus the Fermi surface, the CNT is metallic. This is the case for all armchair tubes and for one out of the three zig-zag and chiral tubes. Otherwise, the band structure of the CNT shows a gap leading to semiconducting behavior, with a band gap that scales approximately with the inverse of the tube radius. Band gaps of 0.4-1 eV can be expected for SWCNTs (corresponding to diameters of 1.6-0.6 nm) [4,14,16]. This simple model does not take into account the tube curvature which induces hybridization effects for very small tubes [15] and generates a small band gap for most metallic tubes [17]. The exceptions are armchair tubes that remain metallic due to their high symmetry.
These theoretical predictions proposed in 1992 were confirmed in 1998 by scanning tunneling spectroscopy [19,20]. The scanning tunneling microscope has since then been used to image the atomic structure of SWCNTs [21,22] and the
electron wave function [23] and to characterize the band structure [22,24]. Numerous conductivity experiments on SWCNTs and MWCNTs have yielded additional informations [25-36]. At low temperature, SWCNTs behave as coherent quantum wires where conduction occurs through discrete electron states over large distances. Transport measurements revealed that metallic SWCNTs show extremely long coherence lengths [29,36,37]. MWCNTs also show such effects in spite of their larger diameter and multiple shells [38,39].
1.1.1.3 Mechanical properties carbon nanotubes
It has been indicated by growing experimental evidences that both MWCNT and SWCNT have certainly extraordinary mechanical properties. Yakobson et al [40,41] inspected the instability of CNTs beyond linear response. Their simulation results show that CNTs are remarkably resilient due to the sustaining extreme strain with no signs of brittleness or plasticity. Besides, some experimental measurements of Young’s modulus of CNTs have been reported. Treacy et al. [42] obtained a relation between tip oscillation amplitude and Young’s modulus. Through TEM observations of some CNTs, they defined the amplitude of those oscillations and obtained an average value of 1.8 TPa for the Young’s modulus. Another way to probe the mechanical properties of CNTs is to use the tip of AFM to bend anchored CNT. Young’s modulus can be extracted with simultaneous recording of the force exerted by the tube as a function of the displacement from its equilibrium position. By this way, Wong et al. [43] reported a mean value of 1.28±0.59 TPa with no dependence on tube diameter for MWCNT. Walters et al. [44] investigated the elastic strain of CNT bundles with the AFM. An experimental strain measurement and an elastic modulus of 1.25 TPa was assumed. Yield strength of 45±7 GPa was then calculated.
Yu et al. [45,46] reported the tensile of SWCNT and MWCNT ropes. For MWCNT ropes, tensile strengths of the outermost layer ranged from 11 to 63 GPa and elastic
modulus ranged from 27 to 950 GPa. For SWCNT ropes, tensile strengths from 13 to 52 GPa and average elastic modulus from 320 to 1470 GPa were obtained.
In terms of mechanical properties, CNTs are among the strongest and most elastic materials known to exist in nature [47]. Table 1-2 shows the mechanical properties of CNTs with other materials. It indicates that MWCNTs are of the most superior mechanical characteristics. The hollow structure and close topology of CNTs form a distinct mechanical response in CNT compared to other graphitic structures.
Table 1-2 Mechanical properties of CNTs compared with other Materials [47]. Materials Young’s modulus (GPa) Tensile strength (GPa) Density
(g/cm3) SWCNT 1054 ~150
MWCNT 1200 ~150 2.6 (10,10) Nanorope 563 ~75 1.3
Type I carbon fiber 350 2.5 2.6
Steel 208 0.4 7.8 Epoxy 3.5 0.05 1.25 Wood 16 0.08 0.6
1.1.2 Applications of carbon nanotubes 1.1.2.1 Energy storage
Graphite carbonaceous materials and carbon fiber electrodes are commonly used in fuel cells, batteries and other electrochemical applications. Advantages of considering nanotubes for energy storage are their small dimensions, smooth surface topology and perfect surface specificity. The efficiency of fuel cells is determined by the electron transfer rate at carbon electrodes, which is fastest on nanotubes following the ideal Nernstian behavior [48]. Electrochemical energy storage and gas phase intercalation will be described more thoroughly in the following.
1.1.2.2 Hydrogen storage
The advantage of hydrogen as energy source is water as the combustion product. In addition, hydrogen can be easily regenerated. For this reason, a suitable hydrogen storage system is necessary to satisfy both volume and weight limitations. Two common means to store hydrogen are gas phase and electrochemical adsorption. Because of their cylindrical and hollow geometry and nanometre-scale diameters, it has been predicted that carbon nanotubes can store liquids or gases in inner cores through capillary effects. As a threshold for economical storages, the storage requirements of 6.5 % by weight as the minimum level for hydrogen fuel cells has been set. It is reported that SWNTs were able to meet and sometimes exceed this level by using gas phase adsorption (physisorption). Yet, most experimental reports of high storage capacities are rather controversial so that it is difficult to assess the application potential. What lacks is a detailed understanding of the hydrogen storage mechanism and the effect of material processing on this mechanism. Another possibility for hydrogen storage is electrochemical storage. In this case H atoms instead of hydrogen molecules are adsorbed. This is called chemisorption.
1.1.2.3 Lithium intercalation
The basic principle of rechargeable lithium batteries is the electrochemical intercalation and deintercalation of lithium in both electrodes. An ideal battery requires high-energy capacity, fast charging and long cycle time. The capacity is determined by the lithium saturation concentration of the electrode materials. For Li, this is highest in nanotubes if all interstitial sites (inter-shell van der Waals spaces, inter-tube channels and inner cores) are accessible for Li intercalation. SWNTs have shown to possess both highly reversible and irreversible capacities. Because of the large voltage hysteresis observed, Li-intercalation in nanotubes is still unsuitable for battery application. This feature can potentially be reduced or eliminated by
processing, i.e. cutting nanotubes to short segments. 1.1.2.4 Electrochemical supercapacitors
Supercapacitors have high capacitance and potentially applicable in electronic devices. Typically, they are comprised of two electrodes separated by an insulating material that is ionically conducting in electrochemical devices. The capacity of the electrochemical supercap inversely depends on the separation between the charge on the electrode and the counter charge in the electrolyte. Because this separation is about a nanometre for nanotubes in electrodes, very large capacities result from the high nanotube surface area accessible to the electrolyte. In this way, a large amount of charge injection may occur if only a small voltage is applied. This charge injection is used for energy storage in nanotube supercapacitors [49]. Generally speaking, most interest is laid upon the double-layer supercapacitors and redox supercapacitors with different charge-storage modes.
1.1.2.5 Field emitting devices
If a solid is subjected to a sufficiently high electric field, electrons near the Fermi level can be extracted from the solid by tunneling through the surface potential barrier. This emission current depends on the strength of the local electric field at the emission surface and its work function, which denotes the energy necessary to extract an electron from its highest bounded state into the vacuum level. The applied electric field must be very high in order to extract an electron. This condition is fulfilled for carbon nanotubes, because their elongated shape ensures a very large field amplification [48].
For technological applications, the emissive material should have a low threshold emission field and large stability at high current density. Furthermore, an ideal emitter is required to have a diameter in nanometer size , a structural integrity, a high electrical conductivity, a small energy spread and a large chemical stability. Carbon
nanotubes possess all these properties. However, the application bottleneck of nanotubes is the dependence of conductivity and emission stability on fabrication processes and synthesis conditions. Examples of potential applications of nanotubes as field emitting devices are flat panel displays, gas discharge tubes in telecom networks, electron guns for electron microscopes, AFM tips and microwave amplifiers.
1.1.2.6 Transistors
The field-effect transistor – a three-terminal switching device – can be constructed of only one semiconducting SWNT. By applying a voltage to a gate electrode, nanotubes can be switched from conducting to insulating state [49]. A schematic representation of such a transistor is given in Fig. 1-5. Such carbon nanotube transistors can be coupled together to work as a logical switch, which is the basic component of computers [50].
Fig. 1-5 A single semi-conducting nanotube is contacted by two electrodes. Si substrate covered by a layer of SiO2 300nm thick acts as a back-gate.
1.1.2.7 Nanoprobes and sensors
Because of their flexibility, nanotubes can also be used in scanning probe instruments. Since MWNT tips are conducting, they can be used in STM and AFM instruments (Fig. 1-6). Advantages are the improved resolution in comparison with conventional Si or metal tips. Tips do not suffer from crashes with surfaces because of their high elasticity. However, nanotube vibration, due to their large length, is still an important issue unless shorter nanotubes can be grown under control.
Fig. 1-6 Use of a MWNT as AFM tip. VGCF stands for Vapour Grown Carbon Fibre. At the centre of this fibre MWNT forms the tip [48].
Nanotube tips can be modified chemically by the attachment of functional groups. Nanotubes can be used as molecular probes with potential applications in chemistry and biology. Described below are the further applications. A pair of nanotubes can be used as tweezers to move nanoscale structures on surfaces [49]. Sheets of SWNTs can be used as electromechanical actuators, mimicking the actuator mechanism present in natural muscles SWNTs may be used as miniaturised chemical sensors. On exposure to environments containing NO2, NH3 or O2, the electrical resistance changes.
1.1.2.8 Composite materials [48]
Because of the stiffness of carbon nanotubes, they are ideal for structural applications. For example, they may be used as reinforcement composites of high strength, low weight and high performance. Theoretically, SWNTs have Young’s Modulus of 1 TPa. MWNTs are weaker because the individual cylinders slide with respect to each other. Ropes of SWNTs are also less strong. The individual tubes can pull out by shearing and at last the whole rope breaks. This happens at stresses far below the tensile strength of individual nanotubes. Nanotubes also sustain large
strains in tension without fracture. In other directions, nanotubes are highly flexible [48]. One of the most important applications of nanotubes based on their properties is the reinforcement in composite materials. However, there have not been enough successful experiments to prove the better filler performance over traditional carbon fibers. The main problem is to create a good interface between nanotubes and the polymer matrix, because nanotubes are too smooth and too small in diameter, which is nearly the same as that of a polymer chain. Next, nanotubes are quite different from the individual nanotube in mechanical properties because of the easy aggregation. Limiting factors for good load transfer are sliding of cylinders in MWNTs and shearing of tubes in SWNT ropes. To solve this problem the aggregates need to be broken up and dispersed or cross-linked to prevent slippage. A main advantage of using nanotubes for structural polymer composites is that nanotube reinforcements increase the toughness of the composites by absorbing energy due to their highly flexible elasticity. Other advantages are the low density of nanotubes, increased electrical conduction and better performance during compressive load. Another possibility, which is an example of a non-structural application, is the filling of photoactive polymers with nanotubes. PPV (Poly-p-phenylenevinylene) filled with MWNTs and SWNTs is a composite, which has been used in several experiments. These composites show a large increase in conductivity with only a little loss in photoluminescence and electro-luminescence yields. Another benefit is that the composite is more robust than pure polymers. Of course, nanotube-polymer composites could also be used in other areas. For instance, they could be used in the biochemical field as membranes for molecular separations or for osteointegration (growth of bone cells). However, these areas are less explored. The most important thing we have to know about nanotubes for their efficient usage as reinforcing fibers is the knowledge on how to manipulate surfaces chemically to enhance interfacial
behavior between individual nanotubes and the matrix material. 1.1.2.9 Templates [48]
Because of the small channels, strong capillary forces exist in nanotubes. These forces are strong enough to hold gases and fluids in nanotubes and it is possible to fill cavities in nanotubes to build nanowires. The critical issue is the wetting characteristics of nanotubes. Because of their smaller pore sizes, filling of SWNTs is more difficult than filling of MWNTs. If it becomes possible to keep fluids inside nanotubes, it could also be possible to run chemical reactions inside cavities. Though special organic solvents wet nanotubes easily to make nanoreactor available, that nanotubes are normally closed cannot meet the application requirement. This is accessible through a simple chemical reaction, oxidation. Pentagons in the end cap of nanotubes are more reactive than sidewalls amd during oxidation, caps are easily removed while sidewalls stay intact.
1.1.3 Carbon nanotube synthesis
There are three major methods to synthesize CNTs: arc discharge, laser ablation and catalytic chemical vapor deposition.
1.1.3.1 Arc discharge
Arc discharge is the first available method to produce both MWCNTs [51,52] and SWCNTs [53,54]. This is the classic method to prepare MWCNTs. The method has been put in use for a long time for carbon fiber production. Therefore, it is very possible that CNTs were observed but not recognized until Iijima synthesized CNTs by this approach in 1991 [55,56].
Figure 1-7 shows the schematic of arc discharge system [8]. The arc discharge apparatus involves two graphite rods as anode and cathode. The rods are brought together under a gas atmosphere (usually He, but H2 [57] and Ar have also been used)
(~ 1mm) between cathode and anode is maintained by adjusting the position of anode. Carbons are deposited on the cathode to form CNTs and other carbon particles.
Fig. 1-7 Schematic illustration of arc discharge system and TEM micrograph of the grown CNTs [8].
1.1.3.2 Laser ablation
Laser ablation was first used to synthesize C60 in 1985 by Kroto et al. [58] and was
demonstrated to grow SWCNTs and MWCNTs in 1995 by Smalley’s group at Rice University [59,60]. Thess et al. [61] showed that the synthesis could be carried out in a horizontal flow tube under inert gas flow at controlled pressure. In this setup the flow tube is heated to ~1200°C by a tube furnace as displayed in Fig. 1-8. Laser pulses enter the tube and strike a target consisting of a mixture of graphite and metal catalyst such as Co or Ni. SWCNTs condense from the laser vaporization plume and deposite on a collector outside the furnace zone [62]. The size of carbon sources limited the sample volume. Besides, purifications are necessary to separate the tube from undesirable by-products.
Fig. 1-8 Schematic illustration of laser ablation apparatus [63].
1.1.3.3 Catalytic chemical vapor deposition (CVD)
The catalytic growth of CNTs is an alternative of arc discharge and laser ablation. It is based on the decomposition of hydrocarbon gases over transition metals to grow CNTs by using chemical vapor deposition (CVD). Since 1960s [64], carbon filaments and fibers have been produced by thermal decomposition of hydrocarbons. Catalysts are usually necessary to promote the growth [65]. A similar approach was used to grow MWCNTs from the decomposition of acetylene over iron particles in 1993 [66]. A tube produced by catalytic growth is shown in Fig. 1-9. In general, the diameter of CNTs grown by catalytic growth is larger than that of arc discharge but imperfect in graphitized crystalline structure. To grow MWCNTs, acetylene is usually used as carbon source between 600 and 800°C. To grow SWCNTs, the temperature has to be significantly higher (900-1200°C) because of the higher energy of formation. In this case carbon monoxide or methane must be used due to their high stability at higher temperatures as compared to acetylene.
Fig. 1-9 Schematic illustration of catalytic deposition and TEM micrograph of the grown CNT [8].
Up to now, the catalytic CVD has undergone many improvements. Co catalysts supported on silica particles produced straight as well as coiled MWCNTs [67], and the yield of CNTs was significantly increased by using zeolites as catalyst supports [68,69]. It was also reported that in the continuous production of SWCNTs, both carbons and catalysts are supplied in gas phase. Besides, the yield and average diameter of SWCNTs could be varied by controlling process parameters [70]. In addition, catalyst support types were found to control the formation of individual or bundled SWCNTs [71]. Transition metal ( Fe, Co, Ni) particles are catalysts for vapor grown CNTs synthesis with hydrocarbons as the carbon source. Metal catalysts are generally necessary to activate CNTs growth. A variety of other catalysts, hydrocarbons and catalyst supports have been used successfully by numerous groups in the world to synthesize CNTs [72,73].
1.1.3.4 Catalytic growth mechanisms of carbon nanotubes
Many growth mechanisms have been proposed to explain the relation between the growth condition and the structure of CNTs. According to the position of metal particles on the filament, two growth modes, base-growth and tip-growth, were reported [74]. The ‘base-growth’ mode means that the filament grows upward from metal particles, which attach to the substrate. If metal particles detach and move to the
head of the growing filament, it is the ‘tip-growth’ mode. These mechanisms were illustrated graphically in Fig. 1-10 by Sinnott et al. [75] (after Baker and Harris [74]).
Fig. 1-10 Schematics of tip-growth and base-growth for carbon filament growth [75].
Andrews et al. suggested [76] that the catalyst particle size determines the size of the ‘filament’. When the particle diameter is in the range of tenths of a micron, the carbon is produced as filaments of similar diameter [74,77]. As the particle diameter is reduced, the filament curvature increases to impose an increasing strain on the basal planes of the crystallites. Finally, a continuous surface is energetically favorable to form MWCNTs.
1.2 Fuel cell
Fuel cell can be traced back to the 1800's discovery by Sir William Robert Grove. Grove realized that if electrolysis could split water into hydrogen and oxygen by electricity then the reverse would also be true. Combining hydrogen and oxygen with the correct method would produce electricity. To prove his hypothesis, Sir William Robert Grove built a device that would combine hydrogen and oxygen to produce electricity, the world's first fuel cell. His invention was a success, and Grove's work advanced the idea of the conservation of energy and its reversibility. In 1899, a fuel
cell with power density of 104 km/h was assembled in an electric vehicle, the “Jamais Contente”.
Nowadays, to discover a new power source with less pollution and lower price to replace fossil oil is a noteworthy topic among resource industry. With the high efficiency and less pollution, fuel cells have become the most possible and popular power source in the next generation. Fuel cells generate electricity from a simple electrochemical reaction in which oxygen and hydrogen combine to form water and generate electrons. The reactions are
Anode: 2H2 → 4H+ + 4e
-Cathode: O2 + 4H+ + 4e- → 2H2O
Overall: 2H2 + O2 → 2H2O
In 1960s, the fuel cell was initially applied as an auxiliary power source in the Gemini space flights. Subsequently, advances in this technology were stagnant until the late 1980s when the fundamental design underwent significant reconfiguration. Even though there are challenges and obstacles to develop fuel cells, scientists never cease devoting their energies and efforts on fuel cell fields.
1.2.1 Classification of fuel cells
Fuel cells are classified primarily according to the types of electrolyte employed. This determines the types of chemical reactions that take place in the cell, the types of catalysts required, the temperature range in which cell operates, the fuel required, and other factors. These characteristics, in turn, affect the appropriate applications of these cells. There are several types of fuel cells currently under development, each with its own advantages, limitations, and potential applications. According to electrode types, several most promising types include proton exchange membrane fuel cell (PEMFC), alkaline fuel cell (AFC), phosphoric acid fuel cell (PAFC), molten carbonate fuel cell (MCFC), and solid oxide fuel cell (SOFC). Details of these fuel cells are described as
followed.
1.2.1.1 Polymer electrolyte membrane fuel cell
Polymer electrolyte membrane (PEM) fuel cells, also called proton exchange membrane fuel cells, deliver high power density and have the advantages of low weight and volume, compared to other fuel cells. PEM fuel cells use a solid polymer as an electrolyte and porous carbon electrodes containing platinum catalysts. They need only hydrogen, oxygen from the air, and water to operate and do not require corrosive fluids as some other fuel cells. They are typically fueled with pure hydrogen supplied from storage tanks or onboard reformers.
Polymer electrolyte membrane fuel cells operate at relatively low temperatures, around 80°C. Low temperature operation initiates quickly and results in less wear on system components and better durability. However, the necessity of noble-metal catalysts to separate electrons and protons of hydrogen costs high for systems. The platinum catalyst is also extremely sensitive to CO poisoning, and it is necessary to employ an additional reactor to reduce CO in the fuel gas if hydrogen are derived from alcohol or hydrocarbon fuels. This also increases the cost. Developers are currently exploring Pt-Ru catalysts that are more resistant to CO. PEM fuel cells are used primarily for transportation applications and some stationary applications. Due to the fast startup, low sensitivity to orientation and favorable power-to-weight ratio, PEM fuel cells are particularly suitable for passenger vehicles, such as cars and buses. A significant barrier of using these fuel cells in vehicles is hydrogen storage. Most fuel cell vehicles powered by pure hydrogen must store hydrogen onboard as compressed gases in pressurized tanks. Due to the low energy density of hydrogen, it is difficult to store enough hydrogen onboard to allow vehicles to travel the same distance as gasoline-powered vehicles before refueling, typically 300-400 miles. Higher-density liquid fuels such as methanol, ethanol, natural gas, liquefied petroleum
gas and gasoline seem to be available, but vehicles must have an onboard fuel processor to reform methanol to hydrogen. This increases costs and maintenances. The reformer also releases carbon dioxide, though less than that emitted from current gasoline-powered engines.
1.2.1.2 Phosphoric acid fuel cell
Phosphoric acid fuel cells use liquid phosphoric acid as an electrolyte with the acid contained in a Teflon-bonded silicon carbide matrix and porous carbon electrodes containing platinum catalysts. Chemical reactions that take place in the cell are shown in the diagram to the right. Phosphoric acid fuel cell (PAFC) is considered the "first generation" of modern fuel cells. It is one of the most mature cell types and the first to be used commercially with over 200 units in current use. This type of fuel cell is typically used for stationary power generation, but some PAFCs have been used to power large vehicles such as city buses. PAFCs are more tolerant of impurities in the reformate than PEM cells, which are easily poisoned by CO2—CO2 attaching to the
platinum catalyst at the anode as a result of decreasing fuel cell's efficiency. They are efficient by 85% for co-generations of electricity and heat, but less efficient for electricity generation only. This is slightly more efficient than combustion-based power plants with typical operation efficiency of 33 to 35%. PAFCs are also less powerful than other fuel cells, given the same weight and volume. As a result, these fuel cells are normally large and heavy. PAFCs are also expensive. Like PEM fuel cells, PAFCs require an expensive platinum catalyst, which raises the cost of the fuel cell.
1.2.1.3 Alkaline fuel cell
Alkaline fuel cells (AFCs) were one of the first fuel cell technologies developed, and were the first type widely used in the U.S. space program to generate electrical energy and water onboard spacecraft. These fuel cells use the aqueous solution of
potassium hydroxide as the electrolyte and use a variety of non-precious metals as catalysts at the anode and cathode. High-temperature AFCs operate at temperatures between 100ºC and 250ºC. However, more-recent AFC designs operate at lower temperatures from 23ºC to 70ºC.
AFCs are high-performance fuel cells due to the rate at which chemical reactions take place in the cell. They are also very efficient, reaching efficiencies of 60% in space applications. The disadvantage of this fuel cell is that it is easily poisoned by carbon CO2. In fact, even a little CO2 in the air can affect the cell's operation, and it is
necessary to purify both hydrogen and oxygen in the cell. This purification process is expensive. Susceptibility to poisoning also affects the cell's lifetime and raises further the cost. Cost is less of a factor for remote locations such as space or under the sea. However, for effective competition in most mainstream commercial markets, these fuel cells have to become more effective in cost. AFC stacks have been shown to maintain sufficiently stable operation for more than 8,000 operating hours. To be economically viable in large-scale utility applications, these fuel cells need to reach operating time exceeding 40,000 hours. This is possibly the most significant obstacle in commercializing this fuel cell technology.
1.2.1.4 Molten carbonate fuel cell
Molten carbonate fuel cells (MCFCs) are currently being developed for natural gas and coal-based power plants for electrical utility, industrial and military applications. MCFCs are high-temperature fuel cells that use electrolytes composed of molten carbonate salt mixture suspended in a porous and chemically inert ceramic lithium aluminum oxide (LiAlO2) matrix.
Since they operate at extremely high temperatures of 650ºC and above, non-precious metals can be used as catalysts at the anode and cathode to reduce costs. Improved efficiency is another reason why MCFCs offer significant cost reductions
over phosphoric acid fuel cells (PAFCs). Molten carbonate fuel cells can reach efficiencies of 60%, considerably higher than the 37-42% efficiencies of a phosphoric acid fuel cell plant. When waste heats are utilized, overall fuel efficiencies can be as high as 85%. Unlike alkaline, phosphoric acid and polymer electrolyte membrane fuel cells, MCFCs don't require an external reformer to convert more energy-dense fuels to hydrogen. Due to the high operation temperatures, these fuels are converted to hydrogen within the fuel cell itself by a process called internal reforming, which also reduces the cost. Molten carbonate fuel cells are not prone to CO or CO2 poisoning,
making them more attractive for fueling with gases made from coals. Although they are more resistant to impurities than other fuel cell types, scientists are looking for ways to make MCFCs resistant enough to impurities from coals, such as sulfurs and particulates. The primary disadvantage of current MCFC technology is durability. The high temperatures at which these cells operate and the corrosive electrolyte used accelerate component breakdown and corrosion, decreasing cell life. Scientists are currently exploring corrosion-resistant materials for components and fuel cell designs to increase cell life without decreasing performances.
1.2.1.5 Solid oxide fuel cell
Solid oxide fuel cells (SOFCs) use hard non-porous ceramic compounds as electrolytes. Since the electrolyte is a solid, the cell does not have to be constructed in the typical plate-like configuration of other fuel cell types. SOFCs are expected to be around 50-60% efficient at converting fuel to electricity. In applications designed to recover and utilize the system waste heat, overall fuel efficiencies could top 80-85%. Solid oxide fuel cells operate at very high temperatures. Cost reduction is valid because it is unnecessary to use precious metal catalysts at high temperatures. SOFCs also reform fuels internally and can use a variety of fuels to reduce the cost associated with adding a reformer to the system. SOFCs are the most sulfur-resistant fuel cell
type and tolerate more sulfurs than other cell types by several orders in magnitude. In addition, they are not poisoned by CO, which can even be used as fuel. This allows SOFCs to use gases made from coals. High-temperature operation has disadvantages. It results in a slow startup and requires considerable thermal shielding to retain heat and to protect personnel. This may be acceptable for utility applications but not for transportation and small portable applications. High operating temperatures also place stringent durability requirements on materials. The development of low-cost materials with high durability at cell operating temperatures is the key technical challenge. Scientists are currently developing lower-temperature SOFCs operating at or below 800ºC that have fewer durability problems and cost less. Lower-temperature SOFCs produce less electrical power, however, and stack materials that will function in this lower temperature range have not been identified. The differences and features of these fuel cells are summarized in Table 1-3.
1.2.2 Potential of direct methanol fuel cell
Direct methanol fuel cell (DMFC) is a kind of PEMFCs and is separated from PEMFC for detail discussion. Most fuel cells are powered by hydrogen, which can be fed to the fuel cell system directly or can be generated within the fuel cell system by reforming hydrogen-rich fuels such as methanol, ethanol and hydrocarbon fuels. Direct methanol fuel cell, however, is powered by pure methanol, which is mixed with steam and fed directly to the fuel cell anode. Direct methanol fuel cells do not have the fuel storage problems typical of some other fuel cells since methanol is higher than hydrogen in energy density. Methanol is also easier to transport and supply to the public using our current infrastructure since it is a liquid, like gasoline. Fig.1-11 shows the schematic diagram of a DMFC.
Table 1-3 Comparisons of various fuel cells.
MCFC PAFC PEMFC SOFC Electrolyte Molten carbonate
salt Liquid phosphoric acid Ion exchange membrane Solid metal oxide Operating tempt. 600~1000ºC 150~200ºC 60~100ºC 600~1000ºC Reforming External/Internal External External External/Internal Oxidant CO2/O2/Air O2/Air O2/Air O2/Air
Efficiency 45~60% 35~50% 35~50% 45~60% Max. Efficiency 85% 80% 60% 85% Max. power output 2MW 1MW 250kW 220kW Waste heat uses High pressure stream Space heating or water heating Space heating or water heating Heating water or stream
The anode, the negative post of the fuel cell, does several jobs. It conducts the electrons freed from hydrogen molecules so that they can be used in external circuits. It has channels etched into it that disperse hydrogen gases uniformly over catalyst surfaces. The cathode, the positive post of the fuel cell, has channels etched into it that distribute the oxygen to the surface of the catalyst. It also conducts electrons back from external circuits to catalysts, where they can recombine hydrogen ions and oxygen to form water. The electrolyte is the proton exchange membrane. This specially treated material only conducts positively charged ions and blocks electrons. The catalyst is a special material that facilitates the reaction of oxygen and hydrogen. It is usually made of platinum powder thinly coated onto carbon paper or cloth. The catalyst is rough and porous so that maximum surface area of the platinum can be exposed to the hydrogen or oxygen. The platinum-coated side of the catalyst faces the proton exchange membrane.
Because methanol is fed directly into the fuel cell, complicated catalytic reforming is unnecessary, and storage of methanol is much easier than that of hydrogen since methanol is a liquid and does not require high pressure operation. The energy density of methanol is greater than compressed hydrogen by orders of magnitude. However, efficiency is low, due to the high permeation of methanol through the membrane and the sluggish dynamic behavior. Methanol is also poisonous. As a result, DMFCs are limited in the power production but still can store much energy in a small space. This means they can produce a small amount of power over a long period of time which makes them well suited to power consumer electronics such as cell phones and laptops but rules them out of automotive applications. DMFC relies upon the oxidation of methanol on a catalyst layer to form carbon dioxide. Water is consumed at the anode and is produced at the cathode. Protons (H+) are transported across the proton exchange membrane to the cathode where they react with oxygen to produce
water. Electrons are transported via an external circuit from anode to cathode to provide power to external devices. The half reactions are:
Anode: CH3OH + H2O → CO2 + 6H+ + 6e
-Cathode: 3/2O2 + 6H+ + 6e- → 3H2O
Net reaction: CH3OH + 3/2O2 → CO2 + 2H2O
Because water is consumed at the anode in the reaction, pure methanol cannot be used without provision of water via either passive transport such as back diffusion, or active transport such as pumping. The need for water limits the energy density of the fuel.
1.3 Microwave Chemistry
Considerable knowledge of microwave radiation was obtained during the development of radar before and during the second world war. In the late 1960s it was used as a heating mode for temperature-jump experiments [78]. The first application in chemical research was reported in the early 1970s, when gas-phase discharge was applied to realize decomposition of simple organic compounds [79]. By the early 1980s, two patents concerning polymer chemistry appeared and one was related to starch derivatisation. However, when significant rate accelerations for reactions carried out in a conventional microwave oven were observed in 1986, considerable attention on reactions was laid upon dielectric heating [80,81]. In addition, more advanced microwave ovens were designed. Moreover, ensued are discussions on the causes of microwave reaction rate enhancements, apprehensions about temperature monitoring and control as well as trials of large-scale reactions in microwave ovens. 1.3.1 Microwave-assisted synthesis of metallic nanostructures
Microwave (MW) rapid heating has received considerable attention as a new promising method for the one-pot synthesis of metallic nanostructures in solutions. A variety of metallic nanostructures, including spherical particles, sheets, plates, rods,
wires, tubes and dendrites have generated significant scientific and technological interests because of their unique optical as well as novel chemical and catalytic properties. These nanostructures have been synthesized by various techniques, including chemical reduction of metallic ions in aqueous or organic solvents [82-84]. In general, chemical reduction has been carried out by heating reagent solutions at 65–200°C in an oil bath. In the oil-bath heating, the solvent is heated by conduction and convection, so that there is a large temperature distribution within the solvent.
Recently, microwave dielectric heating has been applied to the rapid synthesis of metallic nanostructures [85-112]. MWs are a portion of the electromagnetic spectrum with frequencies in the range from 300 MHz to 300 GHz. The commonly used frequency is 2.45 GHz. In the microwave frequency range, polar molecules such as H2O undertake to orientate with the electric field. When dipolar molecules attempt to
re-orientate with respect to an alternating electric field, they lose energy in the form of heat by molecular friction. The MW power dissipation per unit volume in a material (P) is given by equation:
where c is a constant, E is an electric field in the material, f is the radiation frequency, and ε' and ε'' are the dielectric and dielectric loss constants, respectively. ε' represents the relative permittivity, which is a measure of the ability of a molecule to be polarized by an electric field and tanδ=ε''/ε' is the energy dissipation factor or loss tangent. Equation indicates that ε'' is the most important physical parameter that describes the ability of a material to heat in the MW field. The physical parameters of typical solvents used in MW heating for synthesis of metallic nanostructures are listed in Table 1-4.
Table 1-4 Physical parameters of typical solvents used for microwave heating [113]. B.p. [°C] ε' ε'' tan δ water 100 78.3 12.3 0.157 methanol 65 32.7 20.9 0.639 ethanol 78 24.3 6.08 0.200 N,N-dimethylformamide(DMF) 153 36.71 – – ethylene glycol (EG) 198 41.0 41.0 1.00 N-methylpyrrolidone (NMP) 202 32.0 8.855 0.277
Water, alcohols, DMF and ethyleneglycol (EG) have high dielectric losses and high reduction abilities and are ideal solvents for MW rapid heating. The MW heating in these solvents in the presence of surfactants has been used to synthesize nanoparticles of various metals (Ni, Ru, Rh, Pd, Ag, Ir, Pt, Au,), [85-104] metallic compounds (PtRu, TiO2, CdS, CdSe, MoSe2, PbS, HgS, CuInTe2, CuInSe2) and Au/Pd core-shell
structures [105-112].
1.3.2 Possible effects of MW heating
There are two effects of MW dielectric heating, thermal and non-thermal [114]. Thermal effects arise from different temperature regimes under MW heating, whereas non-thermal effects result from effects inherent to the MWs. These effects lead to different morphologies and sizes of metallic nanostructures under MW heating from those in the conventional oil-bath heating.
1.3.2.1 Thermal effects (effects of rapid and uniform heating)
MW provides rapid and uniform heating of reagents, solvents, intermediates and products. Fast heating accelerates the reduction of metal precursors and the nucleation of the metal cluster, and results in mono-dispersed small nanostructures. When MWs are incident perpendicular to the solvent surface, their intensity is attenuated in the direction of incidence. However, for most materials, the distance is quite long in the direction of penetration at which the incident power is reduced to half of its initial
value. Therefore, the power dissipation is fairly uniform throughout the solvent. This homogeneous MW heating also provides uniform nucleation and growth conditions, and leads to uniform nanomaterials of small size. Due to the rapid and homogeneous MW heating, a better crystallinity can be obtained. Therefore, such single-crystalline nanostructures as polygonal plates, rods and wires could be synthesized efficiently in many cases.
1.3.2.2 Effects of hot spots and hot surfaces
When solids heated by MW are involved in the reaction system, hot spots are created on the solid–liquid surface. The uniform formation of hot spots and hot surfaces also accelerates the reduction of metal precursors and the nucleation of the metal cluster, and leads to uniform nanostructures of small size.
1.3.2.3 Superheating
Superheating of solvents over boiling points of solvents often occurs as a consequence of the MW dissipation over the whole liquid volume [113]. This effect is especially significant in the presence of a large amount of ions.
1.3.2.4 Non-thermal effects
Non-thermal effects are defined as those that occur under the same temperature profiles of solvents between MW and oil-bath heatings during the reaction. Formation of hot spots and hot surfaces are typical non-thermal effects for the preparation of metallic nanostructures. MW heating induces various thermal and non-thermal effects described above.
1.4 Motivation of this thesis
Since the discovery of CNTs, relevant research fevers and developments of commercial applications such as hydrogen storage, atomic force microscope probe, microelectronic transistor, electrical field emitter of flat panel display and scanning tunneling microscope tip have been stimulated tremendously and discussed in
![Fig. 1-4 Schematic diagram showing how a hexagonal sheet of graphite is rolled to form a CNT [9]](https://thumb-ap.123doks.com/thumbv2/9libinfo/8244736.171469/22.892.153.737.106.456/fig-schematic-diagram-showing-hexagonal-sheet-graphite-rolled.webp)
![Fig. 1-10 Schematics of tip-growth and base-growth for carbon filament growth [75].](https://thumb-ap.123doks.com/thumbv2/9libinfo/8244736.171469/35.892.248.644.208.464/fig-schematics-growth-base-growth-carbon-filament-growth.webp)
![Table 1-4 Physical parameters of typical solvents used for microwave heating [113]. B.p](https://thumb-ap.123doks.com/thumbv2/9libinfo/8244736.171469/46.892.145.765.163.355/table-physical-parameters-typical-solvents-used-microwave-heating.webp)