Dynamic response of glucagon/anti-glucagon pairs to pulling
velocity and pH studied by atomic force microscopy
Shiming Lin
a,b,∗, Yu-Ming Wang
b, Long-Sun Huang
b, Chii-Wann Lin
c,
Su-Ming Hsu
d, Chih-Kung Lee
baCenter for Optoelectronic Biomedicine, National Taiwan University, College of Medicine, 1-1 Jen-Ai Road, Taipei, Taiwan bInstitute of Applied Mechanics, National Taiwan University, Taipei, Taiwan
cInstitute of Biomedical Engineering, National Taiwan University, Taipei, Taiwan dInstitute of Immunology, National Taiwan University, Taipei, Taiwan
Received 9 November 2005; received in revised form 8 February 2006; accepted 7 April 2006 Available online 30 May 2006
Abstract
We used atomic force microscopy (AFM) to measure the unbinding force between antigen coupled to an AFM tip and antibody coated on the substrate surface. Dynamic responses of glucagon/anti-glucagon pairs with multiple pull-off steps to pH and pulling velocity were studied by AFM. Force–distance curves of a specific glucagon–anti-glucagon interaction system with mono-, di-, and multi-unbinding events were recorded, which may be attributed to a single, sequential or multiple breaking of interacting bond(s) between glucagon and anti-glucagon. We studied the dynamic response of glucagon–anti-glucagon pairs to various pulling velocities (16.7–166.7 nm/s). It was found that the mean value of the unbinding force was shifted toward higher values with increasing pulling velocity at each pH. This indicates that the friction force between glucagon and anti-glucagon may contribute to the unbinding force. Moreover, the dynamic response of glucagon–anti-glucagon pairs to pH (4–10) with different pulling velocities was studied. Within the acid range, the bond strength between the glucagon/anti-glucagon complex showed a rapid increase from pH 4 to 7 and reached a maximum (256.4± 48.9 pN at 166.7 nm/s) at neutrality, followed by a sharp decrease with increasing pH (pH 7–10). This could be attributed to the conformational change that occurred in glucagon when the pH value in solution was varied from the reference level at neutrality. This study demonstrated that the pH dependence of multiple antigen-antibody bond-rupture forces could be measured by a force-based AFM biosensor. Unraveling the relationship between inter-molecular force and intra-molecular conformational change in acid, neutral, and alkaline environments may provide new directions for future application of force measurements by AFM in proteomics or in the development of a clinical cantilever-based mechanical biosensor.
© 2006 Elsevier B.V. All rights reserved.
Keywords: Atomic force microscopy; Glucagon; Anti-glucagon; Unbinding force; Pulling velocity
1. Introduction
Atomic force microscopy (AFM), a nano-resolution tech-nique that needs no complex preparation procedure for biolog-ical samples (Binnig et al., 1986), has proved to be a suitable approach to structural studies of single biomolecules (Sitko et al., 2003; Chen et al., 2004; Kuznetsov et al., 2005) and to the mea-surement of molecular forces at the single-molecule level. AFM was employed successfully for measurement of intra-molecular unfolding forces of individual proteins (Desmeules et al., 2002;
∗Corresponding author. Tel.: +886 2 23123456x8458; fax: +886 2 23949125.
E-mail address:[email protected](S. Lin).
Weisel et al., 2003) and inter-molecular forces between various ligand and receptor pairs (Meadows et al., 2003; Kaur et al., 2004; Kienberger et al., 2005). Compared to other biophysical approaches to direct measurements of inter-molecular forces, such as optical tweezers, the magnetic torsion device, and the biomembrane force probe (BFP), AFM has the advantage of high spatial resolution for detecting molecular interaction at high lat-eral resolution combined with immense force sensitivity in a physiologic environment.
For measurements of inter-molecular receptor/ligand bind-ing strengths, ligands are attached to AFM tips and receptors are attached to substrate surfaces (or vice versa). The AFM tip is brought into contact with the surface so as to form recep-tor/ligand complexes. When the AFM tip is retracted from the 0956-5663/$ – see front matter © 2006 Elsevier B.V. All rights reserved.
1014 S. Lin et al. / Biosensors and Bioelectronics 22 (2007) 1013–1019
substrate surface, the force required for dissociation (unbinding force), defined as the rupture force at the moment of sample sep-aration, can subsequently be recorded and measured by pulling on the complexes until the interaction bond breaks. Such exper-iments allow for estimation of affinity, rate constants, and bond width of the binding pocket (Cai and Yang, 2003; Kokkoli et al., 2004; Kienberger et al., 2005), and even provide a tool for mapping the energy landscape (Cai and Yang, 2003; Lee and Marchant, 2003). In addition, these equipments provide insights into the molecular dynamics of the receptor/ligand recognition process by varying the loading rate of force application (Lee and Marchant, 2003; Kokkoli et al., 2004; Kienberger et al., 2005). Glucagon is a single polypeptide which consists of one lin-ear peptide with 29 amino acid sequences, and which exists at low concentrations as a monomer of low ␣-helix content (Borpmer et al., 1957; Gratzer et al., 1972). For understanding structure–function relationship, glucagon in solution was inves-tigated by use of circular dichroism (Gratzer and Beaven, 1969; Gratzer et al., 1972) and1H nuclear magnetic resonance (Boesch et al., 1978). The results obtained show that the concentration-dependent equilibrium of glucagon in mildly alkaline solution involves the formation of associated forms of higher␣-helicity. In acid solution, the effect is still present, but is greatly dimin-ished. These observations point out that the conformational properties of glucagon depend strongly on the pH of the solution conditions. Moreover, the biological function of glucagon is to maintain the blood sugar at a stable level. Quantitative observa-tions are needed for determination of the interaction dynamics of glucagon with its antibody, anti-glucagon immunoglobulin G (IgG), for the purpose of developing a clinical glucagon sensor chip for predicting the risk of future cardiovascular events. Here, we report on the application of AFM to studies of the molecu-lar dynamics of the glucagon/anti-glucagon recognition process for use in developing a clinical cantilever-based mechanical biosensor.
2. Materials and methods
2.1. Functionalisation of AFM tip and substrate
AFM tips (CONTRTM Nanosensors, Germany) were cou-pled with glucagon (G3157, Sigma, CA) and a glass surface (Superfrost, Germany) coated with monoclonal anti-glucagon IgG (G2654, Sigma, CA). AFM tips were cleaned for 30 min in H2SO4/H2O2(70:30, v/v) and then extensively rinsed with dis-tilled water. The tips were then silanised with a 5% solution of 3-aminopropyltriethoxysilane (Fluka Chemie, Switzerland) in 5% ethanol solution for 30 min at room temperature, followed by several rinses with a solution of 5% ethanol/95% distilled water. The tips were then immersed in a 2.5% glutaraldehyde solution in phosphate-buffered saline (PBS, pH 7.2) for 1 h and then extensively rinsed with PBS solution. In the last step, the glucagon solution (100g/ml in PBS, pH 7.2) bound covalently to the AFM tip via the amino groups after incubation overnight at 4◦C. Before being used in the acquisition of force mea-surements, glucagon-functionalised tips were rinsed with PBS. Anti-glucagon IgG (100g/ml) was covalently to the glass
sub-strate by use of the method described byVinckier et al. (1998). The surface coverage of sample IgG on the glass and glucagon on the tip were measured by use of an AnaLight®Bio200 dual polarization interometric biosensor (Farfield Sensors Ltd., Sal-ford, UK).
2.2. AFM force measurements and data analysis
All force measurements were performed with a SPA-300HV scanning probe microscope (SPM) controlled by an SPI 3700 probe station unit (Seiko Instruments Inc., Chiba, Japan). All experiments were carried out in a liquid cell filled with freshly prepared aqueous solution at room temperature. Commercial AFM tips (silicon CONTRTM Nanosensors, Germany) with a probe radius of 20 nm were modified as described above. Each cantilever was individually calibrated by a thermal fluc-tuation method (L´evy and Maaloum, 2002) for determining its spring constant. The average spring constant for the cantilevers employed here was 80± 10 pN/nm. Moreover, the sensitivity of an individual cantilever was calibrated by use of the slope of the cantilever deflection (mV) versus deflection distance (nm) curve when the cantilever was applied on a stiff surface. The sensitivity value was found to be in the range from 11.4 to 18.3 mV/nm.
During a force measurement cycle (seeFig. 1), the piezo-scanner is moved toward the AFM tip by piezo-expansion, and the velocity constant is kept until the scanner is brought into contact with the tip (point 2 inFig. 1). As the forward motion continues, the cantilever is pressed into the sample surface until a point of maximum load is reached (point 3). The direction of motion is then reversed, and the piezo-scanner is withdrawn from the AFM tip. The deflection distance of cantilever bending was limited to less than 60 nm for all force measurements. Dur-ing the retract portion of the force measurement, i.e. when the piezo-scanner is withdrawn from the tip surface, the tip adheres to the surface due to interactions between the tip and the sam-ple. The strength of the unbinding force is calculated from the difference between the maximum cantilever deflection (point 4) during the retraction process of the curve and the point of zero cantilever deflection (point 1). In this work, we set the piezo moving displacement with 500 nm z-amplitude at moving time of 3, 5, 10, and 30 s, and thus obtaining the pulling velocity of 16.7, 50, 100, and 166.7 nm/s, respectively. To measure the unbinding force made as function of pulling velocity, the veloc-ity of piezo-scanner was varied from 16.7 to 166.7 nm/s. More than 100 individual force measurements for each vertical veloc-ity of piezo-scanner were recorded at each pH.
3. Results and discussion
To understand the dynamic response of individual glucagons/anti-glucagon pairs to pH, we used AFM to mea-sure the unbinding force required to separate complementary glucagon/anti-glucagon pairs at different pH in aqueous solu-tion. Force measurements of the glucagon–anti-glucagon inter-actions were carried out by use of an AFM in the force scan mode. For these experiments, a glass substrate, coated with
Fig. 1. Schematic diagram of a typical force measurement cycle with AFM used as a force-based biosensor for measuring the unbinding force required to break the glucagon–anti-glucagon bond(s) formed on contact. The relative position of the sample surface with respect to the AFM tip is indicated by arrowheads. Approach (dotted line in B): as the piezo-scanner was moved towards AFM tip at constant velocity from point 1 to point 2, the cantilever was pulled down by the attractive force and jump-to-contact with the surface at point 2. As the cantilever continued to approach to the sample, the cantilever bent upward until it reached point 3. Retraction (solid line): when the tip reached point 3, the piezo-scanner was moved away from the AFM tip and the cantilever began to retract. As the cantilever continued to retract, it was bent downward until it reached point 4. The tip–sample complex started to break from point 4. A sharp adhesive ‘pull-off’ of approximately 150 pN, a specific tip–sample interaction, is observed in the retract trace. Finally, the cantilever returned to its original equilibrium state at point 1.
monoclonal anti-glucagon IgG, was brought in contact with an AFM tip coupled with glucagon (Fig. 1A). The unbinding force of the glucagon–anti-glucagon interaction was measured as the piezo-scanner was retracted from the AFM tip surface. A schematic diagram of a typical unbinding force measurement cycle between glucagon and anti-glucagon is shown inFig. 1B. The maximal cantilever deflection, resulting from a sharp adhe-sive ‘pull-off’ event (point 4), during the retraction trace of the force measurement is related directly to the magnitude of the unbinding force required for breaking the glucagon–anti-glucagon bond(s) formed (Allen et al., 1999).
Fig. 2shows representative examples of the force–distance curves acquired with these systems. No noticeable pull-off event was observed in the tip–glass system (Fig. 2A). In the glucagon– anti-glucagon system (Fig. 2B), however, a clear force discon-tinuity was present as a result of the adhesion force (unbinding
force) between the glucagon–anti-glucagon pair. This suggests that the force measured in the glucagon–anti-glucagon sys-tem can be attributed to the specific glucagon–anti-glucagon unbinding event. Moreover, to confirm that glucagons–anti-glucagon binding caused the observed force discontinuity, the anti-glucagon surface was flooded with glucagon as a con-trol experiment effectively to block the combining sites of the anti-glucagon IgG on the substrate. The recorded force curves displayed no adhesion pull-off event (or no discrete adhesion point), i.e. an unbinding force was not observed (seeFig. 2C). The lack of discrete adhesion points in the force curves obtained in the two control experiments (Fig. 2A and C) highlights the specificity of the interaction between the glucagon coupled to the tip and the anti-glucagon coated to the substrate.
InFig. 2B, a slope change before the adhesion point appeared during the retraction process may be attributed to a decrease
1016 S. Lin et al. / Biosensors and Bioelectronics 22 (2007) 1013–1019
Fig. 2. Measurements of unbinding forces. Force vs. distance curves of no adhesive force appeared in the retraction process, which were obtained by use of (A) tip/glass and (C) glucagons/glucagon-occupied anti-glucagon systems as two control experiments. (B) A typical force–distance curve of the glucagon–anti-glucagon system with a specific unbinding event that appeared in the retracting process. (D) Another type of recorded curve, which kept the same slope during the retraction process and was thought to be a non-specific interaction between the tip and the substrate.
of the ‘spring constant’, which was thought to be a specific interaction between glucagon and anti-glucagon IgG. Com-pared to the curve inFig. 2B, another type of curve that was recorded (as shown in Fig. 2D) kept the same slope during the retraction process, which was thought to be a non-specific interaction between the tip and the substrate. The difference between specific and non-specific interaction could be easily pointed out when one suppose that the ‘spring constant’ is the stiffness of the system cantilever plus glucagon–IgG interac-tion. The effective stiffness k of the system can be expressed by k = (kcant× kinter)/(kcant+ kinter), where kcantand kinter is the stiffness of the cantilever and glucagons/IgG complex, respec-tively. If kinteris high (specific interaction) as compared to kcant the effective stiffness is equal to the cantilever stiffness and then quasi constant which is the case inFig. 2B. In the other case (non-specific interaction) the value of the effective stiffness is close to the interaction stiffness and then low and not constant, as shown inFig. 2D. The non-specific force curve shown inFig. 2D could be attributed to two factors. First, the tip and the substrate were not completely coupled with glucagon and anti-glucagon, respectively. When the tip was pressed onto the substrate, the linker (aminopropyltriethoxysilane + glutaldehyde) on the tip non-specifically contacted with the linker or anti-glucagon on the substrate (Willemsen et al., 1998). Second, the time of con-tact of the tip with the substrate was too short for the glucagon on the tip to have enough time to complete the binding process with anti-glucagon before the approach process became a retraction process (Wong et al., 1997; Willemsen et al., 1998). As a result,
specific and non-specific interaction can be distinguished by the change in slope during the retraction process.
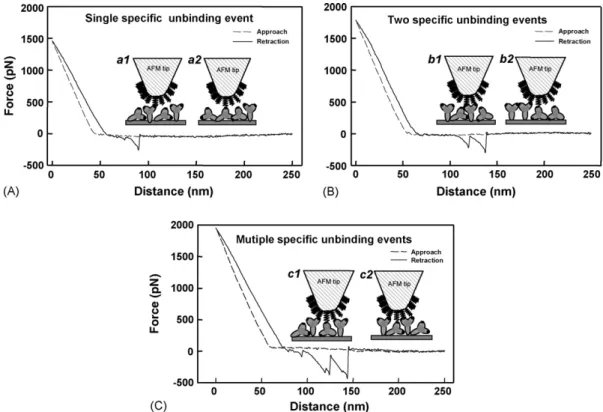
Fig. 3shows the force–distance curves of the glucagon–anti-glucagon system with mono- (Fig. 3A), di- (Fig. 3B) and multi-(Fig. 3C) unbinding events (pull-off steps) recorded for a pH 7 solution, which may be attributed to a single, sequential, or multiple breaking of interacting bond(s) between glucagon and anti-glucagon (Allen et al., 1997; Lo et al., 1999). In this study, an AFM tip with a probe radius of about 20 nm was cou-pled with glucagon and glass surface coated with anti-glucagon IgG, which has been shown to be a Y-shaped molecule of overall dimensions approximately 14.2 nm× 8.5 nm × 4.0 nm by X-ray crystallography studies (Ahluwalia et al., 1992). In addition, a surface coverage of IgG of 9.47× 10⁻¹⁵mol/mm2 (or an area per IgG molecule of 175.4 nm2) was observed (data not shown) using a dual polarization interferometric biosensor, which is close to the ‘theoretical’ saturated area per molecule (158.4 nm2/molecule), the most likely surface structure is that of a monolayer. Such preparations of a monolayer IgG and glucagon surface were then employed in the force measurements of specific glucagons–anti-glucagon interactions (Fig. 3A–C). Schematic representations of the A, B, and C binding events are shown in a, b, and c, respectively. The force curve with one adhe-sion point (Fig. 3A) indicates that the single-pair interaction was broken in the retraction process of the force measurement. Such a force curve could be attributed to the fact that the anti-glucagon IgG molecules randomly immobilized on the glass could be ori-ented (a1) or lying on the substrate (a2) with one binding site
Fig. 3. Force–distance curves of the glucagon–anti-glucagon system with (A) mono-, (B) di-, and (C) multi-unbinding events (pull-off steps) recorded in pH 7 solution at a pulling velocity of 166.7 nm/s, which may be attributed to (A) a single, (B) sequential, or (C) multiple breaking of bond(s) between the tip and the substrate. Schematic representations of the A, B, and C binding events are shown in a, b, and c, respectively. The anti-glucagon IgG molecules randomly immobilized on the glass could be oriented (a1) or lying on the substrate (a2) with one binding site oriented to bind a single glucagon on the tip. Two separate glucagons on the tip can bind to two identical combining sites on one anti-glucagon (b1) or to separate combining sites on two anti-glucagon molecules (b2). Several separate glucagons on the tip can bind to three (c1) to four (c2) separate combining sites on anti-glucagons.
oriented so as to bind a single glucagon on the tip. InFig. 3B, the force curve with two adhesion points indicates a sequential breaking of interacting bond(s) between the tip and the substrate. Two separate glucagons on the tip might bind to two identical binding sites on one anti-glucagon (b1) or to separate binding sites on two anti-glucagon molecules (b2) when the tip is in con-tact with the substrate surface. In addition, in some force curves (Fig. 3C), there were multiple pull-off steps in the retraction pro-cess that could be attributed to multiple breaking of interacting bonds between the tip and the substrate. The multiple pull-off steps observed could be explained by two factors. First, glucagon is a small molecule (MW = 3485), and more than three separate glucagons on the tip might bind to three (c1) to four (c2) separate binding sites on anti-glucagons when the tip is in contact with the substrate surface. Second, such multiple pull-off steps that appeared in a retracting process may be due to partial unbinding forces related to conformational transitions in the binding sites of anti-glucagon and induced protein-unfolding events (Lee and Marchant, 2003). As discussed above, the multiple unbinding events that were measured could result from the non-specific interaction or protein unfolding, therefore, they were neglected in our calculations.
To investigate the dependence of the pulling velocity of glucagon–anti-glucagon unbinding forces, we recorded and plotted all specific unbinding events as force histograms, which were then subsequently subjected to Gaussian fitting for analy-sis (Evans and Ritchie, 1997; Lee and Marchant, 2003; Bartels
et al., 2003; Heymann and Grubm¨uller, 1999).Fig. 4shows his-tograms of the unbinding force between a glucagon tip and an anti-glucagon substrate measured with various pulling veloci-ties (V) of 16.7, 50.0, 100.0, and 166.7 nm/s, respectively, at pH
Fig. 4. Histograms of the unbinding force between a glucagon tip and an anti-glucagon substrate measured with various pulling velocities (V) (16.7, 50.0, 100.0, and 166.7 nm/s) in pH 7 solution. For each unbinding force (F) obtained, more than 100 unbinding events from about 500 approach/retraction cycles were recorded. All histograms were fitted to a Gaussian function (Evans and Ritchie, 1997). The mean value of the Gaussian equals the most probable unbinding force, with statistical errors given by standard deviation. All AFM force measurements were carried out in PBS at 25◦C.
1018 S. Lin et al. / Biosensors and Bioelectronics 22 (2007) 1013–1019
Fig. 5. Pulling-velocity dependence of the unbinding force for glucagons–anti-glucagon pairs. It clearly shows that the unbinding force is proportional to the pulling velocity at various pH values (4, 6, 7, 8, 10) (R2= 0.9585, 0.9911, 0.9982,
0.9440 and 0.9859 for pH 4, 6, 7, 8 and 10, respectively).
7 solution. For each unbinding force (F) obtained, more than 100 unbinding events from about 500 approach/retraction cycles were recorded. The mean unbinding force of the glucagon–anti-glucagon complex at a given pulling velocity was determined from a force histogram obtained from more than 100 mea-surements. The corresponding mean unbinding forces, obtained by fitting of the histogram to a Gaussian function, were 151.0± 22.0, 170.6 ± 26.1, 210.4 ± 38.0, and 256.4 ± 48.9 pN at pulling velocities of 16.7, 50.0, 100.0, and 166.7 nm/s, respec-tively.
In Fig. 4, the mean value of the unbinding force (F) was shifted toward higher values with increasing pulling veloc-ity at pH 7. The fact that the unbinding force increased with increased pulling velocity indicates that the friction force between glucagon and anti-glucagon may contribute to the unbinding force (Heymann and Grubm¨uller, 1999). We assume the difference between the unbinding force obtained at each pulling velocity and the unbinding force at a zero pulling velocity corresponds to the friction effect. The assumption is supported by a linear relationship between the unbinding force and the pulling velocity that was observed in our experiments (Fig. 5). Fig. 5clearly shows that the unbinding force is proportional to the pulling velocity (R2= 0.9585, 0.9911, 0.9982, 0.9440 and 0.9859 for pH 4, 6, 7, 8 and 10, respectively), which could be explained by the Stokes’ friction equation (Ff= r× V, where the friction force is the product of the friction coefficient and the pulling velocity) (Heymann and Grubm¨uller, 1999). Thus, the friction coefficient with varied pulling velocity at each pH can be calculated from the slope of each plot. The friction coefficient obtained was 0.1598, 0.4239, 0.7137, 0.3596 and 0.2217 pN s/nm at pH 4, 6, 7, 8, and 10, respectively. The max-imum friction coefficient was obtained at pH 7, and all of the friction coefficients decreased as the pH value both increased and decreased. This phenomenon has also been interpreted by Bell (1978)andEvans et al. (2001)based on diffusion theory. In addition, for force measurements in a liquid environment, hydrodynamic drag may make a considerable contribution to the force that is probed, especially at high pulling velocity (Lee and
Fig. 6. pH dependence of the unbinding force for glucagons–anti-glucagon pairs with different pulling velocities (16.7–166.7 nm/s). The error bars correspond to one standard deviation, as indicated inFig. 4, and are placed on all data points. Within the acid range (pH 4–7), the unbinding force of the complex showed a rapid increase with increasing pH and reached a maximum (256.4± 48.9 pN at 166.7 nm/s) at neutrality (pH 7), followed by a sharp decrease with increasing pH (pH 7–10).
Marchant, 2003). To understand the possible effect of hydrody-namic drag on the unbinding force, we measured the deflections of the free-standing AFM cantilever as a function of distance in PBS buffer and recorded them in the non-contact region at var-ious pulling velocities in the range of from 16.7 to 166.7 nm/s. Within this range of pulling velocities, it was found that the sig-nals of the reflected laser beam (deflections) in the non-contact region in the force measurement cycle were kept constant, with slopes close to zero in a plot of deflection versus position (data not shown). This indicated that hydrodynamic drag did not have any influence on the unbinding force in the force measurements at various pulling velocities in this work.
Fig. 6summarizes the dynamic response of glucagon–anti-glucagon pairs to the pH value (4–10) with different pulling velocities (16.7–166.7 nm/s). Within the acid range (pH 4–7), the unbinding force of the complex showed a rapid increase with increasing pH, reaching a maximum (256.4± 48.9 pN at 166.7 nm/s) at neutrality (pH 7), followed by a sharp decrease with increasing pH (pH 7–10). This indicates that the bond strength between glucagon and anti-glucagon in acidic or alka-line solution is reduced compared to that in a neutral solution. These results could be attributed to two factors below. First, a conformational change may occur in glucagon when the pH value in solution is changed from the reference level at neutral-ity. The glucagon in aqueous solution does not have a stable ␣-helical structure, which is essentially dependent on the pH over the range in which glucagon is soluble. The concentration-dependent equilibrium of glucagon in mildly alkaline solution involves the formation of associated forms of higher␣-helicity. In acid solution, the effect is still present, but, is greatly dimin-ished (Gratzer and Beaven, 1969; Gratzer et al., 1972; Panijpan and Gratzer, 1974). These observations point out that the con-formational properties of glucagon depend strongly on the pH of the solution. This may reduce the binding strength between glucagon and anti-glucagon, and thus it led to a decrease in the
unbinding force in both the acid and alkaline range. Second, the biological function of glucagon varies with the pH value. When the force of glucagon–anti-glucagon pairs was measured in alkaline solution, the glucagon rapidly converted to monode-samidoglucagon (Gratzer et al., 1972). This result could lead to a decrease in the biological binding strength of glucagon with anti-glucagon. On the other hand, when the force measurement was performed in acid solution, the glucagon aggregated to pro-duce gels (Panijpan and Gratzer, 1974), this also could weaken the interaction force between glucagon and anti-glucagon. 4. Conclusions
We have shown the advantage of using AFM, which is a sensitive force probe for elucidating the molecular details of specific unbinding events between glucagon and anti-glucagon with different pulling-velocities at various pH values. A spe-cific glucagon–anti-glucagon interaction system with mono-, di-, and multi-unbinding events was found in the force–distance curves, which may be attributed to a single, sequential, or multiple breaking of interacting bond(s) between glucagon and anti-glucagon. Moreover, each average unbinding force of glucagon–anti-glucagon pairs was shifted toward higher values with increasing pulling velocity (16.7–166.7 nm/s) at various pH values (4, 6, 7, 8, 10). This finding indicates that the fric-tion force between glucagon and anti-glucagon may contribute to the unbinding force. Furthermore, the dynamic response of glucagon–anti-glucagon pairs to pH levels (between 4 and 10) was studied. We found that the bond strength between the glucagons/anti-glucagon complex showed a rapid increase from pH 4 to 7, and reached a peak at neutrality, followed by a sharp decrease with increasing pH (pH 7–10), which could be attributed to the conformational change that occurs in glucagon when the pH value in solution is varied from the reference level at neutrality. Our results demonstrate that the pH depen-dence of multiple antigen-antibody bond-rupture forces could be correlated with intra-molecular conformational change in acid, neutral, and alkaline environments.
References
Ahluwalia, A., Rossi, D.D., Schirone, A., 1992. Thin Solid Films 210 (2), 726–729.
Allen, S., Chen, X., Davies, J., Davies, M.C., Dawkes, A.C., Edward, J.C., Roberts, C.J., Sefton, J., Tendler, S.J.B., Williams, P.M., 1997. Biochemistry 36 (24), 7457–7463.
Allen, S., Davies, J., Davies, M.C., Dawkes, A.C., Roberts, C.J., Tendler, S.J.B., Williams, P.M., 1999. Biochem. J. 341 (Pt 1), 173–178.
Bartels, F.W., Baumgarth, B., Anselmetti, D., Ros, R., Backer, A., 2003. J. Struct. Biol. 143, 145–152.
Bell, G.I., 1978. Science 200 (4342), 618–627.
Binnig, G., Quate, C.F., Gerber, C., 1986. Phys. Rev. Lett. 56 (9), 930– 933.
Boesch, C., Bundi, A., Oppliger, M., W¨utherich, K., 1978. Eur. J. Biochem. 91 (1), 209–214.
Borpmer, W.W., Sinn, L.G., Behrens, O.K., 1957. J. Am. Chem. Soc. 79 (11), 2807–2810.
Cai, X.E., Yang, J., 2003. Biochemistry 42, 4028–4034.
Chen, Y., Cai, J., Xu, Q., Chen, Z.W., 2004. Mol. Immunol. 41, 1247– 1252.
Desmeules, P., Grandbois, M., Bondarenko, V.A., Yamazaki, A., Salesse, C., 2002. Biophys. J. 82, 3343–3350.
Evans, E., Ritchie, K., 1997. Biophys. J. 72 (4), 1541–1555.
Evans, E., Leung, A., Simon, S., 2001. Proc. Natl. Acad. Sci. U.S.A. 98 (7), 3784–3789.
Gratzer, W.B., Beaven, G.H., 1969. J. Biol. Chem. 244 (24), 6675–6679. Gratzer, W.B., Creeth, J.M., Beaven, G.H., 1972. Eur. J. Biochem. 31 (3),
505–509.
Heymann, B., Grubm¨uller, H., 1999. Chem. Phys. Lett. 303 (1–2), 1–9. Kaur, J., Singh, K.V., Schmid, A.H., Varshney, G.C., Suri, C.R., Raje, M., 2004.
Biosens. Bioelectron. 20, 284–293.
Kienberger, F., Kada, G., Mueller, H., Hinterdorfer, P., 2005. J. Mol. Biol. 347, 597–606.
Kokkoli, E., Ochsenhirt, S.E., Tirrell, M., 2004. Langmuir 20, 2397–2404. Kuznetsov, Y.G., Daijogo, S., Zhou, J., Semler, B.L., McPherson, A., 2005. J.
Mol. Biol. 347, 41–52.
Lee, I., Marchant, R.E., 2003. Ultramicroscopy 97, 341–352.
Lo, Y.-S., Huefner, N.D., Chan, W.S., Stevens, F., Harris, J.M., Beebe, T.P., 1999. Langmuir 15, 1373–1382.
L´evy, R., Maaloum, M., 2002. Nanotechnology 13 (1), 33–37.
Meadows, P.Y., Bemis, J.E., Walker, G.C., 2003. Langmuir 19 (23), 9566– 9572.
Panijpan, B., Gratzer, W.B., 1974. Eur. J. Biochem. 45 (2), 547–553. Sitko, J.C., Mateescu, E.M., Hansma, H.G., 2003. Biophys. J. 84, 419–
431.
Vinckier, A., Gervasoni, P., Zaugg, F., Ziegler, U., Lindner, P., Groscurth, P., Pl¨uckthun, A., Semenza, G., 1998. Biophys. J. 74 (6), 3256–3263. Weisel, J.W., Shuman, H., Litvinov, R.I., 2003. Curr. Opin. Struct. Biol. 13,
227–235.
Willemsen, O.H., Snel, M.M., van der Werfs, K.O., de Grooth, B.G., Greve, J., Hinterdorfer, P., Gruber, H.J., Schindler, H., van Kooyk, Y., Figdor, C.G., 1998. Biophys. J. 75 (5), 2220–2228.
Wong, J.Y., Kuhl, T.L., Israelachvili, J.N., Mullah, N., Zalipsky, S., 1997. Sci-ence 275 (5301), 820–822.