Ocean E n g . . Vol. 7, pp. 207-228. Pergamon Press Ltd., 1980. Printed in Great Britain
M O D E L I N G O F P U M P I N G C O L D D E E P N U T R I E N T - R I C H S E A W A T E R F O R M A R I C U L T U R E A N D N U C L E A R P O W E R
P L A N T C O O L I N G A P P L I C A T I O N S B. J. H U A ~
Department of Mechanical Ensineerin& National Taiwan University, Taipei, Taiwan, Republic of China Almtmgt--A simple ~ 1 model is developed to ~ the technical feasibility of
mki deep autrimt-ri~h Jeawater for nmicelmre end nudmr power plant
Simnlatiem foe two locations in eastern Taiwan have shown that ~ warm tin'face mewater by eeld deep tmwatef as n u d u r power plant molant is U g h n i ~ y fe~ible fc~ w ~ ~ u ~ h r ~ r tlum 1~0 ~ m~l inmlm i z v ~ ~ m ~ r tlum ~00 m. The gravitatioml f c ~ . i n d t g ~ l flow systmn is alto a a m i n ~ and shown not to be suitable for the r,~tM_r power plant cooling application. However, it is shown that both systems are suitable for mm'isndla~ applications. The requLred pumping powers at different pipeline conditions are also pt, w ~ t e d in the paper, for des/In purposes.
w, P L D P~ Re Pr Pc H Y X P . Z T c, U T® Tx r~ On T~ r, T% ¢7 B Y u h P N O M E N C L A T U R E ~ work l g r unit mass
lhsssms Phssb. I . = ~ I ~ dism,~ of p ~ l m le~butk nt¢~ P.s,~a~ n u m ~ Pnmdtl number I N g ~ numb~ Intake ks, el
distance from intake AUtaal~n~ lamure
Pun~kag i x ~ c r to tl~ w a w a t ~ flow in the p/pc l o c a l fluid mnl~'ature i n , d e the pipe
hint ¢~ u a w a t ~ Otwsll heat t r a m ~ o o W k ~ t T ~ t u m distribution ~ Mawat~ Smwtter tempa'atum at j r ~ i t e depth. l ~ t power output of orijinal pow~ cycle BoWn8 tmnla~ture of tho p o w ~ cycle Ccmdmsafi~ mni~rature of the power cycle Heat added to the boiler of the power plant Surface smwat~ teCnl~ature
Deep mawat~ t~N~rature at the outlet of the Now ~ t i o n temperature of the powex plant New power OUtlmt
power j a i n due to ~ cold seawater cooling Orou~-ho~ depth
Fluid k~,mattc vi~o~ty i m ~ the Omvitstional ~ t i o n
Gravitational la~isht Fluid demity
208 B.J. Hugo / e . p* ii m . tt t Y t0 r Friction factor Loss factor
Dimemionku demity distribution Dimmsiamkm pumping work Frk'tion ~ - (v*/mD') (L/H) ~ flowrate tn the p ~
Thermal eomiuctivity of fadd Vitemity of w¢~tter T ~ t u r e crave commmt
Dimemimtlem seawater tmnlm'ature in the pipe Dinmmtmti~ depth
Dimm~oQiem ~ smawater temperature at the outlet of the pipe Dimemkmku ground.hole depth.
1. INTRODUCTION
Ttm n>~ of using the tempm'ature d/ffefence between the warm mrface w a t a o f b ~ oceans and tbe deep cold lay= ret~_rning from the ~ m a i o ~ to n m a P.agktm-e,#~ heat mq#ne to ~ a k c ~ ' t y was first p c u p ~ by d'Armava] in IM! u d v m s first demonseramd by Claude in 1930. However, few research ~ had ~
around the world until the ~ ~ m . In addition to its l o w . ~ ~ , ocean deep water is the larlest nutrient reservoir for marine life, W ~ ~
froma depth below 700m cmfld be used for the growth of alsae, ~ c a ~ aad t r o w e l . The srowth rate has been p r o w to be much f a m r tima in nature ( O t k w sad Rotls, 1974). An e~mfitmatal station has been in operation on the am'th c e ~ t of St Croix, one of the U.S. V'tqlin Islands, near Puerto Rico (Otlumr t a d Reels, lSrt6). T h t ~ polyethylene pipelines, each ]800 m in length and with a 6.9-era inside d i s m m r , water from an 870-m depth at arateoflS01/min. T h ~ w a t t r l t w m e m ~ l ~ y ~ 4 k a w n up t h n y e ~ the m a l l pipes, so that it is satisfactory for marimflture ~ One of the mqpetinm~ showed a 27-fotd m over u n i c e ~ a l ~ Ilrowaiawttlftumtlmsmfsm. Comidembly rapid growth is also found for clams, European oyste~ bay ~ trod lobetm etc.
The combined ~ utifizing cold deep seawata ware IZePom~ by O t l m ~ (1976). He ~ a number of engineering alternatives w h ~ Seat tats tim cold drop seawater for the OTEC system and then use the waste seawater to Brow smfaods.
When pumping cold seawater from the deep sea t h r o o ~ a l o q ~ ~ p o w ~ is comumed in overcoming the flow friction lou and the ~ 1o~ The latter results from the demity diffettt~ between the teawattr ia tim ~ and the seawater outside the pipe, because all the water in the pipe it a E ~ i m s t ~ at the demity of the intake level whereas the demity of the water outside the pipe ~ all the way to the sea surface. On the other hand, when drawing cold s e t w a ~ from the ocean deptlu through the warmer water up to the surface, the cold ~ will be wanmd and the tempenture rise will have a larse impact on system perfm'lmuwe. A IIItat deal of theoretical work ha, been peffoamd meemly to ttedy the t e t i m i ~ s a d e m m m i m l feu/l~lity of extractiag cold deep mtwater for power I~lt-=tion (O#ltn; 19~; Watt et a/., 1977; Zener, 1977). Howeve,, little has been meafioned in dettil aboat tim
aspects of pumping cold deep seawater for OTEC, maricmlture or ~
Due to some unknown ressom, diffuse upwlUing aad ~ q 4 d t ~ at dlaliow depths are found at certain o f ~ o r e areas near eastern Taiw!m. ~ y
Modeling of pumping cold deep nutrient-rich seawater 209
seashore for mariculture applications after exposure to the atmosphere for oxygen satura- tion and warming. The low-temperature nature of the deep seawater can also ! e used for nuclear power plant cooling, to promote thermal eiticieucy or for OTEC applications. To understand this, a simple analytical model for a straight pipeline stretched directly from the r.athore into the deep-sea region has to be developed to evaluate the pumping power for drawing deep seawater up to shore and the temperature rise due to warming-up during pumping, as well as the resultant effect on the feasibility of nuclear power plant cooling (see Fig. 1). To reduce the maintenance problem of the pumping facilities, a ~ kind of piping arrangement is proposed and examined. This pipeline is similar to the first kind except that the outlet of the pipeline is open to a deep ground-hole at the seashore, so as to main- tain an elevation between the sea surface and the outlet of the pipeline and thus induce a gravitational driving force to draw up deep seawater. It is apparent that the induced flowrate will be a function of pipeline diameter, intake level, and elevation d i f f e ~ : e between the pipeline outlet and the sea surface. The calculation results presented in the present paper can be used for design purposes. For nuclear power plant cooling applica- tions, a simulation will be carried out for a nuclear power plant at the two locations on the eastern coast of Taiwan to study the engineering feasibility of replacing the warm surface seawater coolant by cold deep seawater.
~" 2 ~ Seo surfoce Y=O
×,,0
~7
Fxo. 1. Basic pipeline conliguratiorL
2. P U M P I N G D E E P S E A W A T E R T H R O U G H P I P E L I N E
The basic pipeline model considered in the present analysis is shown schematically in Fig. 1. For steady incompressible fluid flow through a pipeline, the Bernoulli equation can be used to deal with the momentum balance:
2
A(vS/2)
+ gab + / dP/p -- Wp ÷ Y [f(L/Rh)v=/2]t -~
Y-(evv=/2)t = 0,i i
1
(z)
where v is the average velocity of the fluid inside the pipe, h is the gravitational height, P is the fluid pressure, p is the fluid density inside the pipe, Wp is the pumping work to the fluid per unit mass, g is the gravitational acceleration and L is the pipe length. The fifth t ~ of (1) represents the sum of all sections of the pipeline, f is the friction factor depending on the Reynolds number and can be expressed for smooth pipes as, according to Moody (1944),
210 B.J. H u ~
f 161Re Re < 2100
f = ~ 0.0791/Re 0-=6 2100 < Re < 20,000 (2) L 0"046/Ree'= 20,000 < Re < 10 T,
where Re is defined as ~,D/v, D is the inside diameter of the pipe and v is thekiaematic viscosity of the fluid. Rh in (l) is the mean hydraulic radius. For a circular pipe, Rh --- D/4. ev is the loss factor due to fittinp, valves, and bends etc.
To simplify the analysis, the followin 8 a ~ m p t i o n s are made:
(1) Seawater is incompressible. The cro~.section of the pipeline is uniform and the pipe is straight all the way from the seashore down to the offshore deep sea rellion, as shown in Fig. 1. Therefore the average velocities of the seawater at the intake and at the outlet of the pipeline are same, i.e. ~v -- 0, and the loss factor can be i p o r e d , i.e. e v = 0. (2) The seawater in the pipeline is all at the density of the intake level. Therefore, Pl = pA = PR -- constamt, and
2
f dP/p = (P. - PO/PH.
l(3)
(3) The outlet of the pipe is at sea level, and the pipe is c/r~!~r. (4) Only one straight pipe is considered in the preaent analysis, so that
Lf (L/R,O ,,'/2], = f(L/&,),,'/2. (4)
1
From above assumptions, (1) can be written as:
Wp = I H -I- (Pl -- Pt)/Ps -I-f(L/Rh)v'/2.
(5)
Since the seawater is pumped into the atmmphefe at the outlet, the outlet pressure Pm is equal to the amlmeat premtre Po, i.e. P, = P=. Thus the intake p m m n e / ' 1 can be evaluated by the hydrmtatic relation:
H H
el ~ el "~" f p Kd Y ~ PI "~" f p ~d Y,
o
o
(6)
where p is the seawater density distribution with respect to depth outside the pipe. Y represents the depth from sea surface. Substituting (6) into (5), we get
H
nr,', = t x - f ( p l p , ) ~ :¥ + f(Ll.~J','12.
o
Modeling of pumping cold deep nutrient-rich seawater 211 Normalization of (7) yields 1 w~ = I -- f p* d y + (vs/2g)(L/H)f/Rh, 0
(8)
wherew~ ~ W~gH, y ~ Y/H and p*(y) ~ p( Y)/Ptt .
Also we define a new parameter Z as Z = 1 -- re P* dy. Here Z represents the density- 8radient-head loss depending on the density distribution. Since there e~_i_~ts thermohaline circulation at deep sea region, the variation of density with depth is generally not so smooth that a single profile p(Jr) can be approximated. Therefore, instead of direct integration, a finite difference summation is used to calculate the density-gradient-head loss, i.e.
Z = 1 -- Y Ol* A yl, (9)
i
where jSl* = (Pt* + Pi-x*)/2, and Ay: ---- y: -- Yj-l, i ~- 1, 2 . . . . Since the density distribu- tions are different in different oceans and in different seasons, Z is actually a regional and seasonal function determined from measurements. Substituting (2) for friction factor f into
(S),
we obtaini +
32 nRe, Re< 2100
w* = + 0.1582 nRe 7j', 2100 < Re < 20,000 (10) + 0.092 nRe '/s, 20,000 < Re < 107,
where n ~- (A*/gDS)(L/H). Equation (10) shows that the required pumping work to the fluid is a function of Z, n, and Re as plotted in Fig. 2. And, n is a factor depending on the v i g ~ i t y of seawater and the geometry of the pipeline.
The variation of Z-values on the eastern coast of Taiwan ranges from 0.001 to 0.002 for depths down to 1000 m. This is small, but cannot be arbitrarily ignored. If the flowrate is very small, such as in mariculture applications, Z becomes dominant. For a high flowrat~ such as in nuclear power plant cooling applications, it may be neglected compared with the frictional loss.
From (10), the total pumping power I~'p for a given mass flowrate of deep m w a t e r m c from depth H can be evaluated by the relation:
Wp = m c g I t w ~. (I1)
3. HEATING LOSS DURING PUMPING
When pumping the cold deep seawater through the pipeline, the water will be warmed due to heating through the pipe wall by the warmer outside seawater. A simple analytical model will be developed to predict the thermal loss.
212 B.J. HuA~O
Lo • io 4 , io 5 f0 6 R ,
FIo. 2. Pumping work vs Reynolds number.
By energy balance tO a differential volume of seawater inside the ~ dL, the foUo~4ng equation can be derived:
m c C p d T = U g D ( T , - - T ) d L , (12) where Cp is the specific heat of seawater, T is the mean bulk seawater ~ at L, U is the overall heat transfer coefficient across the pipe wall, 2", is the ~ dimm'bu- tion of seawater with respect to depth, and L is the position of the intake. From Fig. 1, the transformation of the coordinate yields
d L ..~ - - ( L / H ) d Y. (13)
Substituting (13) into (12) and rearranging, we obtain
Modeling of pumping cold deep nutrient-rich seawater 213
where k / i s the thermal conductivity of seawater inside the pipe, Pr ( ~ l~Cp/kF) is the Prandtl number of the seawater. Equation (14) can be solved if the temperature distribution
of seawater, T,(D, known.
In many oceans, the temperature variations with depth are so smooth that an egpomm- tial function (15), can be used to fit the measured data.
T,(Y) = T® ÷ ITs(0) -- T®] (exp -- ~ Y), (1~
where ~ is a constant depending on location and season, and T® is the temperature at infinite depth. Normalization of (14) in conjunction with (15) will give
d t / d y - ~ t = - - • t , (16) where r,(0) - T(Y) t
r,(0) - r,(H)'
r,(0) - ~ , ( r )I s
7",(o)- T,(+O
=z [1 - exp ( - ~ ~y)],
r , ( o ) - 7-. E
~ r , ( 0 ) - r Z ~ '
y ---y/H. •ffi 4LU/kyPe,
Pe ---- Peclet number = PrRe.
Solving (16) with boundary condition, t(l) = 1, we obtain the fluid temperature distribution imdde the pipe,
• E e x p ( - - V y )
+ [ 1 - - E
+ ~ E ~
D ]
t(y) ---- ~ --
I" + •
exp [~0' -- 1)],
(17)
where I' ~ ~H. From (17), the outlet temperature of cold deep seawater drawn through a straight pipeline can be determined:
CE
t(0) ~ Vo = E ÷ (1 -- E) exp (-- ¢) P -4-~ {1 -- exp[-- (P -+- ~)]}. (18)
The unity value of to represents no heating loss.during pumping which takes place in perfectly insulated pipe, i.e. U ---- 0, or ¢ = 0. The value of to is always less than 1 aad thin indicates the amount of coldness of the deep seawater remaining after pumping out o f the sea surface. Therefore the heating loss during pumping can be readily examined from the values of to. The factor ¢ has the physical significance of the overall heat transfer acrms
214 B . J . H U A N G
the pipe wall, and F represents the effect of seawater temperature distribution on the heating loss. ~ or I' is zero for a constant-temperature sea and approaches infinity for an abrupt change of temperature at the sea surface. Equation (18) is plotted in Fig. 3 to show the variation of to with F and ¢.
1.0
~ 0.5
E-I.2
II
FIo. 3. Deep seawater temperature at the outlet of the pipeline.
4. C O O L I N G O F N U C L E A R P O W E R P L A N T BY C O L D D E E P S E A W A T E R In drawing cold deep seawater through a long pipeline, power is needed to overcome the friction and density-gradient losses, and the seawater is wmmed up by the warmer seawater outside the pipe all the way up to the sea surface. The pomibility of using this warmed deep seawater as a cooling medium for a power phmt deplmda upon the flowrate and pipeline designs such as leasth, diameter and insulation material of the pipe.
C o u s i ~ a power plant odllim~y ¢ o o i ~ by ~rfac¢ mawater. According to t h ¢ ~ of thermodynamics, the replm~ment of cold deep seawater as coolant would r c d u ~ the condensation temperature of the power cycle, thus promoting thermal ¢flk-iency. As a first order approximation, one can assume that the thermal elT1ciency q is proportional to the Carnot ett~ciency, i.e.
n I - T c / T . , (19)
where WaN is the net power output of the power plant, QH is the heat added to the boiler,
Tc
is the condensation temperature, and Ts is the boiling temperature. For simplicity, we assume that replacement with cold deep seawater as coolant will lower the coudemation temperature by an amotmt of T,e -- Tb where T~ is the surface seawater ~ ,and Te is the deep mawater temperature at the outlet of the pipeline which can be evaluated by (18). The new ¢.ondeusatio~ temperature T~ then becomes
Modeling of pumping cold deep nutrient-rich seawater 215
and the new thermal efficiency 11" becomes
(21) where W * is the new output power. Here, we also assume that the new higher output power can be delivered by a properly renewed turbine generator and all the components in the power plant can be reconstructed to meet the power output increase due to lowering condensation temperature. Therefore, the ratio of the power outputs will be
' * " (T,o T¢). (22)
W',lW_,
= 1 + - T o ) I ( T H - -The net power gain by deep seawater coolant G is therefore the difference between the power increase, 1~'* t- l~'m, and the required deep seawater pumping power, if'v,
G = ( I ~ ' * - W ~ t ) - W, (23)
Substituting (22) into (23), we obtain
G = [(r,o- r o ) / ( r . -
W=.,- W.
(24)
From (24), it can be seen that the net power gain by deep seawater cooling is dependent on the outlet temperature of the pipefine, the highest and the lowest ~ t u r e s , the net power output in the original power cycle, and the pumping power consumed in drawing deep seawater through the pipeline. Associated with the previous pumping power calcula- tions, the net power gain can be evaluated.
5. APPLICATIONS FOR MARICULTURE AND NUCLEAR POWER PLANT COOLING ON THE EASTERN COAST OF TAIWAN
Taiwan is a small spindle-shaped island located in the western Pacific ocean. Ire. liminary investigaions indicate that the east coast of Taiwan is very similar to the Virgin Islands in both meteorological and oceanographical conditions. Therefore, the applications of cold deep seawater on the eastern coast for mariculture and nuclear power plant cooling will be investiBated according to the previous modeling.
Two locations on the eastern coast are selected for the present study. The results of the physical oceanographic measurements in the spring season at these locations are shown in Tables 1 and 2 (National Taiwan University, 1977). The seawater temperature distributions are first least-square fitted to (15) with the assumption that T® is I°C. The values of the exponents ~ are then determined and shown in Figs 4 and 5. The density distributions are plotted in Fig. 6.
5.1 Pumping power evaluations
From (10) and (11), we know that the pumping power required for drawing deep sea- water through a pipeline depends on the intake level, the total length and diameter of the pipeline, and the flowrate. The simulation is performed for pipe diameters D ---- 7.5, 10, 15, 50, 100, and 150 crn. The first four diameters are suitable for mariculture applications
216 B.J. HUANG
TXeLE 1. O c ~ l t A t ~ l C DATA AT STATION 30 (22 ° 45'N, 121°17'E, ommHom~ D~rANc~: 19 km)
Depth Tempecattwe Demity
m °C g/l 0 27.2 1022.1 10 26.9 1022.3 20 25.9 1022.6 30 25.8 1022.6 50 24.4 1023.1 75 23.5 1023.4 100 21.0 1024.1 125 20.4 1024.3 150 18.8 1024.7 200 15.9 1025.4 250 14.3 1025.7 300 12.8 1025.9 400 10.3 1026.3 500 8.5 1026.6 600 7.2 1026.8 700 6.3 1027.0 800 5.6 I027.1 1000 4,0 1027.2 Stoticn 30:22" 45'N, 121" 17'E 40(:) E 60O 700
3" , T ~ (Te- T~I -QY TQ,,I "C To-2~.27C /9-0.00249 m "~ 9<30. K~OOo-.--~ Fio. 4.
°
I ll
20 3O Tlmlmmtum, *C Temperature d i l l r i b u t i o n at Station 30.Modeling of pumping cold deep nutrient-rich ~=awat~ 217 T~usus 2. ~ c DATA AT STATION 31 (23°45"N,
121"461P., o m a m ~ v w r ~ : lOkm)
i
Depth T~al~'ature Density
(m) (%3 (g/l) 0 25.5 1022.9 10 25.3 1023.0 20 25.2 1023.1 30 24.7 1023.2 5O 23.9 1023.5 75 22.3 1024.0 100 20.3 1024.6 125 19.0 1024.9 150 17.7 1025.2 200 15.6 1025.7 14.1 1025.9 300 12.9 1026.1 400 10.8 1026.6 500 8.5 1026.9 600 7.0 1027.0 700 6.0 1027.2 800 5.3 1027.2 1000 4.3 1027.4 i 0 IO0 7OO coo 9o0 IO(X~ o FIG. 5. Stolton 31! 23 e 45'N, 12P46'E IIS.5 0 M l ~ u l d Too,, I°C To- 2S.5"C /9,,0.00233 m -t " to 2 o T s m ~ 0 "C
218 B.J. H U A N G o.
°I-
100- 2O0 3OO 4(30-- 5O0-- 0 A 6 0 0 - 700-- 8 0 0 - - 9 0 0 - I000 Staten 30(22"45'N,121*ITE) Station 31 (23=45'N,121°4EE) 1022 1 0 2 3 K~4 I O 2 5 IO26 Density, g/L FIG. 6. Density distribution.1028
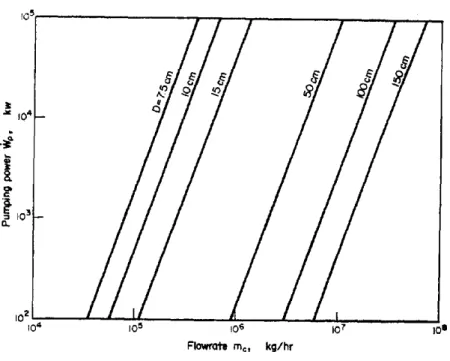
and the rest are suitable for power plant cooling. The intake levels H are taken as 400, 600, 800, and 1000 m for the present calculation. The results are shown in Figs 7-12.
It is seen that the required pumping power for each diameter is independent of the intake level at high flowrates. This is due to the fact that the dopes of pipelines in the present simulations are smaller than 0.10, therefore the pumping Imwer is, from (11), approximately independent of the intake level. For low flowrates, the density-gradient- head lou becomes dominant compared with the frictional loss, and therefore the pumping power depends upon the intake level.
The calculations show that the pumping power is less than 100 kW for pipe diameters smaller than 15 cm and mass flowrates lower than I00 ton/h which is just in the range of mariculture applications. To reduce the pumping power in nuclear power plant cooling applications the pipefiue diameter has to be larger than 50 cm.
5.3
Heating loss during pumping
Equation (18) gives the outlet temperature of cold deep seawater through a pipeline if the overall heat transfer coe/ficient U is determined. In general, the overall heat transfer coelF~ient can be evaluated by the followin8 equation:
Modeling of pumping cold deep nutrient-rich seawater 219
where
h i = convective heat transfer coefficient at pipe inner wall,
h e = convective heat transfer coefficient at pipe outer wall, r I = inside radius of pipe,
re = outside radius of pipe,
kp -- thermal conductivity of pipe material.
The convective heat transfer coefficient at the inner wall can be evaluated by the equation for forced-convection (Dittus and Boelter, 1930),
f4.36, Re < 2100
Nul = ~0.023 Ree"pr °'', 2100 < Re (26)
where Nu a is the Nusselt number defined as hiD/k/. The heat transfer at the outside wall is determined by the tidal current which varies from location to location in the sea and is very difficult to measure. However, the pipeline is usually laid out alongthe seabathymetry so that the effect of tidal currents can be neglected and the heat transfer at the outside wall is dominated by free convection. Since the slope of the pipeline is in general very small, the following empirical equation for free convection on a horizontal cylinder can be approxi- mated to evaluate the heat transfer coefficient at the outside pipe surface (Churchill and Chu, 1975): N . . I , . = 0.60 + 0.387 + ' (27) io-I • ,~ io-2 ~. , 0 7 _ io-" I I io ~ to 3 F r o . 7. Stotion 30:23°45'N, 121*46'E (Off-shore distance IOkm)
H,, 4 0 0 m 6 0 0 m 8 0 0 m I 0 0 0 m Dt " 7 . 5 cm D== lOom I ) 3 - 15cm D4" 50cm Ds" IOOcm Dt,= 150cm I 104 i05 Flowrote me, k g / h r P u m p i n g p o w e r vs mass flowrate. IO s
B. J. HUANO
for 10 -~ < OrPr < lO ts, where Or = O r a s h o f number based o n film tempmmtm~, and Nue is the Nusselt a m b e r d e l m t as ~ D d k I.
~ | ,,,
- Stot~
!
~,~
/
10"~3
j04
H - 4 0 0 m - - T - soom O 0 0 m I O 0 0 m i I ,i K) 5 lo 6 to 7 ' FIo~m~e m c,I~/hr
Fro. 8. Punq~nI power w m ~ s fiowmw.jO g
!
~,o~
,o 2 io 4 S ~ t J o nI I ,I/l
/
F I O . 9. , , , |, ,,'/
j
, /
| | I , , . ° J ~o s ~o 7 to • F'loWyOto m ~ ,kg/hr
P u m p i ~ p o l r vs r a m s ~ , w m l m .Modeling of pumping cold deep nutrient-rich seawater 221 If t h e pipe is n o t well-insulated, e . g . b a r e m e t a l pipe, the th,~mal resistance through the wall is nql/s/bl© compared with the convective heat transfer, and therefore
rJ = h,~/(h, +
+o).
(28) jo ~io 4
lid. ~
I0"D
~
22° 45'N,121"
ITE
,~l~r#7/
- N - 4 0 0 m A ~ w , f a f / / . . . .600m
/ A ~ I P ~ ~ ~ ~ ~ 3 0 m/ / / 2 "
. . . .
.~r/r/~
O, " 7.5 cm
f Os = IOOcmDe" 150¢m
• , I I ,,1 ] ,,l, tO z, Io 4 10 5 I , , .~ I01 Io'l io 3.... N'l~ i
FIowroto m©, kg/hri~G.
11. p o w e r v s m a s s f l o w r a t e .222 B . J . HUANG io 5 ]= = ~0 4
|
c '~ 10 3 o., io 2 Io 4!
!
10 5 FiG. 12.,/
/
IO 6 Flowrcl'e me, k g / h r/ / /
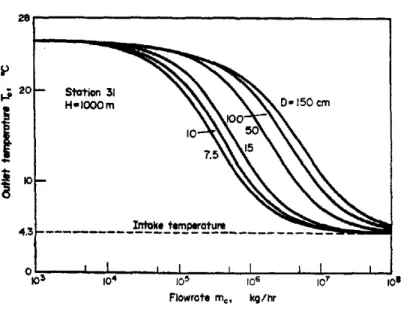
10 7 10 0 P u n ~ n g p o w e r vs m a s s flowrate.A s s o c i a t e d w i t h the previous data, the temperature rise is calculated for pipe diameter D = 7.5, 10, 15, 50, 100 and 150 c m , a n d the intake level H --- 800 a n d 1000 m. T h e results are s h o w n in Figs 13 and 14.
? 2C 4 -
~
' ° 0 5.E i I i I I I I I . i _ to 3 ;o 4 ios ]0 6 10 7 10 8 R0wmt'e me, k g / h rModeling of pumping cold deep nutrient-rich seawater 223 P
i
20 4.3 l - Station 3 Intoke t e m p ~ o t u n e ~ ~ , ,,I I ,__l , I i I i0103
10 4 I0 5 fO 6 I0 r lO II FlowroJ'e mc, k g / h rFIG. 14. Outlet temperature vs mass flowrate.
For a w e U ~ t e d pipe, the heat resistance through the insulation layer is so high that the ovendl h u t tr-anffer coeffufient U approaches zero, and the outle~ ~ t u r e of the deep mawater is the uJne as the intake tempentture as shown in Fills 13 and 14. It is
that the cold teswater will be considerably warmed up as the flowrate is too small. H i l h nowrata e~mld reduce the heating lou, but the pumping power would be too large to be applicable.
5.3 Fatsibility of maclear power plant cooling applications
Using (24) and previous simulation results for pumping power and heating loss, the feadbility of nuclear power plant cooling applications can be assessed. The nuclear power plant ~iacted for the present simulation is the unit now installed at Chin Shah in northern Taiwan. This power plant now delivers a net output 1~'~,, of 635 MW at the highest cycle temperature T H of 288 °C, the condensation temperature T c of 47 °C, and the cooling water flowrate mc of 3.3 × 10⁷ kg/hr.
The net power gain by deep seawater cooling O is calculated for two limiting cases: weU-insulated pipeline and bare metal pipeline. Tables 3 and 4 show the variations of net gain with pipe diameter and intake level. It cart be seen that a reasonable positive p i n van be obtained only for pipes with diameters larger than 150 crn and intake levels deeper than 400111.
6. GRAVITATIONAL FORCE-INDUCED FLOW SYSTEM
To eliminate the maintenance problems of the pumping facilities, a new piping arrange- merit is proposed and examined. This pipeline is similar to the first kind except that the outlet of t h e pipeline is open to a deep ground-hole at the seashore, thus maintaining an elevation between the sea surface and the outlet of the pipe to induce a gravitational driving force to draw up deep seawater (see Fig. 15).
224 B . J . HUANG
Ruwvok
L
FIO. 15. Gravitational force-induced flow system.
Applying the Bernoulli equation, (1), to the modified pipeline model with the same conditions, the momentum equation can be derived:
Z - - r + 3 2 n R e = = 0 Z -- r + 0.1582 nRe ~l` __-- 0, Z r + 0.092 nRe tls = 0, Re < 2100 2100 < Re < 20,000 20,000 < Re < 10L
(29)
Ths induced flowrate can thus be d e t m M d in terms of r, Z and n. Simce the emqly ecpmtim mmaim the mine u in the i x e v i o ~ ca|e, the outlet temperatuee te ¢|m be dmived:
c E e x p ( - - r r ) [ ¢ E e x p ( - r ) ] t o m E - - r ' + ¢ + l - - E + r + ¢ e x p [ e ( r - 1)], (30) T A I I I . I I 3 . N I l T ~ G A I N ( ~ l l ~ ~ ~ S L l k W A T I [ ~ C O O L / N Q A T S T A T I O N 3 0 ('~e4~ ~N, 121°17"E) i ii i i i i , i H i i i ii i i i HI i i i i i Jl i FJmm Imml prim /'/(m) D(cm) 400 6OO 8OO ]000 7.5 --1.1850 × 10~MNV - 1 . 1 8 5 2 x 1 ~ --1.1864 x 1 ~ - - I . I U l × 10*MW 10 - 2 . 9 7 8 7 × 10' --2.9787 × l(P --2.9816 × 10' --2.9865 × I(P 15 --4.2.$40 x I 0 ' --4.2540 x I 0 ' --4.2582 x I0" --4.2640 x I 0 ' 50 --1.2"/56 x 10s --1.2684 x 10 a --1.2655 x 10* --1.2654 x 10* 100 --8.91188 -- 1.6730 2.$100 8.$1EI0 150 30.294 37.5110 41.879 45.833 i i i Well-tmu~ted pipe a (in) D (an) 400 600 800 100o 7.5 --1.18.51 × I O ~ [ W --1.18.52 × l O V M W --1.1864 x I O t M W - I . I U l × IO'-MW 10 --2.9787 x I06 --2.9787 x 10 ~ - - 7 9 8 1 6 x 10" - - 2 . 9 8 ~ x t 0 ' 15 --4.2540 x 10⁸ .-4.,~M0 x 10 ~ - - 4 . 2 5 8 2 x 10⁶ --4.2~10 x 10 j 50 --1.2741 x 10 s - - 1 . 2 6 0 x 10' --1.264.1 x I0" --1.2620 x !0" I00 --6.1697 1.1780 5.1560 9.0150 ISO 34.300 41.64.7 45.667 ,$9.S118 i i i i i ii
Modeling of pumping cold deep nutrient-rich seawater 225
T~BLE 4. NLrr POWER O~N (MW) eY DEEP SEAWATER COOLING AT STATION 31 (23°45'N, 121°46'E)
i i i
Bare metal pipe
H (m) D ( ~ n ) 400 600 800 1000 7.5 --2.2493 x 10TMW - 2 . 2 4 8 7 X 10~MW --2.2477 x 10~MW --2.2487 x 10TMW 10 - 5 . 6 5 3 9 x l 0 s --5.6513 x 10 s --5.6503 x l 0 s --5.6516 x l 0 s 15 --8.0756 x lO s --8.0705 x lO s --8.0698 x IO s --8.0705 x lO s 50 --2.4629 x 10 s --2.4533 x 10 s --2.4483 x 10' --2.4466 x l 0 s I00 --58.205 --49.673 --45.273 --42.641 150 16.893 25.077 29.515 32.329 i ii iii i Well-insulated pipe H (m~ D ( ~ ) 400 600 800 1000 7.5 --2.2493 X 10⁷MW --2.2487 x 10~MW --2.2477 x 10TMW --2.2487 x 10⁷MW 10 --5.6539 x l 0 s --5.6513 x l 0 s --5.6503 x l 0 s --5.6516 x l 0 s 15 --8.0756 x l0 s - 8 . 0 7 0 5 x l 0 s --8.0698 x l 0 s --8.0705 x l 0 s 50 --2.4609 x 10' --2.4506 x 10' --2.4456 x lO s --2.4439 x lO s 100 --53.884 --44.598 --40.418 --38.204 1 50 22.919 32.182 36.349 38.576 i i i i
w h e r e r == BIH. A calculation was carried out at Station 30 to check the induced mass
f l o w n ~ and the outlet temperature. Figure 16 preaents the variations of induced flowrate with the ground-hole depth and the intake level for each pipe diameter. Figurm 17 and 18 show the outlet temperature of the deep seawater. It is seen that, to obtain a high flowrate for nuclear power plant cooling, the diameter of the pipe should be larger than 150 em and the depth of the ground-hole should be deeper than about 75 m. This will not, in practice, be economically feasible. However, for low flowrate applications such as marieulture, the use of a gravitational flow system is possible as the required ground-hole will not be too
deep.
I 0.5 i 0.1 :~ 0.05 • ~ 0.01 I 0.005 -D.7.Sc m
~ofioll ]50 11 I I ~11/]11 I It/y,///,,. ,, "?
/,,,,/
Is'l{ i
/ ' 2V J~
/ ' /
/'
# I / I • 1/ Z¢I'//,Y'/,,/s
,'
,
g/illS
/,i
o.OOlo ~ I ,. I I I l I I 10 4 IO s 10 6 I0 ? IO II MOlls flowroill m c, kg/Noo.=
226 B . J . HUANG 28 20 .u 5.6~ FIG. 17. Stotion 50 IU5~7"5 cm H,, 8C0 m 1 ! J I l l l l l I I I l i l l l t I I I i [ [ t l
°o.oot o.oo5 o,o~ o.o,s o.~ o.3
Ground-hole depth, r (- B/H)
Outlet tm~qpecature vs ~ d4pth for gravitational system.
7. D I S C U S S I O N A N D C O N C L U S I O N
A simple theoretical model is developed to a ~ s the technical feasibility of pumping cold deep nutrient-rich wawater for maficultare, and for nuclear power plant cooling. The model auumes that the pipeline is straight and laid out directly to the intake lwel in the deep sea region. However, the bathymetrical map of Taiwan shows that there is a very narrow ~ along the east coast. Generally the continental slope drops off to 1000 m wi~in 10 km from the coast. At several points off the coast, the 1000 m contour is even closer, within 2 km. Therefore a underwater straight pipeline cannot be constructed to rcRch the deep sea region. Instead a stepwise pipeline, as shown in Fig. 19, is more likely to be built in practical applications. Thus the previous calculation models should be modified by successive stepwise calculations using equations of similar form. Under these conditions, the pumping work equation becomes, from (1),
Wp = ~ [t~h, + ~ dP/p, + ~(Lt/Rh),v'/2 + evtVt2/2], (29)
l m l L i
and the temperature variation at the ith section becomes
P -2 FIG. 18. 2E 2C - 10-- 4 0
FIo. 19. Real piping configuration. S~ion 30
H " I 0 0 0 m
I I t I ' * ' ~ 1 ~ * ~ I , , , , | t ~ ~ I , ~ , ,
0 . 0 O 5 0 . O i 0.05 0 t 0.3 Greuncl-hole depth, rI,,e/H)
Outlet temperature vs hole depth for gravitational ~ t e m . See a u r e a t e
228 B.J. HUANG
with the boundary conditions:
for i -- 1, Tx(0) = T H at Xx = 0 Pl(0) = OH at Xx = 0.
The detailed computations can be accurately achieved when the bathymetrical survey around the application site is completed.
The present analysis for two locations off the east coast o f Taiwan and for two kinds o f
piping
models leads to the following conclusions:1. The pumping power required to draw seawater from the deep sea is always less than 100 kW (134 h.p.) for pipe diameters smaller than 15 cm and mass flowrates lower than 100 ton/hr, which is suitable for mariculture application.
2. Replacing warm surface seawater by cold deep seawater as nuclear power plant coolant is technically feasible for pipes with diameters larger than 150 cm and intake levels deeper than 400 m.
3. The gravitational force-induced flow system is not applicable for nuclear power plant
cooling applications,
bet is applicable for mariculture applications.4. For accurate predictions, the bathymetrical survey around the applicattion site should be completed and the successive stepwise computation for a real pipeline geometry is required for desisn work.
5. For further practical applications, an economical feasibility invegigation is neoemry.
Ae.know/~ffements----'I'h¢ author would like to thank Mr B. H. Chao for his m i m m ~ in nunm'k~ ¢omi~ta- tion. The present work is partially supported by the National Science Council of the gelmbll¢ of China.
R E F E R E N C E S
CHUgOtn.L, S. W. and Clw, H. H. S. 1975. Correlating equations for laminar and turbuleat free ¢onv~tion from a horizcatal qdim~. Int. I. Heat Mass Tramfer 18, 1049.
Ct.Atn~, O. 1930. Povce¢ from troCkati seas. Mech. Eagaf $2, 1039.
D~rru~ F. W. and Bom, TL~, L. M. IC 1940. Univ. Calif. Pubis Engng 2, 443.
GglmN, O. M. 1971. The ocean as a rmcwabl¢ source of ¢¢aa'gy. J. ~ Ind. Team. ASME 17, 897. MOODY, D. F. 1944. Team. Am. So¢. Mech. Engrs 66, 671.
NATIONAL TABVAN UNrv~iuRTY. 1977. Oceam~eal~C data of the sea jamum¢li~ Taiwan. Special Publn. No. 15.
O'rl.nd~, D. F. 1976. Power, fresh water and food from the sea. Mech. Engng 27,
OcmmR, D. F. and Rov.~, O. A. 1973. Power, fresh water, and food from cold deep sea watax. Science, N.Y. 182, 121.
D. F. and Ro~Ls, O. A. 1974. Mar. TechoL Soc. J. 8, 40.
WA'rr, A. D., MArrows, F. S. and HA~L~WAV, R. B. 1977. Open cycle ocean thermal enerffy conversion. A preliminary enfin~rinf emluation. U.S. Departm~t of Energy, ALO/3723-76/3.