國立高雄大學國際商業管理碩士學位學程(IMBA)
碩士論文
巴塞爾協定
III 對銀行股利政策是否有影響?美國商業銀行實證
Does Basel III Affect Banks’ Dividend Policy? Empirical
Evidence of US Commercial Banks
研究生:梁尹洁 撰
指導教授:陳怡凱 博士
Does Basel III Affect Banks’ Dividend Policy? Empirical
Evidence of US Commercial Banks
Advisor: Yi-Kai Chen, Ph.D. Department of Finance National University of Kaohsiung
Student: Yin Jie Liang
International Master of Business Administration National University of Kaohsiung
Abstract
This paper examines the effects of new capital requirements of Basel III on dividend policy using differences-in-differences approach with the panel analysis of 35,437 observations in the United States over the period 2011 to 2015 which are the years after the announcement of the capital proposal of Basel III. The analysis indicates that dividends payout ratio and propensities fall when banks are preparing to meet the Basel III capital requirement. However, the impact of the higher capital requirement of Basel III on dividend payout is more pronounced for G-SIBs & D-SIBs in the short period. Findings of this study have importance valuable for bank managers, shareholders and investors. The increase in the capital requirement by Basel III will ultimately make banks become a safety and soundness in the future. It will lead to banks’ profitability and stability over the years. Even if the performance of the economy is slow, the stability of bank system will be able to sustain the confidence level of investor.
Table of Contents
List of Figures ... iv
List of Tables ... v
Chapter 1 Introduction... 1
1.1 Background and Incentives ... 1
1.2 Objectives of the Research ... 6
1.3 Expected Contributions of Study ... 7
1.4 The Structure of the Research ... 8
Chapter 2 Literature Review ... 9
2.1 Dividend Theories ... 9
2.2 Banking Dividend Literature ... 11
2.3 The Impact of Basel III on US Bank ... 13
2.4 The Impacts of Basel III on Bank Performance ... 13
Chapter 3 Data and Methodologies ... 16
3.1 Data ... 16 3.2 Variables ... 16 3.2.1 Dependent variables ... 16 3.2.2 Independent variables ... 16 3.2.3 Control variables ... 22 3.3 Differences-in-Differences (DD) Methodology ... 25
Chapter 4 Results and Discussions ... 29
4.1 Summary Statistics ... 29
4.2 Pairwise Correlation and Correlation Matrix ... 31
4.3 Empirical Results ... 33
Chapter 5 Conclusions ... 38
List of Figures
List of Tables
Table 1: Basel III Capital Requirement (as % risk weighted assets) ... 3
Table 2: Timeline of Basel III Capital Phase-in Arrangement (in percentages) ... 4
Table 3: US Banks’s Main Basel III Components—Capital Ratios and Targets Capital Ratios (as of Q2 2010) ... 14
Table 4: The List of US D-SIBs (as of March 2014) ... 18
Table 5: The List of G-SIB (2014 & 2015 updated) ... 19
Table 6: Indicator-Based Measurement Approach ... 21
Table 7: List of US G-SIBs and D-SIBs in 2014 ... 22
Table 8: Describes the Definitions of All Variables ... 25
Table 9: Summary Statistics for All Sample ... 30
Table 10: Summary Statistics for G-SIBs and D-SIBs ... 30
Table 11: Summary Statistics for Non-G-SIBs and D-SIBs ... 31
Table 12: Pairwise Correlation and Correlation Matrix ... 32
Table 13: The Effect of Dividend and Dividend Payout Ratio ... 34
Table 14: The Effect of Dividend per Common Stocks and Change in Dividend per Common Stocks ... 37
Chapter 1 Introduction
1.1 Background and Incentives
Recently, regulators and investors pay more attention to commercial bank dividend payout, especially since the year 2007 over the financial crisis. In fact, Boldin and Leggett (1995) have disputed that retained earnings were the primary cash resource of the U.S. banks after the financial crisis. If banks want to come out of the crisis, they need higher capital ratios, and stronger profitability was able to expand lending more. People trust that banks will have the money when they go to get it because banking is a business providing financial services to consumers, businesses, and governments. The subprime mortgage crisis happened in the United States in the year 2007. It continues to progress as the world financial crisis. In this crisis, too much reliance on off-balance sheet operations of banks operating problems has emerged, like Bear Stearns, Lehman Brothers and the investment bank Merrill Lynch went bankrupt. The government subsidized some large banks during 2008 financial crisis because of the issue of too big to fail.
People began to think about the importance of banking supervision, internal auditing, market disciplines, and vulnerability and negative externality problems in the financial system when the world might face the financial crisis again especially in the global market. Basel III is a program of significantly revise existing capital adequacy framework was announced by the Basel Committee on Banking Supervision (BCBS) in September 2010 and fully implemented in 2019. BCBS and Financial Stability Board (FSB) also defined and specified targeted Global Systemically Important Banks (G-SIBs) to prevent those large banks from failures. G-SIBs are likely to be imposed higher
supervision and capital adequacy standard than ordinary banks. Those strings are expected to avoid the occurrence of the systemic risk of global financial markets. The Federal Reserve Act also ask banks to keep their money in reserve with a certain percentage, so that they would not be a shortage when everyone is going to withdraw their money at the same time. Moreover, Federal Reserve included the list of Domestic Systematically Important Banks (D-SIBs), which are those banks not being big enough for G-SIBs status but still with high sufficiently domestic systemically importance making them subject to the most stringent annual Stress Test (USA-ST)1.
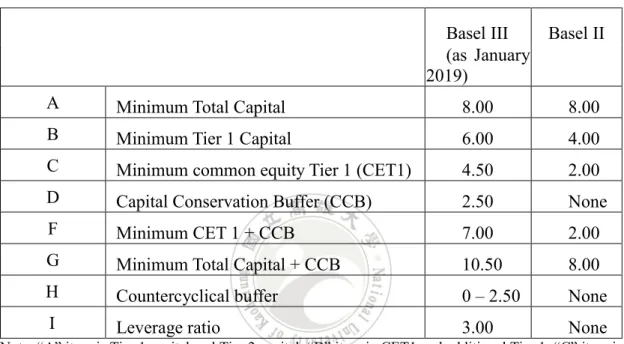
In fact, Basel III is a regulatory structure on bank capital adequacy, stress testing, and market liquidity risk. The banking regulatory requirements also significantly improved capital adequacy requirements; reduce the "too big to fail" systemic risk which brings moral hazard; strict with the capital deduction limit; enhancing risk coverage; requiring banks to increase capital buffers; provide liquidity coverage monitoring indicators to strengthen liquidity management. Comparison with Basel II, there are several changes in the definition of capital2, minimum capital requirements,
risk coverage, and leverage ratio and liquidity measures. Table 1 shown that the capital requirements (as % risk weighted assets) of Basel III and Basel II. First of all, the minimum Common Equity Tier 1 (CET1) as a percentage of the risk-weighted asset will increase from 2% to 4.5%. Create buffers in good times that can absorb shocks in periods of stress. There are two types of buffers are introduced. First is Capital Conservation Buffer (CCB) additional 2.5%, bringing the total capital adequacy ratio to 10.5%. This capital buffer can be used to conserve a bank’s capital. When bank did not meet the buffer requirement, automatic safeguards apply to limit the amount of
1 Any banks in the US with more than $50 billion in assets must take the annual Stress Test (USA-ST).
This test is an examination of what would happen to a bank if it ran into trouble.
dividend and bonus payments it can make. Second is a countercyclical buffer to limit excessive credit expansion. The buffer will vary between 0% and 2.5% of CET1. The leverage ratio computed as Tier 1 capital divided by the total of on and off-balance assets less intangible assets, was capped at 3%.
Table 1: Basel III Capital Requirement (as % risk weighted assets)
Basel III Basel II (as January
2019)
A Minimum Total Capital 8.00 8.00
B Minimum Tier 1 Capital 6.00 4.00
C Minimum common equity Tier 1 (CET1) 4.50 2.00
D Capital Conservation Buffer (CCB) 2.50 None
F Minimum CET 1 + CCB 7.00 2.00
G Minimum Total Capital + CCB 10.50 8.00
H Countercyclical buffer 0 – 2.50 None
I Leverage ratio 3.00 None
Note: “A” item is Tier 1 capital and Tier 2 capital; “B” item is CET1 and additional Tier 1; “C” item is CET1 includes qualifying common stock and related surplus net of treasury stock, retained earning, accumulated other comprehensive income, plus or minus regulatory deduction or adjustments as appropriate, and qualifying CET1 minority interest
Source: Subbarao (2012)
Banks are giving time to implement these changes. The Basel Committee has outlined phase-in arrangements in Table 2 below. The minimum common equity and Tier 1 capital ratios will be increasing over two years beginning in January 2013, and fully increases taking effect in January 2015. Then, followed by a three-year phase-in starting in January 2016 of the capital conservation buffer, with full 2.5% buffer requirement taking in January 2019. This buffer must consist mostly of tangible common equity. According to Basel III, regulators should forbid banks from
distributing earnings, dividend payments, and salary bonus payments when banks have depleted their capital buffers. The capital conservation buffer would increase in increments of 0.625% annually on January 2016, until rising to 2.5% by January 1, 2019. Also, the deduction from Tier 1 capital of excess minority investments in financial institutions, mortgage servicing rights, and certain deferred tax assets will be phase-in over a five-year period in 20% increments beginning in 2014 to emphasize the quality of capital
It is possible that banks will be more or less profitable in the future due in part of these regulations. This study focuses on the effect of increasing capital adequacy. There are several ways to increase the capital base. First, banks can issue new equity raising the capital. When banks issue the new capital from external resources, the cost of funding will high. There was quite expensive and more difficult for banks to raise the new capital, especially the banks have poor performance and lower levels of capital. The rate of return will decrease at the moment when banks need to encourage enhanced investment to rebuild and restore capital buffers.Other ways, banks might decide by a reduction of credit supply (Hyun and Rhee, 2011). However, policy makers do not like a reduction credit availability in an economic crisis because there are fears that an adverse effect on bank lending could hurt the economy activity in the further. It also will affect the daily operation of banks, directly influence the performance of banks and then indirectly affect the dividend policy.
Table 2: Timeline of Basel III Capital Phase-in Arrangement (in percentages)
Phases 2013 2014 2015 2016 2017 2018 2019
Leverage ratio Parallel run 1 Jan 2013 – I Jan 2017 Disclosure starts 1 Jan 2015 Migration to Pillar 1
Minimum common equity capital ratio (row 1) 3.5 4.0 4.5 4.5 4.5 4.5 4.5
Minimum Tier 1 capital 4.5 5.5 6.0 6.0 6.0 6.0 6.0
Minimum total (Tier 1 + Tier 2) Capital (row 3) 8.0 8.0 8.0 8.0 8.0 8.0
Capital conservation buffer (row 4) 0.625 1.25 1.875 2.5
Minimum common equity plus capital
conservation buffer (sum of row 1 & row 4) 3.5 4.0 4.5 5.125 5.75 6.375 7.0
Minimum total capital plus conservation buffer
(sum of row 3 & row 4) 8.0 8.0 8.625 9.25 9.875 10.5
Phase-in of deductions from CET 1* 20 40 60 80 100 100
Capital instruments that no longer qualify as
non-core Tier 1 capital or Tier 2 capital Phased out over 10-year horizon beginning 2013 *Including for deferred tax assets, mortgage serving rights and financials.
The last ways for banks to improve their capital is by the retention of profits and reduce or even omitting dividend payments. Lower dividends payout can contribute to banks' ability to use retained earnings to build capital. The Bank of China (Hong Kong) was flagged cut the dividend payout ratio from 60 per cent to 70 per cent previously to the recent year 2014 would be 40 per cent to 60 per cent, because of increased capital requirements from Hong Kong Monetary Authority and the Basel III international standard. While based on the ways above to increase capital base and improve capital quality, what the choice of US commercial banks? No matter what ways, it will bring effect to dividend payout. This study is to discuss the dividend payout policy being affected by the new capital requirement of Basel III.
Boldin and Leggett (1995) have argued that the dividend policy of the bank holding company is a signal of their quality and retained earnings is the primary source for the bank industry to raise capital. However, Bessler and Nohel (1996) have shown that U.S bank managers were unwilling to cut the dividend in the 1980s even with suffering losses is because they are afraid that investors and financial analysts discontinue the relationship when negative information is released. More recently, Basse et al. (2014) have shown that dividend signaling and dividend smoothing are not relevant economic phenomena with the empirical evidence from the European banking industry. Also, Grullon et al. (2005) have shown that dividend policies were not strongly associate with performance.
Furthermore, Miller and Modigliani (1961) demonstrate that the dividend policy has no effect on the price of the company’s stock or its cost of capital. According to them, the dividend policy is irrelevant if the company’s capital investments and debt policy were regular. Thus, the dividend payments can just be financed by a combination of excess retained earnings and new equity financing if required. While, the government
capital regulation may also affect the payout policy of banks (Bessler and Nohel, 1996). Banks would consider cutting or omitting the dividend to improve its financial strength and to meet regulatory capital requirements of the government. However, the dividend policy depends on macroeconomic conditions affect the capital requirement.
Typically, when making a dividend decision, the company tends to balance the needs of future investments and the profit expectation of shareholders. There is a tradeoff to make the dividend policy and the future investment plan. Al-Twaijry (2007) indicated that the dividend policy is affected by the patterns of the past dividends payment trend, the stability of earnings, and the current and expected future earnings. High growth firms will not pay a significant amount of bonus from their income to shareholders because they need profits to expand their business or sustain business growth.
Given this divisive discussion about dividend policy, the study collects and analyze the relationship between capital requirement regulation and bank’s dividend payout. The study split the sample into two group. One group identified as US commercial banks under the list of G-SIB & D-SIB and another group as other US commercial banks. Basel III will be implementation on 31 March 2019, before that, there have phase-in arrangements parallel run start 1 January 2013 – 1 January 2017 and disclosure starts 1 January 2015, the study split into several periods following the arrangements.
1.2 Objectives of the Research
This study assesses how the new capital requirements of Basel III affect the dividend policy and dividend payout of US commercial banks. To our knowledge, no
paper tackles this question in such way. The existing literature on Basel III focuses rather on the long-term impacts in the term of fluctuations in spreads, output and global economic performance (BCBS, 2010a; Cosimano and Hakura, 2011). The objective of Basel III capital proposal is to make banks safe and sound. However, when the quality and quantity of bank capital improve, the weighted average costs of equities is increasing. The supervisory authority of banks will be more willing to deregulate and let banks involve in more activities because of the capital enhancement in quality and quantity. They both might affect banks’ profitability positively or negatively. Therefore, banks’ profitability might change their dividends and dividend policy when Basel III is implemented. As no specific data is yet available for cost or revenue effect when increasing the capital base introduced in Basel III, the objective of this paper is to examine the potential impact of Basel III on bank dividend policy in the United States.
1.3 Expected Contributions of Study
The expected contributions of this study can be categorized into three aspects. They are in the points of views in bank supervisory authority, bank management, and potential bank investors and bank shareholders. Regarding bank supervisory authority, the results of this study can be the reference for the timing and speed to regulate bank capital level to meet the requirement of Basel III before 2019 with less adverse effect on performance. Regarding bank management, the results can be the reference for the management to make dividend policy and decide the amount of dividend payout before 2019 Basel III. Moreover, the results can also be the reference for the bank shareholders and potential investors. Because of the impact on bank dividend payout and its policy by Basel III, shareholders can decide whether to sell or buy shares. The potential investors can choose to invest or ignore the bank stocks before 2019.
1.4 The Structure of the Research
The remains of the paper order as follows Section 2 reviews existing literature on dividend policy and the impact of Basel III. Section 3 discusses our sources of data and the methodology. Section 4 presents summary statistics of our variables and discussion finding. Finally, section 5 discuss the implications.
Chapter 2 Literature Review
Researchers have been instructed to much attention to identifying the factors of dividend payout in the past several decades. Finance scholars have involved in building the theory about factors may be important in determining the dividend payout. The study hypothesizes that the regulatory pressure, in the form of more high capital requirements for G-SIBs & D-SIBs, is likely to have a significant influence on the bank dividend payout. In this section, first, review the dividends theories literature briefly. After that review major contributions to bank dividend policies’ research and define our hypothesis.
2.1 Dividend Theories
To date, researchers have suggested signaling, life-cycle and agency theories based explanations of dividend payout. For example, dividend signaling hypothesis referred as "information content of dividend" by expected managers share private information about the firm's attributes. Management can use changes in dividend as signal information to the market without revealing the details that could be useful to competitors. However, any dividend that contains private information will adequately reflect the share prices in an efficient market. Allen and Michaely (2003) and Brav et al. (2005) indicate that signaling should most benefit young firms which are least likely to pay dividends. By Leary and Michaely (2011) the companies facing more asymmetric information pay out less. The evidence is uncertain to whether future unexpected earnings or future risk attitude can be estimated from dividend behavior. However, Miller and Modigliani (1961) were published the seminal paper on the theory
of dividend policy. They have disagreed with the dividend signaling theory. Instead, they showed that dividend policy is irrelevant to the value of the firm. In their study, They also argued that dividend payment should not have any impact on the shareholders' value since there were not have tax and any transaction cost occurred. Therefore, they found out that dividend policy does not affect firms’ value. Unfortunately, this condition is impossible happens in the real world because changes in dividend policy led to changes in share prices.
Second, firms’ life cycle theory of dividends suggests that the pattern of dividends’ payout, generally, changes in a firm’s life-cycle. The empirical studies of Baker and Powell (2000), Baker et al. (2002), and Brav et al. (2005) findings that the most important factors influencing a firm’s dividend policy are the level of current and expected future earnings and the pattern or continuity of past dividends. Damodaran (2015) indicated that age and size are often found to be useful predictors of dividend payout, perhaps reflecting a lifecycle influence.
Next, agency theory based explanation of dividend policies suggests that dividend policies address agency problems between corporate insiders (such as controlling shareholder or owner managers) and outsider shareholders. If firms retain a lot of profits, then firm insiders may easily commit excess funds to expensive projects or can shift for personal use. Therefore, outside shareholders prefer dividends over retained earnings to reduce this agency problem. Brockman and Unlu (2009) found that managers use dividend policies to reduce agency cost of debt. However, nearly 90% of executives survey in Brav et al. (2005) rejecting the view of payout policy as a self-imposed discipline to counter agency concerns.
2.2 Banking Dividend Literature
Dividend in the context of banks has been addressed to some extent previously considered signaling, agency and regulatory hypotheses based explanations of bank dividend payout, besides identifying some level bank characteristics as significant determinants of dividend payout.
For signaling theory, Filbeck and Mullineaux (1999) and Boldin and Leggett (1995) tested the signaling hypothesis, and the evidence indicates that dividends as a signaling mechanism by banks. These studies do not account for the influence of regulatory pressure. Abreu and Gulamhussen (2013) found that managers of banks pay a dividend for indicating their future growth opportunities, support the signaling hypothesis.
Agency theory based explanations argue that dividend policy can solve the agency problems between managers and shareholders. Theory holds that inside ownership can reduces the agency problem. Insider have less need for dividends, they could receive compensation through other non-dividend payment forms. Dickens et. al. (2002) found empirical evidence that US bank holding companies with a higher percentage of insider ownership pay a lower amount of dividends, consistent that banks with fewer agency problems can pay fewer dividends. Conversely, a firm operated by managers without ownership interest may pay higher dividends. Similarly, Abreu and Gulamhussen (2013) found that the bank holding companies which are difficult to monitor will pay out higher dividends to counterbalance the increased need for monitoring. To test the agency hypothesis, Theis and Dutta (2009) examined the percentage of common stock held by insiders, assuming a negative relationship between insider ownership and dividend payout due to the reduced monitoring costs associated with higher insider ownership. Their findings provide evidence of a non-linear
relationship between insider ownership and dividend payout.
Recent evidence on the relevance of Fama and French (2001) characteristics of dividend payers (size, profitability, and historical growth opportunities) in the banking sector is mixed. However, Theis and Dutta (2009) did not find support for the positive relationship between size and dividend payout in a sample of 99 U.S. bank holding companies. Their findings suggest that size impacts dividends negatively while profitability and investment opportunities have no significant impact. On the other hand, Abreu and Gulamhussen (2013) used a sample of 462 publicly traded US bank holding companies over the period from 2004 to 2009 and support the Fama and French (2001)’s characteristics of dividend payers for banks by finding that larger, low growth and more profitable banks pay more dividends. Similarly, Collins et al. (1994) found a statistically significant inverse relationship between growth opportunities and dividend payout in a sample of 104 U.S. bank holding companies.
There are some studies which examine regulatory hypothesis for bank dividend policies. For example, Theis and Dutta (2009) and Abreu and Gulamhussen (2013) proxy regulatory pressure with capital adequacy ratios and find that banks having higher capital adequacy ratios pay more dividends. In this paper, test the regulatory pressure hypothesis, that is US G-SIBs & D-SIBs face more pressure than others ordinary banks from BSBC and Federal Reserve Bank for increasing capital levels by retaining more profits. And as a result, G-SIBs & D-SIBs pay less dividend relative to common equity when they were preparing for higher common equity tier 1 ratio. Further, the study examines the relevance of Fama and French (2001) characteristics of dividend payers for United State banks over the period 2011-2015.
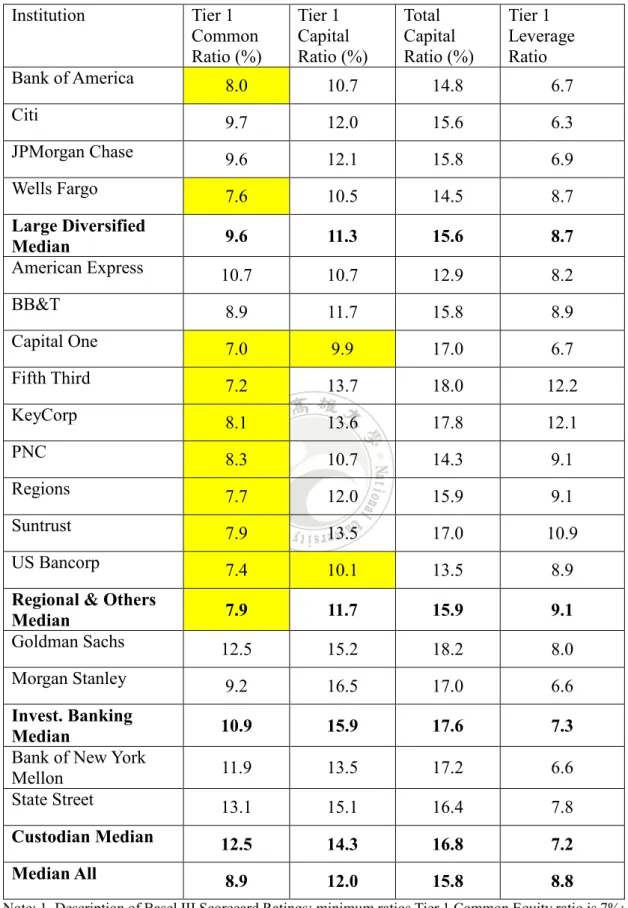
2.3 The Impact of Basel III on US Bank
Based on the analysis of PWC (2010) shows in Table 3, the current capital ratios of US banks would meet Basel III minimum requirements and most cases have more than 20% of cushion already built in. Minimum ratio Tier 1 common capital requirement is 7 %, current Tier 1 common median for all US banks is 8.9%, providing 2% of the countercyclical buffer, expected risk weighted assets (RWA) increases under Basel II and III rules, and potential deductions3 in Tier 1 capital ratios. This analysis
does not take into account RWA growth estimates or new deductions in Tier 1 Common.
2.4 The Impacts of Basel III on Bank Performance
Recent studies have attempted to identify some of the major determinants of banks’ profitability. They consider internal and external factors and examine a single country (Abreu and Mendes, 2001; Staikouras and Wood, 2011; Goddard et al., 2004). The results show a positive association between the return on equity and the level of interest rates, loan to assets and equity to assets ratios, bank concentration, and the government ownership. Basel III increase capital quantity and quality could affect the liquidity constraints, level bank stability, and ownership concentration. in the probability of a crisis event.
3 Including for minority interest in financial institutions, goodwill and intangibles, mortgage serving
Table 3: US Banks’s Main Basel III Components—Capital Ratios and Targets Capital Ratios (as of Q2 2010) Institution Tier 1 Common Ratio (%) Tier 1 Capital Ratio (%) Total Capital Ratio (%) Tier 1 Leverage Ratio Bank of America 8.0 10.7 14.8 6.7 Citi 9.7 12.0 15.6 6.3 JPMorgan Chase 9.6 12.1 15.8 6.9 Wells Fargo 7.6 10.5 14.5 8.7 Large Diversified Median 9.6 11.3 15.6 8.7 American Express 10.7 10.7 12.9 8.2 BB&T 8.9 11.7 15.8 8.9 Capital One 7.0 9.9 17.0 6.7 Fifth Third 7.2 13.7 18.0 12.2 KeyCorp 8.1 13.6 17.8 12.1 PNC 8.3 10.7 14.3 9.1 Regions 7.7 12.0 15.9 9.1 Suntrust 7.9 13.5 17.0 10.9 US Bancorp 7.4 10.1 13.5 8.9
Regional & Others
Median 7.9 11.7 15.9 9.1
Goldman Sachs 12.5 15.2 18.2 8.0
Morgan Stanley 9.2 16.5 17.0 6.6
Invest. Banking
Median 10.9 15.9 17.6 7.3
Bank of New York
Mellon 11.9 13.5 17.2 6.6
State Street 13.1 15.1 16.4 7.8
Custodian Median 12.5 14.3 16.8 7.2
Median All 8.9 12.0 15.8 8.8
Note: 1. Description of Basel III Scorecard Ratings: minimum ratios Tier 1 Common Equity ratio is 7%; Total Tier 1 Capital ratio is 8.5%; Total Capital ratio is 10.5%, and Total Leverage ratio is 3%. 2. Shading table cells is cushion over minimum Basel III requirement less than 20%, otherwise is
The Basel Committee has published its estimates of the extent to which higher capital and liquidity requirements can reduce the frequency of financial crises and consequent loss of output. They find that averaging across some studies of financial crises in many countries, increased capital and liquidity lead to a substantial reduction
Schwerter (2011) dispute that the Basel III accord provides for more efficient regulations to achieve the objective of guiding financial institutions and the financial system towards more stability. Allen et al., (2012) suggests that the adoption of Basel III is a significant structural shift in the risk management applies to the banking industry and has the potential to convert business models, processes and governance of international banks. Admati et al., (2011) assertion that the adoption of Basel III will limit the supply of credit and thus reduce economic activity. For instance, Yan et al., (2012) investigated the impact of capital regulations and liquidity requirements under the Basel III accord by using a sample of 11 UK banks from the period 1997 to 2010. They discover that higher regulatory capital requirements not only reduces the probability of a banking crisis but also reduces the economic loss from a banking crisis.
Chapter 3 Data and Methodologies
3.1 Data
To investigate US domestic bank’s dividends and dividend policy affected by the Basel III, this study uses the commercial banks in the United States as the samples. The dataset is the annual data from the Uniform Bank Performance Report (UBPR) from the Federal Financial Institutions Examination Council (FFIEC) and the structure and geographical variables are from the Federal Reserve Bank of Chicago. The examination periods are from 2011 to 2015 which are the periods after the announcement of the capital proposal of Basel III.
3.2 Variables
3.2.1 Dependent variables
The dependent variables used in the research include Indiv (natural log of dividend in Thousands) regards as the proxy of the dividend payout; Payratio (dividend divided by adjusted operating incomes) regards as the proxy of the dividend policy;
Divratio (dividend divided by common stocks), and Div_change (change of dividend
divided by common stocks). The study does not use dividend divided by net incomes because there are some banks pay a dividend with negative net incomes.
3.2.2 Independent variables
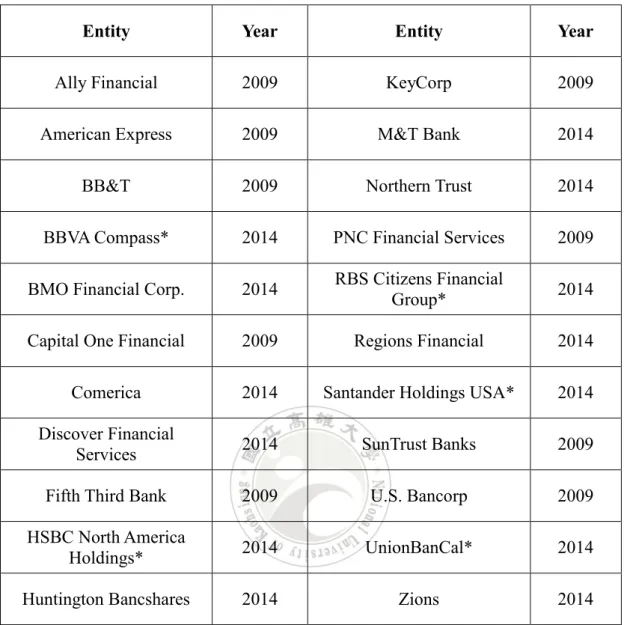
systemically important banks (D-SIBs) and global systemically important banks (G-SIBs) are the banks that have a significant negative impact on the local financial system or global financial system if they cannot continue to operate. D-SIBs have been identified by a national regulator, which are those banks not being big enough for G-SIBs status but have high sufficiently systemically importance to the domestic financial market. Federal Reserve is the central banking system of the United States, who identify the list of US Domestic Systematically Important Banks (US D-SIBs) (see Table 4) by making subject to the most stringent annual Stress Test (USA-ST). However, there is only one official global list of G-SIBs (see Table 5). Basel III also requires that all identified G-SIBs no later than March 2018, shall operate with a minimum total capital adequacy ratio comprising with max 2% Tier 2 capital, max 1.5% Additional Tier 1 capital and min 8.0% or 8.5% or 9.0% or 9.5% or 10.5% high quality Common Equity Tier 1 capital, compared to the similar Basel III capital requirement at 7% towards banks not contained on the list. Furthermore, FSB issued a global standard for the minimum Total Loss Absorbency Capital (TLAC) s for 30 G-SIBs 9 November 2015.
Table 4: The List of US D-SIBs (as of March 2014)
Entity Year Entity Year
Ally Financial 2009 KeyCorp 2009
American Express 2009 M&T Bank 2014
BB&T 2009 Northern Trust 2014
BBVA Compass* 2014 PNC Financial Services 2009
BMO Financial Corp. 2014 RBS Citizens Financial
Group* 2014
Capital One Financial 2009 Regions Financial 2014
Comerica 2014 Santander Holdings USA* 2014
Discover Financial
Services 2014 SunTrust Banks 2009
Fifth Third Bank 2009 U.S. Bancorp 2009
HSBC North America
Holdings* 2014 UnionBanCal* 2014
Huntington Bancshares 2014 Zions 2014
Note*: Subsidiary of G-SIBs
Table 5: The List of G-SIB (2014 & 2015 updated)
Entity HQ Country Total capital ratio requirement 2014 2015
Agricultural Bank of China China 11.5% (CET1=min.8%) 11.5% (CET1=min.8%)
BBVA Spain (CET1=min.8%) 11.5% -
Bank of America United States (CET1=min.8.5%) 12.0% (CET1=min.8.5%) 12.0%
Bank of China China 11.5%
(CET1=min.8%) (CET1=min.8%) 11.5% Bank of New York
Mellon United States
11.5% (CET1=min.8%) 11.5% (CET1=min.8%) Banque Populaire CE (BPCE) France 11.5% (CET1=min.8%) 11.5% (CET1=min.8%) Barclays United Kingdom 12.5% (CET1=min.9%) 12.5% (CET1=min.9%) BNP Paribas France (CET1=min.9%) 12.5% (CET1=min.9%) 12.5% China Construction
Bank China -
11.5% (CET1=min.8%) Citigroup
United States (CET1=min.9%) 12.5% (CET1=min.9%) 12.5%
Crédit Agricole France 11.5%
(CET1=min.8%)
11.5% (CET1=min.8%)
Credit Suisse Switzerland 12.0%
(CET1=min.8.5%)
12.0% (CET1=min.8.5%)
Deutsche Bank Germany 12.5%
(CET1=min.9%)
12.5% (CET1=min.9%)
Goldman Sachs United States 12.0%
(CET1=min.8.5%)
12.0% (CET1=min.8.5%)
HSBC United
Kingdom (CET1=min.9.5%) 13.0% (CET1=min.9.5%) 13.0% ICBC China (CET1=min.8%) 11.5% (CET1=min.8%) 11.5%
ING Bank Netherlands 11.5%
(CET1=min.8%)
11.5% (CET1=min.8%) JP Morgan Chase United States 13.0%
(CET1=min.9.5%)
13.0% (CET1=min.9.5%)
Mitsubishi UFJ FG Japan 12.0%
(CET1=min.8.5%)
12.0% (CET1=min.8.5%) Mizuho FG
Japan (CET1=min.8%) 11.5% (CET1=min.8%) 11.5%
Morgan Stanley United States 12.0%
(CET1=min.8.5%)
12.0% (CET1=min.8.5%) Nordea
Sweden (CET1=min.8%) 11.5% (CET1=min.8%) 11.5%
Scotland Kingdom (CET1=min.8.5%) (CET1=min.8%) Santander
Spain (CET1=min.8%) 11.5% (CET1=min.8%) 11.5% Société Générale
France (CET1=min.8%) 11.5% (CET1=min.8%) 11.5% Standard Chartered United
Kingdom (CET1=min.8%) 11.5% (CET1=min.8%) 11.5%
State Street United States 11.5%
(CET1=min.8%) 11.5% (CET1=min.8%) Sumitomo Mitsui FG Japan 11.5% (CET1=min.8%) 11.5% (CET1=min.8%) UBS
Switzerland (CET1=min.8%) 11.5% (CET1=min.8%) 11.5%
Unicredit Group Italy 11.5%
(CET1=min.8%)
11.5% (CET1=min.8%) Wells Fargo United States (CET1=min.8%) 11.5% (CET1=min.8%) 11.5% Note: China Construction bank have been added to and BBVA has been removed, compared with the
group of G-SIBs published in 2014. Source: Financial Stability Board
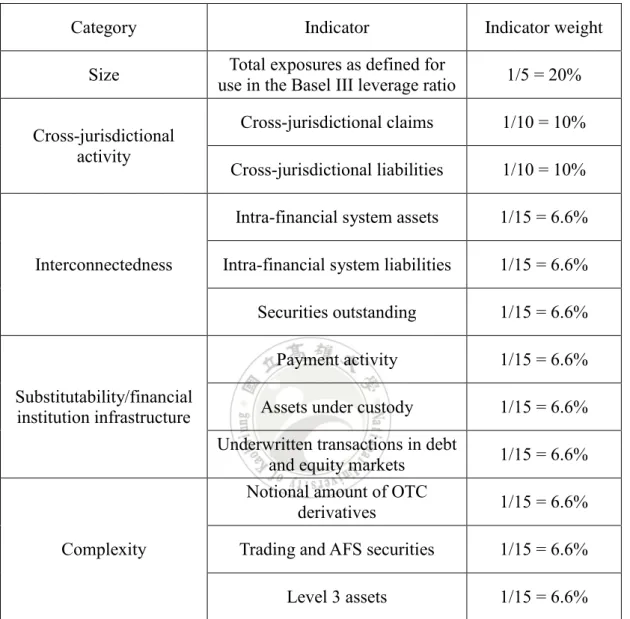
The BCBS (2014) set an indicator based measurement approach to determining an institution is regarded as G-SIB (see Table 6). There are grouped into five categories of systemic importance, which are: size, cross-jurisdictional activity, interconnectedness, substitutability/financial institution infrastructure, and complexity. Each category is given 20% weighting and, as specified below, most of the category are made up of two or more sub-indicators.
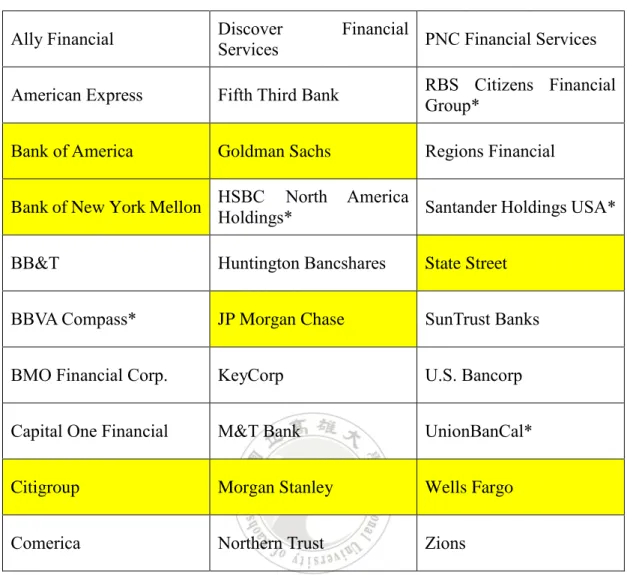
All G-SIBs and D-SIBs are not only required to comply with capital ratio requirements but also to submit an updated emergency Resolution Plan annually to the Board of Governors of the Federal Reserve System. Therefore, the study define dummy variable Treat2014 as 1 if the US commercial bank defined as G-SIBs and D-SIBs (see Table 7) and 0 otherwise. This study also identifies the dummy variable PostYeart as 1
for the commercial banks in the particular years 2012, 2013, 2014, and 2015. We multiply these two dummy variables and construct the interaction term Treat2014 *
dividend payout policy.
Table 6: Indicator-Based Measurement Approach
Category Indicator Indicator weight
Size use in the Basel III leverage ratio Total exposures as defined for 1/5 = 20%
Cross-jurisdictional activity
Cross-jurisdictional claims 1/10 = 10% Cross-jurisdictional liabilities 1/10 = 10%
Interconnectedness
Intra-financial system assets 1/15 = 6.6% Intra-financial system liabilities 1/15 = 6.6% Securities outstanding 1/15 = 6.6%
Substitutability/financial institution infrastructure
Payment activity 1/15 = 6.6%
Assets under custody 1/15 = 6.6% Underwritten transactions in debt
and equity markets 1/15 = 6.6%
Complexity
Notional amount of OTC
derivatives 1/15 = 6.6%
Trading and AFS securities 1/15 = 6.6%
Level 3 assets 1/15 = 6.6%
Table 7: List of US G-SIBs and D-SIBs in 2014
Ally Financial Discover Services Financial PNC Financial Services
American Express Fifth Third Bank RBS Citizens Financial Group*
Bank of America Goldman Sachs Regions Financial
Bank of New York Mellon HSBC North America Holdings* Santander Holdings USA*
BB&T Huntington Bancshares State Street
BBVA Compass* JP Morgan Chase SunTrust Banks
BMO Financial Corp. KeyCorp U.S. Bancorp
Capital One Financial M&T Bank UnionBanCal*
Citigroup Morgan Stanley Wells Fargo
Comerica Northern Trust Zions
*Subsidiary of G-SIBs
Note: Shading table cells is US G-SIBs
3.2.3 Control variables
There has been some significant research to discuss dividend policy issue from the perspective of the banking industry. The control variable strongly influences experimental results, and it is held constant during the experiment in order to test the relative relationship of the dividend and capital requirement.
(1) Bank size (Inta)
Bank size is a significant impact on a banks’ access to capital and the level of capital. Existing literature indicated that larger banks have fewer capital buffers since
the size of a bank may play a role in determining the bank risk level through its impact on investment opportunities and diversification possibilities. Larger banks are expected to keep smaller capital buffers as per the ‘too-big-to-fail’ hypothesis since they expect to be ‘bailed-out’ if they are faced with difficulties. In other words, large banks may expect a greater degree of support than small banks from the government. Small banks, on the other hand, might hold larger buffers due to their relative difficulty to access the capital markets. It is also argued that relatively large banks tend to be more diversified and thereby not easy to go bankruptcy.
Furthermore, banks also help overcome information asymmetries by screening and monitoring borrowers, but these are costly activities, and banks are likely to gain from the cost of these activities against the cost of excess capital. To the extent that large banks enjoy economies of scale in screening and monitoring, they will require less capital about the size of their loan assets. Therefore, we measured bank size variable through the natural log of the average of total assets.
(2) Profitability (ROA)
Profitable banks are supposed to pay out a higher dividend. Therefore, a positive relationship between profitability and dividend payout is expected. We measure profitability by the average of the net income to total assets.
(3) Equity multiplier (TE_TA).
The equity multiplier is a measure of financial leverage, allows the stakeholders to see what segment of the return on investment is the result of debt. In fact, debt is an important part of optimizing the capital structure of a bank to make the best trade-off between return on capital, growth, and trade-offs as it relates to dilution of equity. One of the best ways in which banks increases its profit is through leverage. Leverage uses
debt instruments so that the anticipated level return on the banks’ equity would increase. Therefore, we measured financial leverage through the total equity to total assets ratio. (4) D(year)_Tier1
Bank’s total Tier 1 capital minus required minimum requirement (including capital buffer) of Tier 1 capital in specific year
(5) Risk
Holding higher level of capital can ensuring that lower bank risk taking which banks do not fall below the minimum capital requirement, thus reducing the probability of bankruptcy and the costs associated with failure, because it reduces asset-substitution moral hazard or strengthens banks’ monitoring incentives. It also may alternatively increase risk taking because it can cause banks shift into riskier assets. As Berger & Bouwman (2013) measures, this study considers the risk-weighted assets divided by total assets as a measure of bank risk. The risk-weighted asset also referred to as RWA is the sum of the bank's assets or off-balance-sheet activities, weighted according to risk, is the denominator in the Basel III risk-based capital requirements.
Table 8: Describes the Definitions of All Variables
Variables Definition (as in the present study)
Dividend Dividend (in Thousand)
Indiv Natural log of dividend in Thousand
Payratio Dividend divided by adjusted operating income
Divratio Dividend divided by common stocks
Div_change Change of dividend divided by common stocks
Treat2014 Treat2014 takes a value of 1 if the US commercial bank is defined as
G-SIBs and D-SIBs in the year 2014 and 0 otherwise.
Treat2014 * PostYeart
Treat2014 times PostYeart. Dummy variables PostYeart as 1 for the
certain commercial banks in the years which phase-in periods for the Basel III minimum capital requirements
TA Total assets
Intra Natural log of total assets
ROA Return on total assets
TE_TA Total equity to total assets ratio
D(year)_Tier1 Bank’s total Tier 1 capital minus required minimum requirement (including capital buffer) of Tier 1 capital in specific year
Risk Risk-weighted assets divided by total assets
3.3 Differences-in-Differences (DD) Methodology
This study estimated to analyze the relationship between dividend (dividend policy) and capital adequacy after the announcement of Basel III proposal in September 2010. To test the differences, we use the same differences-in-differences methodology as Bertrand et al., 2004; Francis et al., 2011.
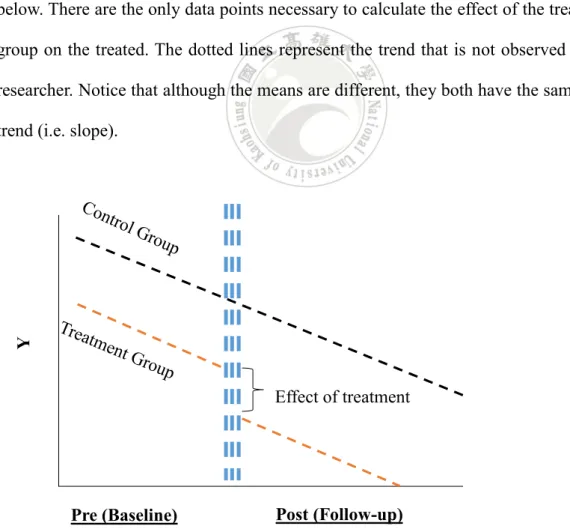
The differences-in-differences (DD) estimators is used to recover the treatment effects stemming from sharp changes in the economic environment, government policy or institutional environment. It is a tool to estimate treatment effects comparing the pre- and post-treatment differences in the outcome of a treatment and a control group. DD estimates often derive from using Ordinary Least Squares (OLS) in repeated the data on individuals in treatment and control groups for several years before and after a particular intervention. DD estimation uses four data points to reduce the impact of a policy change in the treated group: the effect of the treatment on the treated. The structure of the test implies that the treatment group and control group have parallel characteristics and are trending in the same direction over the time. See the diagram below. There are the only data points necessary to calculate the effect of the treatment group on the treated. The dotted lines represent the trend that is not observed by the researcher. Notice that although the means are different, they both have the same time trend (i.e. slope).
Source: Goulding, K. (2011). Retrieved May 2, 2016, from
https://thetarzan.wordpress.com/2011/06/20/differences-in-differences-estimation-in-r-and-stata
Figure 1: Demonstration of the Concept of Differences-in-Differences
Pre (Baseline) Post (Follow-up)
Effect of treatment
The common generalization of the most basic DD setup (with two periods and two groups), which is valid only under the assumption that changes in the outcome variable would have been the same in both treatment and control groups in the absence of the intervention. The baseline regression model to test is as follows:
Dividend = 𝑓(𝑇𝑟𝑒𝑎𝑡2014𝑖, 𝑃𝑜𝑠𝑡𝑌𝑒𝑎𝑟𝑖, 𝑇𝑟𝑒𝑎𝑡2014 ∗ 𝑃𝑜𝑠𝑡𝑌𝑒𝑎𝑟𝑖, 𝐶𝑖)
The differences-in-differences strategy amounts to comparing the change in dividend in G-SIBs & D-SIBs to change in dividend in non G-SIBs & D-SIBs. We can estimate the differences-in-differences estimator in a regression framework. It is easy to calculate the standard errors. We can control for other variables which may reduce the residual variance.
𝐷𝑖𝑡 = 𝛽1𝑇𝑟𝑒𝑎𝑡2014+ 𝛽2𝑃𝑜𝑠𝑡𝑌𝑒𝑎𝑟 + 𝛿1𝑇𝑟𝑒𝑎𝑡2014 ∗ 𝑃𝑜𝑠𝑡𝑌𝑒𝑎𝑟 +
𝛼1𝐼𝑛𝑡𝑎+ ∝2 𝑅𝑂𝐴 + 𝛼3𝑇𝐸𝑇𝐴+ 𝛼4𝐷(𝑦𝑒𝑎𝑟)𝑇𝑖𝑒𝑟1+ 𝛼5𝑅𝑖𝑠𝑘 + 𝑢𝑖 + εit , [1]
whereby:
D = Natural log of dividend; dividend divided by adjusted operating income; dividend
divided by common stocks; change of dividend divided by common stocks
Treat2014 = a dummy which is equal to 1 if the observation is from G-SIBs & D-SIBs PostYear = is a dummy which is equal to 1 if the observation is after the treatment
𝛿1=difference-in-difference estimator is (G-SIBs & D-SIBs Post - G-SIBs & D-SIBs
Pre) – ( non G-SIBs & D-SIBs Post – non G-SIBs & D-SIBs Pre) i = 1, 2…N is the number of bank
𝑢i = represents the fixed effect of banki
Therefore, we have a DD setup whereby we compare the average outcome for treated and control banks (Treat2014 = 1 for the US commercial bank is incorporated in the list of G-SIBs and D-SIBs and Treat2014 = 0 for the others US commercial bank) before and after treatment (PostYear = 1 is the particular commercial banks in the years
t which phase-in periods for the Basel III minimum capital requirements and PostYear
= 0 is otherwise). The slope of Treat2014 * PostYearprovides information about to determine whether the treatment has an effect on the treated banks or not. Ci is a control
variable. Differences-in-differences strategy computes the conditional expectations and then the difference over time in average outcome for the treatment group minus the difference over time in average outcome for the control group gives the DD coefficient (𝛿1).
{𝐸(𝑦|𝑡𝑟𝑒𝑎𝑡 = 1, 𝑝𝑜𝑠𝑡 = 1) − 𝐸(𝑦|𝑡𝑟𝑒𝑎𝑡 = 1, 𝑝𝑜𝑠𝑡 = 0)} −
Chapter 4 Results and Discussions
4.1 Summary Statistics
Table 9 presents descriptive statistics for the sample of 35,437 bank-year observations over the period 2011-2015. The details of definitions of all variables are reports in Table 8. The 18 banks with total negative equity are eliminated. The variable
Treat2014 has a mean value of 0.005, implying that 0.5 % of total observation are
defined as G-SIBs and D-SIBs which 185 bank year observations. The Payratio
variables with the average value of 0.11, showing that a bank included in the sample
on average pays 11% of its adjusted operation income in the dividend, annually. The mean value and standard deviation of the natural log of the dividend are 4.59 and 3.41, respectively. The results are consistent with similar studies.
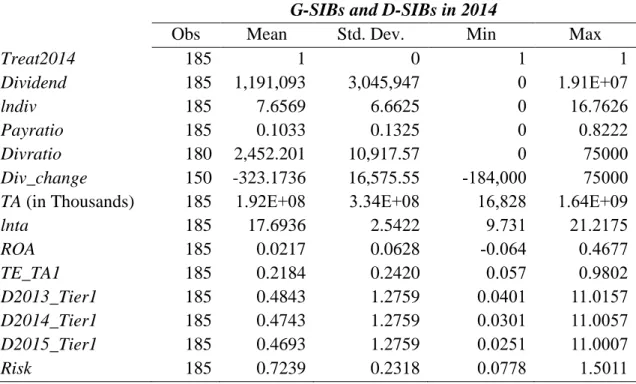
Table 10 and Table 11 show the statistics for the samples are classified into two groups based on whether the bank is defined as G-SIBs & D-SIBs (185 banks) or not (35252 banks ) respectively. The Payratio variables with the mean value of 0.1033, showing that G-SIBs & D-SIBs in the sample on average pays 10.33% of its operation income as the dividend. The mean value and standard deviation of the natural log of the dividend are 7.66 and 6.66, respectively for the G-SIBs & D-SIBs. However, the average value and standard deviation of the natural log of the dividend for the non-G-SIBs & D-non-G-SIBs are 4.57 and 3.38, respectively.
Table 9: Summary Statistics for All Sample
Full Sample
Obs Mean Std. Dev. Min Max
Treat2014 35,437 0.0052 0.0721 0 1 Dividend 35,437 12,885.33 310,987.8 0 1.91E+07 lndiv 35,437 4.5850 3.4078 0 16.7626 Payratio 35,426 0.1101 1.3822 0 249.4991 Divratio 35,063 102.4651 3,392.002 0 313,000 Div_change 28,579 21.46495 3,508.761 -313,000 313,000
TA (in Thousands) 35,437 2,263,784 4.13E+07 1391 2.07E+09
lnta 35,437 12.1486 1.3358 7.2378 21.4532 ROA 35,437 0.0069 0.0277 -4.2807 0.7289 TE_TA1 35,437 0.1109 0.0538 0.0004 0.9893 D2013_Tier1 35,437 0.1673 2.9442 -0.0446 396.8883 D2014_Tier1 35,437 0.1573 2.9442 -0.0546 396.8783 D2015_Tier1 35,437 0.1523 2.9442 -0.0596 396.8733 Risk 35,437 0.6593 0.1373 0.00021 1.8986
Table 10: Summary Statistics for G-SIBs and D-SIBs
G-SIBs and D-SIBs in 2014
Obs Mean Std. Dev. Min Max
Treat2014 185 1 0 1 1 Dividend 185 1,191,093 3,045,947 0 1.91E+07 lndiv 185 7.6569 6.6625 0 16.7626 Payratio 185 0.1033 0.1325 0 0.8222 Divratio 180 2,452.201 10,917.57 0 75000 Div_change 150 -323.1736 16,575.55 -184,000 75000
TA (in Thousands) 185 1.92E+08 3.34E+08 16,828 1.64E+09
lnta 185 17.6936 2.5422 9.731 21.2175 ROA 185 0.0217 0.0628 -0.064 0.4677 TE_TA1 185 0.2184 0.2420 0.057 0.9802 D2013_Tier1 185 0.4843 1.2759 0.0401 11.0157 D2014_Tier1 185 0.4743 1.2759 0.0301 11.0057 D2015_Tier1 185 0.4693 1.2759 0.0251 11.0007 Risk 185 0.7239 0.2318 0.0778 1.5011
Table 11: Summary Statistics for Non-G-SIBs and D-SIBs
Non-G-SIBs and D-SIBs in 2014
Obs Mean Std. Dev. Min Max
Treat2014 35,252 0 0 0 0 Dividend 35,252 6,702.182 203,642 0 1.70E+07 lndiv 35,252 4.5689 3.3753 0 16.6487 Payratio 35,241 0.1101 1.3858 0 249.4991 Divratio 34,883 90.3402 3,305.262 0 313,000 Div_change 28,429 23.2834 3,306.916 -313,000 313,000
TA (in Thousands) 35,252 1,269,336 3.08E+07 1391 2.07E+09
lnta 35,252 12.1195 1.264063 7.2378 21.4532 ROA 35,252 0.0069 0.0274 -4.2807 0.7289 TE_TA1 35,252 0.1104 0.0505 0.0004 0.9893 D2013_Tier1 35,252 0.1657 2.9504 -0.0446 396.8883 D2014_Tier1 35,252 0.1557 2.9504 -0.0546 396.8783 D2015_Tier1 35,252 0.1507 2.9504 -0.0596 396.8733 Risk 35,252 0.6589 0.1365 0.00021 1.8986
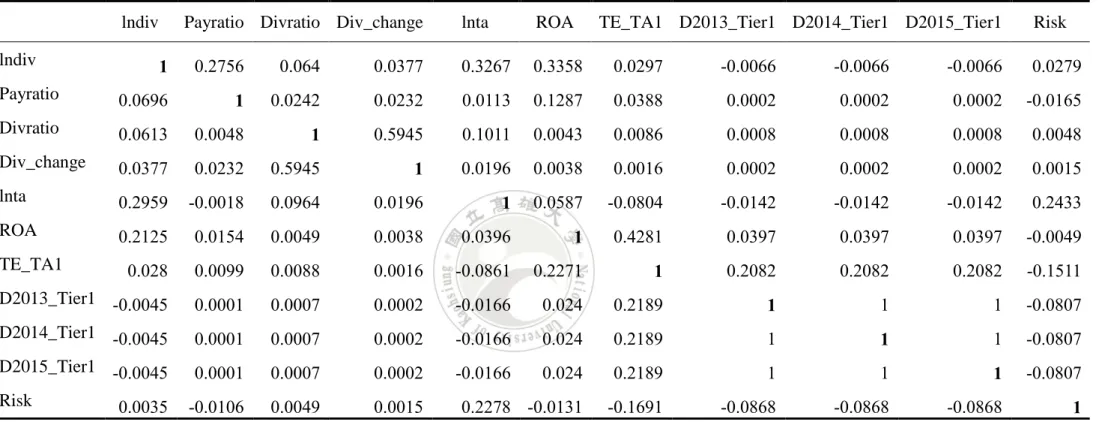
4.2 Pairwise Correlation and Correlation Matrix
Correlation coefficients are shown in the upper right triangle above the diagonal; pairwise comparisons are shown in the lower left triangle below the diagonal which are presented in Table 12. Results for correlations are consistent with expectations. Correlations between Dividend and Bank’s total Tier 1 capital minus required minimum requirement are negative showing that level of dividend payout is higher if Tier 1 capital requirement is lower. Positive correlations between dividend and Inta and ROA are also consistent with expectations and show big and more profitable banks have a high level of dividend payout. Most of the correlation coefficients are below 0.3.
Table 12: Pairwise Correlationand Correlation Matrix
lndiv Payratio Divratio Div_change lnta ROA TE_TA1 D2013_Tier1 D2014_Tier1 D2015_Tier1 Risk
lndiv 1 0.2756 0.064 0.0377 0.3267 0.3358 0.0297 -0.0066 -0.0066 -0.0066 0.0279 Payratio 0.0696 1 0.0242 0.0232 0.0113 0.1287 0.0388 0.0002 0.0002 0.0002 -0.0165 Divratio 0.0613 0.0048 1 0.5945 0.1011 0.0043 0.0086 0.0008 0.0008 0.0008 0.0048 Div_change 0.0377 0.0232 0.5945 1 0.0196 0.0038 0.0016 0.0002 0.0002 0.0002 0.0015 lnta 0.2959 -0.0018 0.0964 0.0196 1 0.0587 -0.0804 -0.0142 -0.0142 -0.0142 0.2433 ROA 0.2125 0.0154 0.0049 0.0038 0.0396 1 0.4281 0.0397 0.0397 0.0397 -0.0049 TE_TA1 0.028 0.0099 0.0088 0.0016 -0.0861 0.2271 1 0.2082 0.2082 0.2082 -0.1511 D2013_Tier1 -0.0045 0.0001 0.0007 0.0002 -0.0166 0.024 0.2189 1 1 1 -0.0807 D2014_Tier1 -0.0045 0.0001 0.0007 0.0002 -0.0166 0.024 0.2189 1 1 1 -0.0807 D2015_Tier1 -0.0045 0.0001 0.0007 0.0002 -0.0166 0.024 0.2189 1 1 1 -0.0807 Risk 0.0035 -0.0106 0.0049 0.0015 0.2278 -0.0131 -0.1691 -0.0868 -0.0868 -0.0868 1
4.3 Empirical Results
In the analysis, that follows the study control for bank characteristics and examine whether our proxy for change requirement of capital in the regulation of Basel III has any additional power to explain banks’ dividend payout policy. This study starts by examining dividend payout patterns by each year started from 2012 to 2015. Then, the study uses multivariate analysis to estimate the impact of capital requirement on dividend payout ratios. Additionally, run a regression to estimate the change to pay dividends in response to the Basel III capital requirements. The differences-in-differences approach using the equation interaction term between a year dummy from 2011-2015 and an indicator for the G-SIBs and D-SIBs. Bank and year fixed effects are controlled in the estimations.
Each model includes a post year 2012/2013/2014/2015 dummy and an indicator for G-SIBs & D-SIBs, respectively. The DD coefficient would capture the differential change between dividend by G-SIBs & D-SIBs and non-G-SIBs & D-SIBs following the corresponding year. As reported in Table 13, the DD coefficient is no significant means that G-SIBs & D-SIBs and non-G-SIBs & D-SIBs do not have different, and they pay less dividend in the year 2011-2013, due to increasing their common equity and Tier 1 capital ratios require by Basel III. The dependent variable is Indiv equals natural log of dividend (thousands).
Next, the dependent variable is total dividend divided by adjusting operation income, proxy as dividend payout ratio. The result shows the payout ratio have not changed even the banks have pressure to increase their common equity and Tier 1 capital ratios.
Table 13: The Effect of Dividend and Dividend Payout Ratio
This table presents regression results of dividend payout behavior of G-SIBs and D-SIBs in US. The dependent variable is natural log of dividend in thousands as proxy of dividend payouts (Columns 2). In Columns 3, we use the dividend divided by adjusted operation income as the dependent variable. As control variables, the study include natural log of total assets, return on assets, total assets to total assets ratio, total Tier 1capital minus required minimum requirement of Tier 1 capital in specific year, and risk weighted assets divided by total assets.
Different between (Treatment – Control)
Dividend Dividend divided by adjusted operation income
2012 2013 2014 2015 2012 2013 2014 2015
Baseline
(before specific year )
-1.228** -2.438*** -1.618*** -0.825 -0.056 -0.049 0.001 -0.019
(0.029) (0.000) (0.006) (0.133) (0.103) (0.125) (0.991) (0.819)
Follow-up (after specific year)
-1.358** -1.447** -0.941 0.089 -0.056 -0.015 -0.027 0.026 (0.015) (0.016) (0.107) (0.872) (0.104) (0.634) (0.745) (0.759) 𝜹𝟏=DD estimator (after – before) -0.131 0.991 0.677 0.913 0.000 0.034 -0.028 0.045 (0.865) (0.226) (0.395) (0.223) (0.996) (0.440) (0.805) (0.694) Obs 12,272 11,849 11,385 10,882 12,269 11,843 11,382 10,880 R² 0.23 0.12 0.14 0.22 0.07 0.01 0.00 0.01
Next, Table 14 show the effect of dividend per common stocks and change in dividend per common stocks. For dependent variable as dividend per common stocks, indicate that the DD coefficient in 2012 year dummy is positive and significant at the 1 percent level. The results suggest that, before 2012, G-SIBs & D-SIBs relatively pay a higher dividend to common equity than non-G-SIBs & D-SIBs, because the increase in the minimum common equity and Tier 1 capital ratios at least 3.5% will be phased-in beginning in January 2013. However, there are not significant for 2013 year dummy show that the G-SIBs & D-SIBs and non-G-SIBs & D-SIBs have different in their dividend per common stocks. This is because all banks are starting to run the Basel III phase-in arrangements. Furthermore, the DD coefficient in 2014 year dummy is negative and significant at 5 percent level. The results show that G-SIBs & D-SIBs respond to Basel III minimum common equity and Tier 1 capital ratios from 3.5% to 4% by increasing their common stocks and pay less dividend and sufficiently increases to 4.5 % in January 2015.
Further, this study conducts a model 4 to see a change in dividend per common stocks has an impact by Basel III minimum common equity and Tier 1 capital ratios. The DD coefficient in year dummy 2012/2013/2014 is significant at the 1 percent level. The trend of DD coefficient is increasing from 2011 to 2012, and then decreasing in 2013, following in the year 2014 increase again until no different between G-SIBs & D-SIBs and non-SIBs & D-SIBs in 2015. The results indicate that, before 2012, G-SIBs & D-G-SIBs relatively pay a higher dividend to common equity than non-G-G-SIBs & D-SIBs. To prepare for higher common equity tier 1 ratio in 2014, G-SIBs & D-SIBs pay much lower dividends relative to common equity in 2013. When G-SIBs & D-SIBs are ready for the change of the minimum requirement of the common equity tier 1 ratio in 2014, G-SIBs & D-SIBs start to pay out more as the dividends. Thus, the DD
Table 14: The Effect of Dividend per Common Stocks and Change in Dividend per Common Stocks
This table presents regression results of dividend payout behavior of G-SIBs and D-SIBs in US. The dependent variable is dividend divided by common stocks (Columns 2). In Columns 3, we use the change of dividend divided by common stocks as the dependent variable. As control variables, the study include natural log of total assets, return on assets, total assets to total assets ratio, total Tier 1capital minus required minimum requirement of Tier 1 capital in specific year, and risk weighted assets divided by total assets.
Different between (Treatment – Control)
Dividend per common stocks Change in dividend per common stocks
2012 2013 2014 2015 2012 2013 2014 2015
Baseline
(before specific year )
105 2,616*** 2,617*** -286.6 904.9** 2,524*** -6,400*** -116.852
(0.852) (0.001) (0.001) (0.698) (0.035) (0.000) (0.000) (0.866)
Follow-up (after specific year)
3,012*** 2,845*** 195 -215.2 2,680.6*** -6,300*** -340 -281.907 (0.000) (0.000) (0.796) (0.771) (0.000) (0.000) (0.709) (0.685) 𝜹𝟏=DD estimator 2,907*** 228 -2,400** 71.4 1,775.7*** -8,900*** 6030*** -165.055 (0.000) (0.826) (0.019) (0.944) (0.002) (0.000) (0.000) (0.862) Obs 12,145 11,720 11,257 10,754 12,115 11,686 11,229 10,730 R² 0.01 0.01 0.01 0.02 0.01 0.01 0.00 0.00
Chapter 5 Conclusions
Basel III is a regulatory framework that aims to increase resilience in the banking system by strengthening banks’ capital requirements, reducing market liquidity risk, and improving the ability of banks to weather sustained periods of market stress. The objective of Basel III capital proposal is to make banks safe and sound. Banks are in the implementation process of the new requirements, with an end date of 2019 for most banks, although some are set to complete their application before this date. The impact of Basel III is not restricted to banks. However, this study focuses on the effect of changes in US commercial banks’ capital requirements
This paper investigates the effects of new capital requirements of Basel III on dividend policy in US commercial bank. We conduct a dataset of the annual report from the Uniform Bank Performance Report (UBPR) provide by the Federal Financial Institutions Examination Council (FFIEC) and the structure and geographical variables are from the Federal Reserve Bank of Chicago. The examination periods are from 2011 to 2015 which are the periods after the announcement of the capital proposal of Basel III.
The main findings document a negative relation between new capital requirements of Basel III and dividend; these results suggest that G-SIBs & D-SIBs pay much lower dividend relative to common equity when they are preparing to complete the implementation of Basel III. However, when they are ready for the change of the minimum capital requirement, they start to pay out more as the dividends as previously. Thus, this study support that G-SIBs & D-SIBs plow back earnings to recapitalize themselves due to the higher capital requirement of Basel III. So, shareholders could be
not so worried about the lower dividend payout because it just temporarily.
Further, the impact of Basel III is strongly dependent on its future implementation. The increase in the capital requirement on regulation will ultimately make banks become a safety and soundness. Even if the performance of the economy is slow, the stability of bank system will be able to sustain the confidence level of investor. It is undeniable that the implementation of Basel III will increase transparency, growth and financial strength of the banks. Eventually, it will lead to banks’ profitability and stability over the years.
In conclusion, these results are valuable for regulators, bank managers, shareholders and investors. In the short term, the banks are likely to retain profits by the reducing dividend payout to meet the regulatory capital requirement. In the long run, the banks will become more safety and soundness. Banks will face an environment with lower returns on capital and slower growth. By reducing leverage and imposing capital requirements, it reduces banks' earning power in good economic times. Nevertheless, it makes banks safer and better able to survive and thrive under financial stress. Bank managers can be restored the dividend and capital repurchase programs over time, particularly in the best-capitalized banks. For bank investors, this decreases appetite to investment for banking sector due to lower return, but it also increases confidence in the strength and stability of banks' balance sheets.Finally, the advantages far outweigh the disadvantages in the implementation of Basel III.
Reference
Abreu, J. F., & Gulamhussen, M. A. (2013). Dividend payouts: Evidence from U.S. bank holding companies in the context of the financial crisis. Journal of Corporate
Finance, 22, 54-65.
Abreu, M., & Mendes, V. (2001, May). Commercial bank interest margins and profitability: Evidence for some EU countries. Paper presented at Pan-European Conference Jointly Organised by the IEFS-UK & University of Macedonia Economic & Social Sciences. 17-20
Admati, A. R., & Pfleiderer, P. C. (2010). Increased-liability equity: A proposal to improve capital regulation of large financial institutions. Stanford University Graduate School of Business Research Paper No. 2043; Rock Center for Corporate Governance at Stanford University Working Paper No. 68. Available at SSRN:
http://ssrn.com/abstract=1532484 or http://dx.doi.org/10.2139/ssrn.1532484 Allen, B., Chan, K. K., Milne, A., & Thomas, S. (2012). Basel III: Is the cure worse
than the disease? International Review of Financial Analysis, 25, 159-166. Allen, F., & Michaely, R. (2003). Chapter 7 - Payout Policy. In M. H. George M.
Constantinides & M. S. René (Eds.), Handbook of the Economics of Finance, 1, 337-42.
Al‐Twaijry, A. A. (2007). Dividend policy and payout ratio: Evidence from the Kuala Lumpur stock exchange. The Journal of Risk Finance, 8(4), 349-363.
Baker, H. K., & Powell, G. E. (2000). Determinants of corporate dividend policy: A survey of NYSE firms. Financial Practice and Education,10, 29–40.
Baker, H.K., Powell, G.E., & Veit, E. T. (2002). Revisiting managerial perspectives on dividend policy. Journal of Economics and Finance, 26(3), 267-283
Basse, T., Reddemann, S., Riegler, J.-J., & von der Schulenburg, J. M. G. (2014). Bank dividend policy and the global financial crisis: Empirical evidence from Europe.
European Journal of Political Economy, 34, S25-S31.
Basel Committee on Banking Supervision (BCBS) (2010a). An assessment of the long-term economic impact of stronger capital and liquidity requirements. Bank for