從社會福利觀點探討政府再生原料政策之效果
52
0
0
全文
(2) 致謝辭 光陰似箭,匆匆地兩年的碩士班時光已進入尾聲。輕閉雙眼回想碩士班剛入 學的景象彷彿昨日,懵懵懂懂的進入高雄大學,認識同學、接觸各科老師,學著 艱深又有用的經營管理科目,回首過這兩年的歷程,點滴在心頭,三言兩語實在 無法闡述我的感激之心。 首先,我要特別感謝我的指導老師鄭育仁博士。俗話說:「一日為師,終生 為父。」恩師不斷叮嚀:「論文的本身只是一個過程,而這個過程是訓練你做事 情的態度與規劃。」這句話讓我震懾不少,沒想到我們自以為在大學已經可以做 好事情,到研究所的老師眼中還是不足的。恩師在教導我們寫論文的期間總是犧 牲寶貴的睡眠時間,甚至在假日期間恩師也留在學校替我解惑與教導我,就像「父 親」教導小孩一樣不辭辛勞無怨無悔的付出,而恩師對待學生的態度真的是我見 過的老師裡面最積極最負責任的,每每當我不懂課程內容或論文卡關時,恩師總 是耐心解釋,並且要我再敘述一次,確保我是真的了解。在他教導的每堂課中會 要求我們的思考邏輯一定要正確,因為在業界確實就是這樣的做好每件事情。恩 師在業界有相當多的實務經驗,嚴謹的做事態度,是我一生學習的榜樣。 恩師也像「益友」般地跟我暢談,我們倆常常討論論文與實務經營管理案例 到子夜,不僅談著書本上的專業知識也從現實生活中很多小細微的事物,恩師都 能觀察得淋漓盡致並且跟我分享。有這位恩師的出現,真的對我求學階段跟未來 要步入職場的道路上最大的加分。 對於所上李揚所長、吳毓麒老師及楊雅博老師傳授多門的課程與專業知識, 在此一併誌上深切的謝意。 此外還要特別感謝國立屏東大學童桂馨教授及義守大學陳筠昀教授,擔任口 試委員時對本論文提出的指正與建議。 再來我要感謝跟我同一位恩師指導的大樹學長、士豪與沛馨,有你們一路的 陪伴、扶持,總是可以讓我遇到難關時可以有信心可以順利過關。特別是同學義.
(3) 仉、怡今、阿筑、少煒、虹德、品茹,不管在研究室裡說心裡的話、晚上吃消夜 還是一起出遊,這都豐富了我的碩士生涯,是難以忘記的寶貴回憶。 最後我要感謝我的雙親,從小父母就希望我望子成龍,也希望我好好的讀書 拿個好文憑,而或許在大學時期考到不是太理想的大學讓你們失望,但你們卻沒 有放棄要栽培我,不管我學業上、經濟上需要什麼,你們都無怨無悔的付出,堅 持要給我最好。現在的我,想把此論文獻給我最親愛的家人,以及我在天上的叔 叔,從今以後,換我來堅持給你們最好,換我來照顧你們。 這一路從大學到研究所一路走來要感謝的人真的太多,感謝上天讓我在高雄 大學努力、求知、遇到恩師與良友。黃檗禪師:「不經一番寒澈骨,焉得梅花撲 鼻香。」這句話讓我深深的體會在碩士生涯的點滴,千言萬語只能感謝,感謝一 路走來的人豐富了我的碩士生涯。 劉冠甫 2015 仲夏. 謹誌. 高雄楠梓.
(4) The governmental policy effects on renewable inputs: From the perspective of social welfare Advisor: Dr. Yu-Jen Cheng Institute of Business and Management National University of Kaohsiung Student: Guan-Fu Liu Institute of Business and Management National University of Kaohsiung ABSTRACT This paper discusses four scenarios, autarky, open market, autarky with R&D and open market with R&D. Under the consideration of social welfare, the government may encourage final product manufacturers to adopt more secondary intermediate inputs, and set up a feasible incentive mechanism for domestic intermediate input manufacturer to improve its efficiency are important issues. We find that the domestic secondary intermediate input manufacturer not only has the ex-ante willingness to reduce production cost but also can create ex post efficiency improvement R&D performance. But there exists the paradoxical behavior on efficiency attention between the government and the domestic secondary intermediate input manufacturer. The domestic secondary intermediate input manufacturer will dedicate to pursue efficiency improvement for raising its own profit while the government is on the opposite side for the consideration of social welfare. There are two other findings. First, the social welfare effect of the percentage of using secondary intermediate input is negative in all regimes except in autarky regime. Second, the social welfare effect of tariff is positive (negative) in the open market (open market with R&D) regime.. Keywords: Green Supply Chain Management (GSCM), Resource Recycling, Advanced Recycling Fees (ARFs), Subsidy, Research and Development (R&D). i.
(5) 從社會福利觀點探討政府再生原料政策之效果 指導教授:鄭育仁 博士 國立高雄大學經營管理研究所 學生:劉冠甫 國立高雄大學經營管理研究所. 摘要 本文分成自給自足、開放市場、自給自足下做研發、開放市場下做研發等四 個狀況進行討論。其主要議題是在社會福利的考量下,政府為鼓勵最終產品製造 商採用二次料的投入,建立一個可行的激勵機制,促使本國二次料廠商提高其效 率。 本文發現,國內二次料廠商不只在事前有降低成本的意願,也會透過研發降 低成本。政府有意願補貼二次料廠商提升效率,但最終結果發現補貼後反而會降 低社會福利,所以廠商跟政府之間就提升效率的意圖上其結果是不同的。國內二 次料廠商致力追求改善效率以提高自己的利潤,卻得到相反的社會福利效果。 此外本文還有其他兩個發現。首先除了自給自足外,使用二次料比例在其他 情況下對社會福利均具有負向效果。其次關稅在開放市場(開放市場下做研發) 對社會福利產生正向(負向)效果。. 關鍵詞: 綠色供應鏈、資源回收、預收型回收處理費、補貼、研究發展. ii.
(6) Contents Chapter 1. Introduction ………………………………………………………. 1. 1.1 Research Background ………………………………………………………… 1 1.2 Research Motivation and Purpose …………………………………………… 3 1.3 Research Contributions ……………………………………………………… 4 1.4 Research Structure …………………………………………………………… 5 Chapter 2. Literature Review ………………………………………………… 6. 2.1 The Green Supply Chain ……………………………………………………… 6 2.2 Resource Reusing and Recycling ……………………………………………. 9 2.3 Government Policies ………………………………………………………… 12 Chapter 3. The Model ………………………………………………………… 17. 3.1 The Case of Autarky …………………………………………………………. 18 3.2 Open Domestic Intermediate Input Market ………………………................. 22 3.3 R&D Subsidy in the Case of Autarky …………………………….................. 26 3.4 R&D Subsidy in the Case of Open Domestic Intermediate Input Market … 29 Chapter 4. Conclusion ……………………………………………………….. 36. References ……………………………………………………………................. 39. iii.
(7) List of Figures. Fig. 3.1 The three-stage game of autarky ………………………………………….. 19 Fig. 3.2 The three-stage game of open domestic Intermediate input market …….. 22 Fig. 3.3 The three-stage game of R&D subsidy on domestic Intermediate input … 26 Fig. 3.4 The three-stage game of R&D subsidy on domestic Intermediate input … 30. iv.
(8) Chapter 1. Introduction. 1.1 Research Background Accompany with the rapid economic development in the world, it follows that the environmental resources are exhausted rapidly. Environment protection has become a major issue around the world. For protecting the environment from being destroyed, governments and manufacturers have started to make efforts on recycling and effectively use resources in order to reduce their impact on the environment. Therefore, the concept of “4R” arises. According to Environmental Protection Administration, Executive Yuan, R.O.C. (Taiwan), the “Definition of Environmental Protection”, Chap.5, The definition of wastes and soil pollution control, ID No. 11350158: 4Rs (Four Rs) include Reduction, Reuse, Recovery, and Recycle. 1 In this paper, the topic of resources reuse of recycling will be discussed. For implementing recycling and reducing waste effectively, many countries and international organizations have begun to involve in the reverse production supply chain. In 2006, the EU promulgated the “Direction on Waste Electrical and Electronic Equipment” (WEEE), 2 requires that all trafficking in consumer durable equipment, electrical and electronic tools, vending machines, etc. in EU must take the after-use. 1. See www.epa.gov.tw/FileDownload/FileHandler.ashx?FLID=863,2014.9.29.. 2. WEEE control 10 kinds of electrical and electronic equipment, 1. Large household appliances 2.. Small household appliances 3. IT and telecommunications equipment 4. Consumer equipment 5. Lighting equipment 6. Electrical and electronic tools 7. Toys, leisure and sports equipment 8. Medical devices 9. Monitoring and control instruments 10. Automatic dispensers .WEEE requires establishing recovery system and set a recovery goal. (http://ec.europa.eu/environment/legal/law/pdf/waste_law/5%20WEEE%20revised.pdf,2014.11.05 ) 1.
(9) environmental pollution problems into account while manufacturing, adopt recyclable easily, environmentally friendly design, and bear the responsibility and expense of recovery. The EU hopes that the huge consumer market will lead manufacturers at every stage of the supply chain to establish waste recycling norms at the time of manufacturing. The direction of WEEE enforces that non-compliant products cannot be sold in Europe, forcing international manufacturers to obey green specifications. Given the trends of dedicating to waste disposal management around the world, the Republic of China promulgated the “The Regulations Governing Application of Investment Tax Credits to Resource Recycling” in 2007, to cultivate new industries and reuse of resources sustainably. Then, the Industrial Development Bureau, Ministry of Economic Affairs, R.O.C. (Taiwan) was tasked to assist industries to build “R&D technology supply and demand information platform”. It provides a channel in R&D and technology cooperation among manufacturers, and facilitates cooperation among industries and academic institutes in technology development, to improve recycling industry's technology capabilities. In nowadays, many companies in Taiwan have invested and implemented recycling of renewable materials to produce products. For instance, Champion Building Materials Co., Ltd. and White Horse Ceramic Co., Ltd. use waste concrete (urbanite), waste porcelain, waste glass, and stone scraps as part of inputs to produce ceramic tile; China Steel Corporation mixes the waste steel with raw steel to produce steel for bridge structure; Chung Shing Textile Co., Ltd., Far Eastern New Century Corporation, Shinkong Textile Co., Ltd., and Lealea Enterprise Co., Ltd. use recycled PET fiber yarn with the virgin raw material to produce sportswear. 2.
(10) While meeting a specified percentage of mixing recycled materials into the raw material in production system, the manufactures may apply “Green Mark” as the product identification. “Green Mark” enables institutes and enterprises to identify those products with environmental friendly in the market place and thus fulfill their social responsibilities. Taiwanese manufacturers, supported by the government, actively engage in using inputs as complementary inputs. The environmental-friendly plastic jersey is a good example. According to French newspaper Le Figaro on June 26, 2014, the 2014 FIFA World Cup is providing a great stage and sales opportunity for Taiwan's innovative fabrics made of recycled plastic bottles, the Taiwanese enterprises have turned waste into gold. With ten of the participate teams wearing jerseys made of these innovative fabrics in Brazil after they were first introduced in South Africa four years ago, the newspaper also declared that Taiwan has already won her World Cup. Currently, the world trends and governmental policies are promoting the sustainable of reuse and recycling materials aggressively. Therefore, the government must provide relevant incentive measures to encourage manufacturers to practice the mechanisms of waste recycling. It will thus turn out the objectives of lessening environmental impact and waste reduction to be true.. 1.2 Research Motivation and Purpose From the above discussion, government plays a significant role in involving the green supply chain management. Under the consideration of social welfare, how can government encourage final product manufacturers to adopt more secondary intermediate inputs, and how to set up a feasible incentive mechanism for domestic 3.
(11) intermediate input manufacturers to manipulate their efficiency are important issues. From the perspective of manufacturers when facing international competition, the most critical criterion is to maximize their profits, while the government is to search for the optical social welfare. This paper discusses in depth the scenario that under the consideration of social welfare effects, the government imposes advanced recycling fees on monopoly final product manufacturer, regulates the percentage of using secondary intermediate inputs, grants domestic secondary intermediate input manufacturer subsidy on R&D expenditure, and levies tariff on foreign intermediate input exporter. The research procedure of this paper is as follows: 1. Divide the research scopes into four regimes: Autarky, open market, autarky with R&D, and open market with R&D; 2. Apply the three-stage game to explore the influence on the supply chain participants under the Government's green policy measures; 3. Decide optimal R&D level for domestic input manufacturer; 4. The impact of Government's policy on social welfare.. 1.3 Research Contributions This paper explores and discusses the government’s green policies effects on the succeeding interaction among manufacturers. We discuss four scenarios, autarky, open market, autarky with R&D and open market with R&D. We find that the domestic secondary intermediate input manufacturer not only has the ex-ante willingness to reduce production cost but also can create ex post efficiency improvement R&D performance. There exists paradox on efficiency 4.
(12) attention between the government and the domestic secondary intermediate input manufacturer. The domestic secondary intermediate input manufacturer will dedicate to pursue efficiency improvement for raising its own profit while the government is on the opposite side for the consideration of social welfare.. 1.4 Research Structure The remaining of this paper is organized as follows: In chapter 2, past literature concerning about the issues of the green supply chain, resource reusing and recycling, and government policies. In chapter 3, we firstly discuss the case of autarky. Then discuss the case that the government opens the domestic intermediate input market to foreign intermediate input manufacturers. Finally, government R&D subsidy would be included. Chapter 4 is the conclusion.. 5.
(13) Chapter 2. Literature Review. In recent years, environmental protection is an important topic that attracts many scholars devote in “green” researches. The main strands of “green” researches include green supply chain management (GSCM), resource reuse and recycle, and the role government plays in affecting environment policies. In this chapter, past literatures concerning about the aforementioned issues will be discussed respectively.. 2.1 The Green Supply Chain The concept of green supply chain is evolved from traditional supply chain while considering the issues of environmental protection and the exhaustible resources.. 2.1.1 The Supply Chain Management The traditional supply chain is defined as “an integrated manufacturing process wherein raw materials are manufactured into final products, then delivered to customers (via distribution, retail, or both)” (Beamon, 1999, p.336). According to this definition, the supply chain includes only those activities associated with manufacturing from raw material acquisition to final product delivery. Originally, supply chain management (SCM) focused primarily on material flows. Current researches emphasize additional aspects of SCM, such as risk (Colicchia and Strozzi, 2012), performance (Hassini et al., 2012), and integration (Fabbe-Costes and Jahre, 2007). In addition, information flows, internal and external networks of relationships (Stock et al., 2010), and governance of supply networks (Pilbeam et al., 2012) are also receiving a growing attention. A supply chain can therefore be seen as a dynamic process that includes the continuous flow of materials, 6.
(14) funds and information across multiple functional areas within and between chain members (Jain et al., 2009).. 2.1.2 The Green Supply Chain Management Di Vita (2001) had observed that after the Malthus and Ricardo debate, and since the seminal paper by Hotelling (1931), economic literature pays more attention to the constraints imposed on growth by exhaustible resources. Green supply refers to the way in which innovations in supply chain management and industrial purchasing may be considered in the context of the environment (Green et al., 1996). Wilkerson (2005) argues that GSCM involves a fundamental rethinking of supply chain management practices, and how they can be integrated with the company’s environmental strategy. The GSCM has integrated environment considerations into supply chain management, including product design, material sourcing and selection, manufacturing processes, delivery of the final product to the consumers, and end-of-life (EOL) management of the greening products (Wee et al., 2011). The U.S. Congress, Office of Technology Assessment (1992) defines green design as a “process in which environmental attributes are treated as design objectives.” The purpose of green design is to reduce waste material at its origin. The growing importance of GSCM is driven mainly by the escalating deterioration of the environment, e.g., diminishing raw material resources, overflowing waste sites, and increasing levels of pollution (Srivastava, 2007). Adding the “green” component to SCM involves addressing the influence and relationships between supply chain management and the natural environment. Combine the “green” concept with the supply chain concept creates a new paradigm where the supply chain 7.
(15) has a direct relation to the environment (e.g., Diabat and Govindan, 2011; Zhu and Sarkis, 2011; Eltayeb et al., 2011). Yet, the key challenges of GSCM include integrating remanufacturing with internal operations (Ferrer and Whybark, 2001), understanding the effects of competition among remanufacturers (Majumder and Groenevelt, 2001), integrating product design, product take-back and supply chain incentives (Guide and van Wassenhove, 2001; 2002).. 2.1.3 The Reverse Distribution Process While considering the reverse distribution process including recovery operations (such as remanufacturing, recycling, and re-use (i.e., 3Rs)), the extended supply chain is introduced to traditional supply chain design (Beamon, 1999). Therefore, the difference between supply chain and environmental management is: Supply chain processes create the waste and emissions while environmental management exerts on minimizing them. The “green” supply chain management is involving in reducing adverse environmental effects. Rogers and Tibben-Lembke (1999) define reverse logistics as the process of planning, implementing, and controlling the efficient, cost effective flow of raw materials, in-process inventory, finished goods and related information from the point of consumption to the point of origin for the purpose of recapturing value or proper disposal. Fleischmann et al. (1997) subdivide the reverse logistics into three main areas, i.e., distribution planning, inventory control, and production planning. Because of the scarcity of landfill space and the hazardous materials contained in most electronic appliances, reverse logistics system become vital as the take-back rate increases and the service area expands in the future. Shih (2001) utilizes a mixed 8.
(16) integer programming model to optimize the infrastructure design and reverse network flow by minimizing the total cost. Within the green channel, Ghosh and Shah (2012) compare and contrast the effect of each power structure on pricing and greening strategies of players in the channel. They find that cooperation between players does lead to higher greening levels, however greening leads to higher retail prices. It reveals that “green cannot be free!”. 2.2 Resource Reusing and Recycling Reuse of products and materials is not a new thing in our daily life. In recent decades, the growing environmental concerns have given the idea of “reuse” increasing attention. Originally, the motivation for firms to recover the used products is more economically attractive than disposal. Thierry et al. (1995) identify the different forms of reuse which contains direct reuse, repair, recycling, and remanufacturing (4Rs). Examples that can be directly reused (possibly through cleaning and minor maintenance) are bottles or containers. Repair aims at restoring failed products to “working order” (though possibly with a loss of quality). Recycling denotes material recovery without conserving any original product structures. Contrast to recycling, remanufacturing converses the product identity and seeks to bring the product back into an “as new” condition (Fleischmann et al., 1997).. 2.2.1 Resource Recycling Past researches on recycling are abundant. For example, Sigman (1995) compares policies for lead recycling; Palmer et al. (1997) implement policies for. 9.
(17) several different materials to find specific effects on source reduction, recycling, and waste. Recycling is performed to retrieve the material content of used products. Metal scrap, waste paper, and soft drink bottles are all examples of recycling materials. In recycling, the identity and functionality of products and components is lost. The purpose of recycling is to reuse materials from used products and components. The reasons why a manufacturer will engage in recycling are mainly driven by economic attractions and/or regulatory requirements. According to Stock (1998), recycling is account for up to 95% of total logistics costs. Recycling begins when used products and components are disassembled into parts. These parts can be separated into distinct material categories. The acceptance of used products in the marketplace depends on the perceived differences in quality and costs between used and virgin products or materials. Manufacturers must make a “demand-side” assessment by examining potential markets for each of the product recovery options (Thierry et al., 1995). Papachristos (2014) reveals that even remanufacturing of used products by the retailer and recycling by the supplier can reduce the environmental impact of the supply chain. The recycling of used products could not only save natural resources, but also contribute to the goals of sustainable development (Dobos and Floriska, 2007). For achieving sustainability, recyclable design has been promoted by firms and governments around the world. The practice heavily depends on the firms to design products with more recycled or recyclable material contents. In many markets, products made by either virgin or recycled materials are the existence of price leadership. Chen and Liu (2014) show that the brown segment's efficient quality 10.
(18) provides an “anchor product position” for the price leader regardless of whether the price leader is a brown or green firm. 3. 2.2.2 Waste Management Hicks et al. (2004) present a functional model of the supply chain for waste management and demonstrate that improved waste management practices can simultaneously reduce disposal cost as well as generating additional value through the creation of new supply chains that reuse or recycle materials. Kinnaman et al. (2014) estimates the average social cost of municipal waste management as a function of the recycling rate. Results suggest average social costs are minimized with recycling rates well below observed and mandated levels in Japan. Therefore, Japan perhaps other than developed countries may be setting inefficiently high recycling goals. As for enhancing 3R-abilities, Huang et al. (2012) construct a component matrix that considers the relationships between product components and identifies the ideal product disassembly pattern and modularity. Fullerton and Wu (1998) use a simple general equilibrium model to analyze disposal-content fees, subsidies for recyclable designs, unit-pricing of household disposal, deposit-refund systems, and manufacturer “take-back” requirements. They conclude that firms use primary and recycled inputs to produce output that has two “attributes”: packaging per unit output, and recyclability.. 3. Chen and Liu (2014) define brown and green consumers as non-environmentally conscious and. environmentally conscious consumers respectively. The firms that target the brown or green segment are brown or green firms. 11.
(19) Di Vita (2001) presents a model of endogenous growth with an exhaustible resource, in which waste recycling increases the growth rate of total input. The author shows that technological change plays a central role in increasing the quantity of secondary materials produced. To discourage disposal by encouraging recycling, Sigman (1995) examines the policies that incorporate recycling incentives: (i) taxes on the use of virgin materials; (ii) deposit/refund programs, familiar from bottle bills; (iii) subsidies for recycling; and (iv) recycled content standards, which require recycled materials to compose a certain fraction of products. Product recovery management (PRM) encompasses the management of all used and discarded products, components, and materials that fail under the responsibility of a manufacturing company. The objective of product recovery management is to recover as much of the economic (and ecological) value as reasonably possible, thereby reducing the ultimate quantities of waste (Thierry et al., 1995). Customer pressure is also found to moderate the influence of institutional factors on cooperative practices. Using primary survey data from 198 UK-based companies, Hoejmose et al. (2014) find that coercive and cooperative GSCM practices are driven by substantially different factors. Institutional pressures significantly determine cooperative approaches to GSCM while coercive practices are driven by downstream customer demands.. 2.3 Government Policies Firms are always reluctant to engage in GSCM practices for the sake of cost consideration. Many of the solid waste policies including virgin materials taxes, investment tax credits for recycling equipment and recycled content standards actually 12.
(20) focus on the inputs to production instead of on disposal itself. Palmer et al. (1997) suggest three possible price-based policies for solid waste reduction: (i) deposit/refunds, (ii) advance disposal fees (ADF), and (iii) recycling subsidies. Burby (1995) distinguishes the difference between coercive and cooperative GSCM practices. Coercive GSCM practices concern with “command and control”and require suppliers to behave in an environmentally responsible manner. On the contrary, the cooperative GSCM practices focus on flexible and “incentive-based”. The U.S. Congress, Office of Technology Assessment (1992) proposes a variety of policies for protecting the environment, e.g., tax the toxic substances, require the certain products such as newspapers a minimum percentage of using recycled content, require the certain products such as batteries manufacturers to “take back”, provide tax credits for used machinery in recycling, require local governments to collect household recycling at the curb, and require households to pay a price per unit of garbage.. 2.3.1 Governmental Regulations Since governmental green policies will regulate the decisions of using of virgin and recycled materials when manufacturing green products, it will then influence the EOL product collection rate, and thereby affect operational strategies of green supply chain members. Sheu and Chen (2012) suggest government can regulate the production of a target product based on its composition, including input amounts of virgin and recycled components as well as recycling rate through green legislation to meet the condition. But the U.S. Congress, Office of Technology Assessment (1992) states that “better product design offers new opportunities to address environmental. 13.
(21) problems, but that current governmental regulations and market practices are not sufficient to fully exploit these opportunities”. Haaland and Kind (2008) set up a simple trade model with two countries hosting one firm each. The firms invest in cost reducing R&D, and each government may grant R&D subsidies to the domestic firm. They show that it is optimal for a government to provide higher R&D subsidies to lower the level of trade costs, even if the firms are independent monopolies. Trade liberalization may damage the environment while government provides incentives or relaxes environmental policies to give domestic producers a competitive advantage. But there can be another choice for governments to grant domestic producers in R&D investment instead of merely transfer payments to reduce production cost. Ulph (1996) allows strategic behavior by both producers and governments, and investigates from the models of imperfectly competitive trade where the governments may relax environmental policies by adopting rent-shifting incentives. The author shows that (i) allowing for producers to act strategically on balance reduces the incentive for governments to act strategically; (ii) allowing governments to act strategically increases the incentive for producers to act strategically; (iii) welfare is lower when both parties act strategically; and (iv) strategic behavior by producers and governments is greater when governments use emission taxes than when they use emission standards. Hong et al. (2014) indicate that advanced recycling fees (ARFs) and government subsidy fees may curtail the demand of new products and encourage recycling the end-of-life products. The rationale is that the EPA (Environmental Protection Agency) determines the ARFs paid by the firms and the fees subsidizing recyclers to maximize 14.
(22) the social welfare in closed-loop supply chains where the firms and recyclers attempt to maximize their respective profit functions. Most governments always setup standards or requirements that the total material in production must comprise a certain fraction of secondary materials. Palmer et al. (1997) find that such standards by themselves cannot generate the optimal amount of disposal but must be combined with additional taxes on both the final product and other inputs to production.. 2.3.2 Governmental Financial Incentives Ghosh and Shah (2012) adopt a three-stage game theoretic model to analyze the effects of governmental financial intervention on green supply chain competition. They support that governments need to provide suitable incentives (subsidies or tax exemptions) to companies going green in order to ensure a non-negative green profit. Based on the equilibrium pricing and quality decisions, Chen and Liu (2014) analyze the financial incentives for the more environmentally friendly case of price leadership to be realized. They also derive insights to formulating strategies and policies to implement the practice of design for recycling. Sullivan (1981) finds the optimal subsidy on legal disposal and degree of enforcement against illegal disposal. Bohm (1981) and Dobbs (1991) avoid the problem of enforcement by finding the optimal tax on the product (deposit) and subsidy to proper disposal (refund). Palmer and Walls (1997) assess efficiency implications of an output tax, recycling subsidy, and recycled-content standard. Palmer and Walls (1997) study the problems of trash collection and disposal services by deriving an expression for the optimal product tax and tax on other inputs 15.
(23) to production that must be used in combination with a recycled-content standard. They find that recycled content standards cannot generate the optimal amount of disposal but must be combined with additional taxes on both the final product and other inputs to production. Dinan (1993) and Fullerton and Kinnaman (1995) obtain the general result that policies focusing only on input use, such as recycling subsidies and virgin materials taxes, cannot generate the optimal amount of disposal unless coupled with a tax or subsidy on consumption. For the issue of requiring total material used in production must be comprised of a certain fraction of secondary materials, Fullerton and Kinnaman (1995) show that, in the virgin materials tax case, other inputs to production must also be taxed to generate the optimum. Considering the factors such as the used-product return ratio and corresponding subsidies from governmental organizations for reverse logistics, Sheu et al. (2005) present an optimization-based model to deal with integrated logistics operational problems of GSCM. They show that both used-product return ratio and corresponding unit subsidy are significantly influencing the GSCM performance.. 16.
(24) Chapter 3. The Model. Environment protection is a critical issue attracting many policy makers’ attention. In a country, the disposal of waste material is landfilled originally. The government dedicates to establish a recycling system and grant an incentive mechanism to encourage development of new applications of waste materials for reducing the amount of waste materials under the consideration of social welfare effects. The recycling system is composed by waste material collectors, intermediate input manufactures, final products manufacturers, and final product consumers. The incentive mechanism including imposes fix advanced recycling fees (ARFs) on final product manufacturers and grant subsidy to the intermediate input manufacturer. The recycling system and incentive mechanism operate as follows: 1. The consumers buy products from final product manufacture. All the products turn out to be waste material after consumption; 2. The waste material collectors gather and transport the waste to the intermediate input manufacturers; 3. The domestic intermediate input manufacturer, receiving subsidy from government, process the waste material and produce secondary input; 4. In the open market regime, the domestic intermediate input manufacturer engages in Cournot competition with a foreign manufacturer; 5. The final products manufacture mix virgin raw materials with secondary inputs to produce final products. The government charges advanced recycling fees (ARFs) on final products.. 17.
(25) At first, this paper discusses the case of autarky, and then discusses the case that the government opens the domestic intermediate input market to foreign intermediate input manufacturers. Finally, governmental R&D subsidy would be included. For simplifying the sophisticated interactions among recycling system, the following assumptions are employed: 1. There are one intermediate input manufacturer and final products manufacture (taking the two manufacturers in abbreviation of firm I and firm F), the role of waste material collectors are omitted; 2. Firm F mixes δ unit of secondary materials produced by firm I and 1 − δ unit of virgin raw materials to produce one unit of final product, δ ∈ (0,1] . The supply of virgin raw materials is unlimited; 3. The government (G) adopts a balance budget policy.4 4. The objectives of G, F, and I are social welfare and profits respectively. 5. The superscript of the variables in this paper represents the different combination of product origins and regimes while the subscript represents the products. 5. 3.1 The Case of Autarky Suppose the country is a self-contained economy for recycling system and incentive mechanism for reducing waste materials. Assume that the government decides the rate of advanced recycling fees (ARFs) and the percentage of using secondary input, f and δ , on monopoly FFA , thus, the subsidy to FI A is fq FA .. 4. Balance budget means the government transfers all the ARFs received from firm F to domestic firm I. as subsidy. Therefore, the government’s ARFs income is not included in social welfare function. 5. For example, FIORF denotes foreign intermediate input manufacturer in the open market with R&D. regime; π IORD. *. denotes the profit of domestic intermediate input manufacturer in the autarky with. R&D regime. 18.
(26) This setting creates a simple three-stage game. Stage 1, G decides f and δ considering social welfare maximization; at Stage 2, FI A decides optimal quantity of secondary input under subsidy s = fq FA . Stage 3, FFA decides optimal quantity and price of final products under f and wIA . The three-stage game is depicted as Fig. 3.1. The backward induction is adopted to solve the problem.. Stage 1. Stage 2. Stage 3 time . G decides δ and f , considering social welfare effect . FI A decides optimal profit under s . FFA decides optimal profit . under f and wIA . Fig. 3.1 The three‐stage game of autarky . At Stage 3, the monopoly final products manufacture decides optimal quantity and price of final products. Assume that the inverse demand function of domestic final products is. pFA = a − qFA ,. a>0. (1). The objective function of FFA is. π FA = ( a − q FA − wIA − wVA − f − cFA ) q FA. (2). where wIA , wVA , f , and cFA denote the final products’ cost of intermediate secondary input, intermediate virgin input, the rate of ARFs, and final products manufacturing cost, respectively. For simplification, normalize cFA = 0 and wVA = 0 . Eq. (2) can be rewritten as. π FA = (a − qFA − wIA − f )qFA. (2’). 19.
(27) From the FOC of Eq. (2’), a − 2qFA − wIA − f = 0 , and Eq. (1), obtains. q. A* F. * ⎛ a − wIA − f ⎞ * a − wIA − f a + wIA + f ⎟⎟ , π FA = ⎜⎜ = , p FA = 2 2 2 ⎝ ⎠. 2. (3). At Stage 2, the secondary intermediate input manufacturer decides optimal quantity and price. Since the demand of secondary intermediate input is derived from the output of final products, assume that one unit of final product needs δ unit of secondary intermediate input, qFA = δqIA , δ ≠ 0 . The demand function of secondary *. intermediate input is 6. wIA = a − f − 2qFA = a − f − 2δqIA *. (4). Since FI A is the only supplier of FFA , the objective function of FI A is. π IA = ( wIA − cIA )qIA + fqFA *. (5). Replace qFA = δqIA into Eq. (5) *. π IA = ( wIA − cIA + fδ )qIA. (5’). Maximizing Eq. (5’) yields a − f − cIA + fδ , 4δ * a − f + cIA − fδ , wIA = 2 (a − f − cIA + fδ ) 2 A* πI = 8δ *. *. qIA = qIA =. (6). Comparative static analysis of π IA with respect to cIA is *. ∂π IA a − f − cIA + fδ = − <0 ∂cIA 4δ *. 6. *. q FA =. (7). a − wIA − f a − wIA − f = δq IA ⇒ q IA = ⇒ wIA = a − f − 2δq IA . 2 2δ 20.
(28) Eq. (7) reveals that FI A can increase its profit by cost reduction.. For given condition of qFA = δqIA , it can derive *. ⎛ a − f − cIA + fδ ⎞ * a − f − cIA + fδ (3a + f + cIA − fδ ) ⎟⎟ , pFA = , π FA = ⎜⎜ q = 4 4 4 ⎝ ⎠ A* F. 2. (8). At Stage 1, the domestic government G decides to regulate the rate of ARFs. f. and the percentage of using secondary intermediate input δ. under the. consideration of domestic social welfare. The social welfare of domestic country under the autarky regime is defined and calculated as. SW A =CS A + π IA + π FA − *. *. *. μ 2. *2. qFA =. ((3 − μ )δ + 4)(a − f − cIA + fδ ) 2 32δ. (9). where μ represents the parameter of disposal material disutility. When the used final products become useless, they will bring negative impact on social welfare. Consider the disposal material disutility cannot cause a negative social welfare, 7 μ must be confined μ ≤ (4 + 3δ ) / δ . Comparative static analyses of social welfare with respect to f , δ , and c IA are given by ∂SW A ((3 − μ )δ + 4)(1 − δ )(a − f − cIA + fδ ) =− 16δ ∂f. (10). ∂SW A (a − cIA − f + fδ )(2a − 6 − 2cIA + fδ ( μ − 1)) =− ∂δ 16δ 2. (11). ((3 − μ )δ + 4)(a − f − cIA + fδ ) ∂SW A = − 16δ ∂cIA. (12). *. *. *. From Eqs. (10) and (11), it can be seen that an increase of f or δ will *. promote social welfare, ∂SW A /∂f > 0 and ∂SW A /∂δ > 0 , if the disutility of 7. *. Otherwise, that kind of final product may not be allowed to produce by the government. 21.
(29) disposal material μ is large enough, (3 − μ )δ + 4 < 0 . The reasons of those results are: when G collects ARFs from FFA , it will raise the price and reduce the amount of final products and then further lessen the disposal material impact on social welfare. Similarly, the social welfare growth caused by δ increasing is initiated by disposal material reduction. In all, the social welfare is improved while f or δ increases. Surprisingly, in Eq. (12), ∂SW A /∂cIA > 0 under large μ . It means that a large *. disutility of disposal material makes G reluctant to urge FI A to improve efficiency for the sake of social welfare. The rationale is whenever FI A improves its production efficiency, it will enhance the ability to provide much cheaper and more amount of secondary intermediate input, thus induces FFA to produce more final products. The disutility of disposal material is further deteriorated because of the increasing used final products.. 3.2 Open Domestic Intermediate Input Market. Suppose the government open domestic secondary intermediate input market to import foreign secondary intermediate input produced by FIOF . The costs for FIOD and FIOF to produce secondary intermediate inputs are cIOD and cIOF . Assume that. FIOD is less efficient than that of its foreign competitor FIOF in producing secondary intermediate input, cIOD > cIOF . If the cost difference is cIOD − cIOF = ε , ε > 0 . Without loss of generality, let cIOF = 0 , then cIOD = ε . The other setting is the same as section 3.1 except G will levy import tariff τ on FIOF . The three-stage game of open domestic intermediate input market is depicted as Fig. 3.2. Stage 1 Stage 2. Stage 3 time. G decides δ , τ and f , considering social welfare effect . FIOD and FIOF engage in Cournot competition to decide optimal profits under s and τ . FFO decides optimal profit. under δ and f. Fig. 3.2 The three‐stage game of open domestic Intermediate input market 22.
(30) Since the final products are produced by the monopoly manufacture, the setting of Stage 3 is the same as section 3.1. The optimal price and quantity of final products and profit of final products manufacture are presented as * 2( a − f ) − τ − ε + fδ 2 ( 2 a + f ) + τ + ε − fδ , p FO = , 6 6. *. q FO =. π. O* F. ⎛ 2( a − f ) − τ − ε + fδ ⎞ =⎜ ⎟ 6 ⎝ ⎠. 2. (13). At Stage 2, The FIOD and FIOF engage in Cournot competition to decide optimal quantity and price of secondary input. The demand function of secondary intermediate input is the same as Eq. (4). wIO = a − f − 2qFO = a − f − 2δQI , QI = qIOD + qIOF *. (14). The objective functions of FIOD and FIOF are. π IOD = ( wIO − ε )qIOD + fδQIO , QIO = qIOD + qIOF . (15). π IOF = ( wIO − τ )qIOF. (16). Solve Eqs. (15) and (16) simultaneously, obtained * a − f + τ − 2ε + 2 fδ a − f − 2τ + ε − fδ , qIOF = , 6δ 6δ * 2(a − f ) − τ − ε + fδ a − f + τ + ε − fδ * QI = , wIO = , 6δ 3 * (a − f + τ − 2ε + 2 fδ ) 2 + 3 fδ (a − f − 2τ + ε − fδ ) π IOD = , 18δ * (a − f − 2τ + ε − fδ )2 π IOF = 18δ *. qIOD =. Comparative static analysis of π IOD. *. (17). with respect to ε is. ∂π IOD 1 ⎛ 2(a − f + τ − 2ε + 2 fδ ) f ⎞ =− ⎜ + ⎟<0 ∂ε 3⎝ 3δ 2⎠ *. 23. (18).
(31) Eq. (18) expresses the fact that FIOD has the willingness to improve its efficiency for increasing profit. From Eqs. (7) and (18), the conclusion is describe as Proposition 1.. Proposition 1: Domestic secondary intermediate input manufacturer has the. willingness to enlarge its profit by efficiency improvement in both autarky and open market regime. At Stage 1, G decides to regulate f , δ and τ under the consideration of domestic social welfare. The social welfare of domestic country under the open domestic intermediate input market regime is defined and calculated as ∗. ∗. SW O = CS O + π FO + π IOD + τqIOF − *. *. μ. qFO. *2. 2 (3 − μ ) ⎛ 2(a − f ) − τ − ε + fδ ⎞ ⎛ (a − f + τ − 2ε + 2 fδ ) 2 f (a − f − 2τ + ε − fδ ) ⎞ ⎟⎟ = − ⎜ ⎟ + ⎜⎜ 18δ 2 ⎝ 6 6 ⎠ ⎝ ⎠ 2. +. τ (a − f − 2τ + ε − fδ )2 18δ. (19) Comparative static analyses of social welfare with respect to f , δ , τ , and ε are given by (3 − μ )(δ − 2)(2a − 2 f − τ − ε + fδ ) ∂SW O = ∂f 36 *. ⎛ (2δ − 1)(a − f + τ − 2ε + 2 fδ ) (δ + 1)(a − f − 2τ + ε − fδ ) ⎞ +⎜ + ⎟ 9δ 6 ⎝ ⎠ τ (1 + δ )(a − f − 2τ + ε − fδ ) − 9δ. 24. (20).
(32) ∂SW O f (3 − μ )(2a − 2 f − τ − ε + fδ ) = 36 ∂δ ⎛ (a − f + τ − 2ε + 2 fδ )(4 fδ − 1)(a − f + τ − 2ε + 2 fδ ) f 2 ⎞ ⎟ + ⎜⎜ + 18δ 2 6 ⎟⎠ ⎝ τ a − f − 2τ + ε ) 2 − f 2δ 2 − 18δ 2. (21). ∂SW O − (3 − μ )(2a − 2 f − τ − ε + fδ ) = ∂τ 36 a − f + τ − 2ε + 5 fδ 2τ (a − f − 2τ + ε − fδ ) + − 9δ 9δ. (22). ∂SW O − (3 − μ )(a − f − τ − ε + fδ ) 4(a − f + τ − 2ε ) + 11 fδ = − 36 ∂ε 18δ τ (a − f − 2τ + ε − fδ ) + 9δ. (23). *. (. ). *. *. Observe Eqs. (20)~(23), if the disposal material disutility is large enough, μ > 3 , ∂SW O / ∂f > 0 , ∂SW O / ∂δ < 0 , ∂SW O / ∂τ > 0 , and ∂SW O / ∂ε > 0 are all tenable. The *. *. *. *. main causes of these results lay in the facts that any factor that will add to the amount of final products may result in disutility increasing and thus reduces social welfare. Therefore, increasing f , τ , and ε are unambiguously increase social welfare. Yet, the effect of increasing δ is diverse. In the open market regime, part of the source of secondary intermediate input comes from foreign country instead of collecting domestic used final products. It will remain the negative impact brought by domestic used final products. While adopting foreign secondary intermediate input will shrink the effect on social welfare via the effort of reducing domestic disposal material. From the discussion on the effect of governmental disposal material policies on social welfare in both autarky and open market regime, the conclusion is summarized as Proposition 2.. Proposition 2: If the disposal material disutility is large enough, the effect of. governmental disposal material policies on social welfare are: (1) The higher ARFs the government collects, the higher the social welfare would be in both autarky and open market regime;. 25.
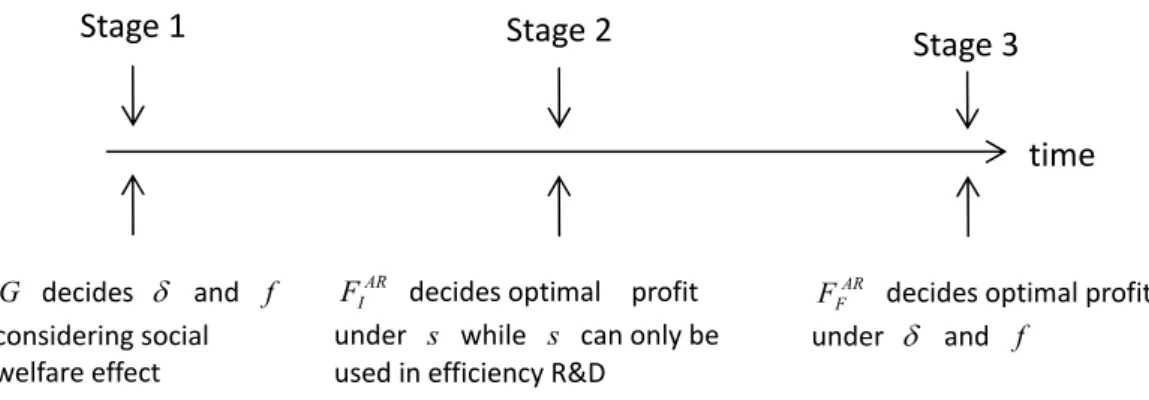
(33) (2) The higher (lower) percentage of using secondary intermediate input the government regulates, the higher the social welfare would be in autarky (open market) regime; (3) The more efficient the domestic secondary intermediate input manufacturer is, the less the social welfare would be in both autarky and open market regime; (4) In open market regime, the higher tariff the government levies on foreign secondary intermediate input importer, the higher the social welfare would be. Compare Proposition 1 and Proposition 2 (3), it is easy to discover that the domestic secondary intermediate input manufacturer will dedicate to pursue efficiency improvement for raising its own profit while the government is on the opposite side for the consideration of social welfare. This is a common phenomenon existed in many social disgust products, e.g., health hazard and heavy polluted products.. 3.3 R&D Subsidy in the Case of Autarky. Assume that the domestic intermediate input manufacture FI ARD applies the granted subsidy from government to promote its process efficiency R&D. The other settings are the same as section 3.1. The three-stage game of R&D subsidy is depicted as Fig. 3.3. Stage 1. Stage 2. Stage 3 time . G decides δ and f considering social welfare effect . FI AR decides optimal profit under s while s can only be used in efficiency R&D . FFAR decides optimal profit under δ and f . Fig. 3.3 The three-stage game of R&D subsidy on domestic Intermediate input. 26.
(34) At Stage 3, the behavior of FFAR is the same as section 3.1. The demand function of intermediate input is the same as Eq. (5) At Stage 2, FI AR invests its subsidy received from G in efficiency R&D. Assume that G adopts balance budget policy and transfers the entire ARFs to the FI AR as a subsidy of R&D expenses, 8 fq FAR = sx , where s is the per-unit R&D subsidy. The objective function of FI ARD can be written as: 9 2. π. = (w. AR I. AR I. −c. AR I. + x )q AR. AR I. * x AR −γ + fq FAR 2. (24). where γ denotes the parameter of R&D efforts; x AR is the R&D performance of 2. cost reduction while FI. AR. x AR , 0 ≤ x AR ≤ cIAR . invests γ 2. As the same rationality of Eq. (4), wIAR = a − f − 2q FAR = a − f − 2δq IAR , the FOC *. of Eq. (24) with respect to q IAR yields *. a − f − c IAR + x AR + fδ 4δ AR a − f + c I − x AR − fδ = 2. q IAR = wIAR. π. *. AR * I. (25). (a − f − c IAR + x AR + fδ ) 2 x AR = −γ 8δ 2. 2. From Eq. (25), let ∂π IAR / ∂x AR = 0 , the optimal R&D performance is *. *. x AR =. a − f − cIAR + fδ 4γδ − 1. (26). 8. The government’s ARFs income is not included in social welfare function.. 9. Refer the setting of d’Aspremont and Jacquemin (1988) and Hinloopen (2000). 27.
(35) Comparative static analyses of optimal R&D performance with respect to f and δ are given by ∂x AR 1− δ =− <0 ∂f 4γδ − 1 *. ∂x AR 4γ (a − f − cIAR ) + f =− < 0 ∂δ (4γδ − 1) 2 *. (27). *. ∂x AR 1 =− <0 AR ∂cI 4γδ − 1. Observe Eq. (27), it is obvious that the increasing of f , δ and cIAR will reduce the level of optimal R&D performance of FI AR . When FI AR considers the effect of cost reduction affecting on its profit,. ∂π IAR ∂c IAR. *. ∂x AR − (1 − AR )(a − f − cIAR + x AR + fδ ) ∂cI ∂x AR = − γx AR AR < 0 4δ ∂cI. (28). Eq. (28) implies that efficiency improvement may raise the profit of domestic intermediate input manufacture. The following results at Stage 3 can be derived under the condition of *. *. q FAR = δq IAR and replaced x AR by (a − f − cIAR + fδ ) /(4γδ − 1) : *. *. qFAR = *. pFAR =. π. AR * F. γδ (a − f − cIAR + fδ ) 4γδ − 1 (2γδ − 1)(3a + f + cIAR − fδ ) + a 2(4γδ − 1). ⎛ γδ (a − f − cIAR + fδ ) ⎞ ⎟⎟ = ⎜⎜ 4γδ − 1 ⎝ ⎠. (29). 2. At Stage 1, the social welfare in the regime of autarky R &D is SW AR =CS AR + π FAR + π IAR − *. =. *. γ (a − f − c 2. AR I. *. *. μ. q FAR. *2. 2 ⎞ + fδ ) ⎛ (3 − μ )δ + 4 1 ⎜⎜ ⎟ − 2 ⎟ ⎝ 16(γδ − 1) (4γδ − 1) ⎠ 2. 28. (30).
(36) Comparative static analyses of social welfare with respect to f , δ , cIAR , and. γ are given by ⎛ (3 − μ )δ + 4 ∂SW AR 1 ⎞ ⎟ = γR(δ − 1) ⋅ ⎜⎜ − ∂f 4γδ − 1 ⎟⎠ ⎝ 16(γδ − 1) *. (31). ⎛ (2 fδ (γδ −1) − R)(3 − μ) + 4(2 f (γδ −1) − γR)) f + 4γ (R − fδ ) ⎞ ∂SW AR ⎟ (32) = γR ⋅ ⎜⎜ + ∂δ 32(γδ −1)2 (4γδ −1)3 ⎟⎠ ⎝ *. ⎛ − ((3 − μ )δ + 4) ∂SW AR 1 ⎞ ⎟ = γR ⋅ ⎜⎜ + AR ∂cI 4γδ − 1 ⎟⎠ ⎝ 16(γδ − 1). (33). 4γδ + 1 ⎞ R 2 ⎛ − ((3 − μ )δ + 4) ∂SW AR ⎟ = ⋅ ⎜⎜ + 2 2 ⎝ 16(γδ − 1) (4γδ − 1) 3 ⎟⎠ ∂γ. (34). *. *. where R = a − f − cIAR + fδ . Observe Eqs. (31)~(34), if the disposal material disutility is large enough, μ >> 3 , it is obvious that ∂SW AR / ∂f > 0 , ∂SW AR / ∂c IAR > 0 and ∂SW AR / ∂γ > 0 . *. *. *. Those results imply that either increases the cost of final products manufacture directly (increasing ARFs) or indirectly (manufacturer’s cost c IAR or R&D expenditure γ ) will reduce the amount of final products and then their inevitable disposal material disutility. Thus, the social welfare increases. Concerning about ∂SW AR / ∂δ < 0 , Eq. (27), ∂x AR / ∂δ < 0 , expresses that increasing intermediate input *. *. usage will mitigate the R&D performance of domestic intermediate input manufacturer and then raise the price of intermediate input. This fact results in the decreasing of output of the final products and further reduces the disposal material disutility. Therefore, the social welfare increases.. 3.4 R&D Subsidy in the Case of Open Domestic Intermediate Input Market. Assume that the government G open the domestic intermediate input market, the domestic intermediate input manufacture FIORD devotes its effort on efficiency R&D employing the subsidy granted from G and engage in Cournot competition 29.
(37) with its foreign competitor FIORF . The rest settings are the same as section 3.2. The three-stage game is depicted as Fig. 3.4. At Stage 3, the monopoly final products manufacture decides optimal quantity and price of final products. The setting of Stage 3 is the same as section 3.2. At Stage 2, the domestic and foreign intermediate input manufacturers engage in Cournot competition to decide optimal quantity and price of secondary input Stage 1. Stage 2. Stage 3 time . G decides δ , τ and f , considering social welfare effect . FIORD and FIORF engage in Cournot competition to decide optimal profits under s and τ while s can only be used in efficiency R&D . FFOR decides optimal profit under δ , τ and f . Fig. 3.4 The three‐stage game of R&D subsidy on domestic Intermediate input . The demand function of intermediate input is. wIOR = a − f − 2δQIOR , QIOR = qIORD + qIORF. (35). Assume that G adopts balance budget policy and transfers the entire ARFs to the domestic intermediate input manufacturer as a subsidy of R&D expenses. The objective functions of FIORD and FIORF are: 2. π IORD = ( wIOR − ε + x OR )qIORD − γ. x OR + fδQIOR 2. π IORF = ( wIOR − τ )qIORF. (36). (37). Solve Eqs. (36) and (37) simultaneously, obtained. 30.
(38) *. * a − f + τ − 2ε + 2 x OR + 2 fδ a − f − 2τ + ε − x OR − fδ , q IORF = , 6δ 6δ * 2(a − f ) − τ − ε + x OR + fδ a − f + τ + ε − x OR − fδ , wIOR = , = 3 6δ. q IORD = QIOR. *. π. ORD * I. (a − f + τ − 2ε + 2 x OR + 2 fδ ) 2 f (a − f − 2τ + ε − x OR − fδ ) x OR = + −γ , 18δ 6 2. π. ORF * I. ⎛ a − f − 2τ + ε − x OR − fδ ⎞ ⎟⎟ = ⎜⎜ 3 ⎝ ⎠. 2. 2. (38) *. *. The FOC of π IORD with respect to xOR , ∂π IORD / ∂x OR = 0 , yields. 2(a − f + τ − 2ε + fδ ) 9δγ − 4. *. x OR =. (39). Comparative static analysis of x OR with respect to f , ε , τ , and γ are *. ∂x OR − (1 − δ ) ∂x OR −4 = < 0, = < 0 , ∂f 9δγ − 4 ∂ε 9δγ − 4 *. *. ∂x OR 2 ∂x OR − 2(9γ (a − f + τ − 2ε ) + 4 f ) = > 0, = < 0, ∂τ 9δγ − 4 ∂δ (9δγ − 4) 2 *. *. (40). ∂x OR − 18δ (a − f + τ − 2ε + fδ ) = <0 ∂γ (9δγ − 4) 2 *. Eq. (40) shows that an increasing of τ will boost the level of optimal R&D performance, while the increasing of f , ε , δ and γ will result in reverse outcome. Comparative static analysis of π IORD with respect to ε is *. *. ∂π IORD ∂ε. *. * ∂x OR − 2(1 − )(a − f + τ − 2ε + 2 x OR + 2 fδ ) ∂ε = 9δ *. ∂x OR f (1 − ) OR * OR * ∂x ∂ ε + − γx <0 ∂ε 6. 31. (41).
(39) Eq. (41) states that FIORD can raise its profit by efficiency improvement. From Eqs. (28) and (41), Proposition 3 is concluded as:. Proposition 3: Domestic secondary intermediate input manufacturer may enlarge its. profit by engaging in efficiency improvement R&D in both autarky and open market regime. Compare Proposition 1 and Proposition 3, the two descriptions are almost the same. Yet, Proposition 1 focuses on the domestic secondary intermediate input manufacturer’s willingness to reduce production cost; while Proposition 3 highlights that manufacturer’s ex post efficiency improvement R&D results. Under the condition of qFOR = δQIOR , the optimal price and quantity of final *. *. products and profit of FFOR are presented as *. 2(a − f ) − τ − ε + x OR + fδ 6 2(2a + f ) + τ + ε − x OR − fδ = 6. qFOR = pFOR. π. *. OR * F. (42). ⎛ 2(a − f ) − τ − ε + x OR + fδ ⎞ ⎟⎟ = ⎜⎜ 6 ⎝ ⎠. 2. At Stage 1, the social welfare of domestic country under the open domestic intermediate input market regime with R&D is denoted as SW OR =CS OR + π FOR + π IORD + τπ IORF − *. *. *. *. *. μ 2. qFOR. *2. 2. (3 − μ ) ⎛⎜ 2(a − f ) − τ − ε + x + fδ ⎞⎟ = ⎟ 2 ⎜⎝ 6 ⎠ * * (43) OR 2 ⎛ (a − f + τ − 2ε + 2 x + 2 fδ ) f (a − f − 2τ + ε − x OR − fδ ) ⎞⎟ +⎜ + ⎜ ⎟ 6 18δ ⎝ ⎠ OR *. x OR −γ 2. *2. ⎛ a − f − 2τ + ε − x OR * − fδ ⎞ ⎟ +τ ⎜ ⎟ ⎜ 3 ⎠ ⎝. 32. 2.
(40) Comparative static analyses of social welfare with respect to f , δ , τ , ε and. γ are given by *. ∂SW ∂f. (3 − μ )(δ − 2 +. OR*. =. * ∂xOR )(a − f + τ − 2ε + 2 xOR + 2 fδ ) ∂f 36. OR* OR* ⎛ ⎞ ⎜ (a − f − 2τ + ε − xOR* − fδ )(2δ − 1 + 2 ∂x ) f (1 + δ + ∂x ) + (a − f − 2τ + ε − xOR* − fδ ) ⎟ ⎜ ⎟ ∂f ∂f +⎜ − ⎟ 9δ 6 ⎜ ⎟ ⎜ ⎟ ⎝ ⎠ *. 2τ (a − f − 2τ + ε − xOR − fδ )(1 + δ + *. − γxOR. *. OR*. ∂x ∂f. −. ∂xOR ) ∂f. 9. (44). OR *. ∂SW ∂δ. ⎡ (3 − μ )(2( a − f ) − τ − ε + x OR * + fδ ) 2( a − f + τ − 2ε + 2 x OR * + 2 fδ ) ⎤ + ⎢ ⎥ ∂x 36 9δ ⎥ =(f + )⎢ * ⎥ ∂δ ⎢ f 2τ ( a − f − 2τ + ε − x OR − fδ ) ⎢− − ⎥ (45) 9 ⎣ 6 ⎦ OR *. OR * ∂x ( a − f + τ − 2ε + 2 x OR + 2 fδ ) 2 − γx OR 2 ∂δ 18δ *. −. *. ⎡ (3 − μ)(2(a − f ) −τ − ε + xOR* + fδ ) ⎤ ⎢− ⎥ OR* OR* 36 ∂SW ∂x ⎢ ⎥ =(1− ) * ⎛ a − f − 2τ + ε − xOR* − fδ ⎞⎥ ∂ε ∂ε ⎢ ⎛⎜ − 2(a − f +τ − 2ε + 2xOR + 2 fδ ) f ⎞⎟ ⎟⎥ ⎢+ + + 2τ ⎜ ⎜ ⎟⎥ 9δ 6 ⎟⎠ 3 ⎢ ⎜⎝ ⎝ ⎠⎦ ⎣. (46). *. − γxOR ⋅ *. ∂xOR ∂ε. *. (3 − μ )(2. OR*. ∂SW ∂τ. =. * ∂xOR + 1)(a − f + τ − 2ε + 2 xOR + 2 fδ ) ∂τ 36. OR* OR* ⎞ ⎛ ⎜ − (a − f − 2τ + ε − xOR* − fδ )(1 + 2 ∂x ) f (2 + ∂x ) ⎟ OR* ∂τ − ∂τ ⎟ − γxOR* ∂x +⎜ ⎟ ⎜ ∂τ 9δ 6 ⎟ ⎜ ⎠ ⎝ *. (a − f − 2τ + ε − xOR − fδ ) 2 − 2τ (a − f − 2τ + ε − xOR − fδ )(2 + *. +. *. 9. 33. ∂xOR ) ∂τ. (47).
(41) ∂SW OR (3 − μ )(2(a − f ) − τ − ε + x OR + fδ ) ∂x OR = ⋅ 36 ∂γ ∂γ *. *. *. * OR * ⎛ ∂x OR ⎜ 2(a − f + τ − 2ε + 2 x OR * + 2 fδ ) ⋅ ∂x f⋅ ⎜ ∂γ ∂γ +⎜ − 9δ 6 ⎜ ⎜ ⎝. ⎞ ⎟ OR * ⎟ OR * ∂x ⎟ − γx ⋅ ∂γ ⎟ ⎟ ⎠. (48). ⎛ a − f − 2τ + ε − x OR * − fδ ⎞ ∂x OR * ⎟⋅ − 2τ ⎜ ⎟ ∂γ ⎜ 9 ⎠ ⎝. Observe Eqs. (44)~(48), if the disposal material disutility is large enough, μ >> 3 , it is easy to notice that ∂ SW OR / ∂ f > 0 , ∂SW OR / ∂δ < 0 , ∂SW OR / ∂ε > 0 , *. *. *. ∂SW OR / ∂τ < 0 and ∂SW OR / ∂γ > 0 . Those results indicate that the increasing of *. *. ARFs ( f ), the efficiency difference of domestic intermediate input manufacturer ( ε ), and R&D effort ( γ ) will increase the social welfare. While the increasing of tariff rate of imported intermediate input ( τ ), and the percentage of using intermediate input ( δ ), will decrease the social welfare. From the discussion on the effect of governmental disposal material policies on social welfare when the domestic secondary intermediate input manufacturer engages in process efficiency improvement R&D in both autarky and open market regime, the conclusion is summarized as Proposition 4.. Proposition 4: If the disposal material disutility is large enough and the domestic. secondary intermediate input manufacturer engages in process efficiency improvement R&D, the effect of governmental disposal material policies on social welfare are: (1) The higher ARFs the government collects, the higher the social welfare would be in both autarky and open market regime; (2) The lower percentage of using secondary intermediate input the government regulates, the higher the social welfare would be in both autarky and open market regime; (3) The more efficient the domestic secondary intermediate input manufacturer is, the less the social welfare would be in both autarky and open market regime;. 34.
(42) (4) In open market regime, the lower tariff the government levies on foreign secondary intermediate input importer, the higher the social welfare would be; (5) If the domestic secondary intermediate input manufacturer has to devote more effort on R&D, the higher the social welfare would be in both autarky and open market regime. Observe Proposition 3 and Proposition 4 (3), the paradoxical behavior on efficiency attention between the government and the domestic secondary intermediate input manufacturer is still existed in both autarky and open market with R&D regime. Compare Proposition 2 and Proposition 4, it can be seen that the social welfare effects of governmental recycling policies, including ARFs ( f ) and the percentage of using intermediate input ( δ ), are the same in both autarky and open market with R&D regime. In addition, the social welfare effects of domestic secondary intermediate input manufacturer’s behaviors are also the same, including the efficiency improvement ( cIAR or ε ) and the effort devoted in R&D ( γ ) in both autarky and open market with R&D regime. There are two other findings deserved to be mentioned. First, the social welfare effect of δ is negative in all regimes except in autarky regime (i.e., ∂SW A /∂δ > 0 , *. ∂SW O / ∂δ < 0 , ∂SW AR / ∂δ < 0 , and ∂SW OR / ∂δ < 0 ). The reason is when the *. *. *. government regulates higher percentage of using intermediate input will effectively reduce the quantity of final products, and then reduce the amount of disposal materials in the autarky regime. But this effect is diluted by R&D effort and open market policy. Second, the social welfare effect of τ is positive (negative) in the open market (open market with R&D) regime (i.e., ∂SW O / ∂τ > 0 , ∂SW OR / ∂τ < 0 ). The rationale is, in *. *. the open market regime, a higher tariff will lessen the quantity of foreign secondary intermediate input and increase the social welfare. While the domestic secondary intermediate input manufacturer engages in cost reduction R&D, a lower tariff will trigger fierce competition between domestic and foreign secondary intermediate input manufacturers and results in social welfare decline.. 35.
(43) Chapter 4. Conclusion. Environment protection is a critical issue attracting many policy makers’ attention. For protecting the environment from being destroyed, governments and manufacturers have started to make efforts on recycling and effectively use resources in order to reduce their impact on the environment. For implementing recycling and reducing waste effectively, the government plays a significant role in involving the green supply chain management. Under the consideration of social welfare, the government may encourage final product manufacturers to adopt more secondary intermediate inputs, and set up a feasible incentive mechanism for domestic intermediate input manufacturers to improve their efficiency are important issues. This paper discusses four scenarios under the consideration of social welfare effects. At first, we discuss the case of autarky, and then discuss the case that the government opens the domestic intermediate input market to foreign intermediate input manufacturers. Finally, governmental R&D subsidy would be included in both above cases. In both autarky and open market regime, we find that domestic secondary intermediate input manufacturer has the willingness to enlarge its profit by efficiency improvement. If the disposal material disutility is large enough, the effect of governmental disposal material policies on social welfare are: (1) The higher ARFs the government collects, the higher the social welfare would be in both autarky and open market regime; (2) The higher (lower) percentage of using secondary intermediate input the government regulates, the higher the social welfare would be in 36.
(44) autarky (open market) regime; (3) The more efficient the domestic secondary intermediate input manufacturer is, the less the social welfare would be in both autarky and open market regime; (4) In open market regime, the higher tariff the government levies on foreign secondary intermediate input importer, the higher the social welfare would be. If the domestic secondary intermediate input manufacturer engages in efficiency improvement R&D, its profit would be enlarged in both autarky and open market regime with R&D. In addition, if the disposal material disutility is large enough and the domestic secondary intermediate input manufacturer engages in process efficiency improvement R&D, the effect of governmental disposal material policies on social welfare are: (1) The higher ARFs the government collects, the higher the social welfare would be in both autarky and open market regime; (2) The lower percentage of using secondary intermediate input the government regulates, the higher the social welfare would be in both autarky and open market regime; (3) The more efficient the domestic secondary intermediate input manufacturer is, the less the social welfare would be in both autarky and open market regime; (4) In open market regime, the lower tariff the government levies on foreign secondary intermediate input importer, the higher the social welfare would be; (5) If the domestic secondary intermediate input manufacturer has to devote more effort on R&D, the higher the social welfare would be in both autarky and open market regime. We discover that the domestic secondary intermediate input manufacturer not only has the ex-ante willingness to reduce production cost but also can create ex post efficiency improvement R&D performance. But there exists the paradoxical behavior on efficiency attention between the government and the domestic secondary intermediate input manufacturer. The domestic secondary intermediate input manufacturer will dedicate to pursue efficiency improvement for raising its own profit while the government is on the opposite side for the consideration of social welfare. There are two other findings deserved to be mentioned. First, the social welfare effect of the percentage of using secondary intermediate input is negative in all 37.
(45) regimes except in autarky regime. Second, the social welfare effect of tariff is positive (negative) in the open market (open market with R&D) regime.. 38.
數據
相關文件
Robinson Crusoe is an Englishman from the 1) t_______ of York in the seventeenth century, the youngest son of a merchant of German origin. This trip is financially successful,
fostering independent application of reading strategies Strategy 7: Provide opportunities for students to track, reflect on, and share their learning progress (destination). •
Strategy 3: Offer descriptive feedback during the learning process (enabling strategy). Where the
How does drama help to develop English language skills.. In Forms 2-6, students develop their self-expression by participating in a wide range of activities
In addition that the training quality is enhanced with the improvement of course materials, the practice program can be strengthened by hiring better instructors and adding
Hope theory: A member of the positive psychology family. Lopez (Eds.), Handbook of positive
The entire moduli space M can exist in the perturbative regime and its dimension (∼ M 4 ) can be very large if the flavor number M is large, in contrast with the moduli space found
2-1 註冊為會員後您便有了個別的”my iF”帳戶。完成註冊後請點選左方 Register entry (直接登入 my iF 則直接進入下方畫面),即可選擇目前開放可供參賽的獎項,找到iF STUDENT
