Arsenic methylation, GSTO1 polymorphisms, and metabolic
syndrome in arseniasis endemic area of southwestern Taiwan
Jein-Wen Chen1, PhD; Wan-Fen Li1, PhD; Ya-Hui Wang1, MSc; Yeou-Lih Huang2, PhD; Chien-Wen Sun1, MSc; Chien-Jen Chen3, PhD; Shu-Li Wang1,4*, PhD
1Division of Environmental Health and Occupational Medicine, National Health Research Institutes, Taiwan;
2Faculty of Biomedical Laboratory Science, Kaohsiung Medical University; 3Genomic Research Center, Academia Sinica, Taipei, Taiwan;
4Department of Public Health, China Medical University, Taichung, Taiwan
* Address correspondence to:
Dr. Shu-Li Wang,
Division of Environmental Health and Occupational Medicine, National Health Research Institutes, 35, Keyan Road, Zhunan Town, Miaoli County 350, Taiwan, ROC.
Tel.: +886 (0) 37 246 166 extn. 36509. Fax: +886 (0) 37-587 406. E-Mail: [email protected].
Running head: Arsenic and metabolic syndrome
Abstract 1
Previous studies have shown that hair arsenic (As) levels are associated with an 2
increased prevalence of metabolic syndrome (MetS), which is a strong predictor for 3
type 2 diabetes. The objective of this study was to evaluate whether urinary arsenic 4
methylation is related to MetS in the arseniasis endemic area of southwestern 5
Taiwan, taking genetic factors into account. Subjects were from a community-based 6
cohort recruited in 1990 from three villages in Putai township. In 2002-2003, 247 7
subjects were successfully followed, including urinary arsenic speciation 8
measurements and single-nucleotide polymorphism determinations. We found that 9
subjects with MetS drank from well water with higher As concentrations. Multiple 10
logistic regression analysis showed that the odds ratio (OR) of MetS significantly 11
increased with increasing dimethylarsinic acid ratios (dimethylarsinic acid 12
levels/Total As) and decreasing monomethylarsonic acid ratios (monomethylarsonic 13
acid levels/Total As). The highest OR (4.65, 95% CI: 2.22-9.73, p<0.001) was found 14
in the higher secondary methylation index group with the GSTO1 AA genotype 15
compared to the reference group with lower secondary methylation index and the 16
GSTO1 AA genotype. Our findings suggested that a decreasing monomethylarsonic 17
acid ratio is associated with an increased risk of MetS and that this risk might be 18
marginally modified by the GSTO1 genotype among As-exposed subjects. 19
20
Keywords: arsenic, metabolic syndrome, type 2 diabetes mellitus, risk factor, 21
methylation 22
1. Introduction 24
Due to the lack of treated tap water and the high salinity of shallow well water 25
during 1910-1960s, the local residents (before the 1970s) in an arseniasis endemic 26
area of southwestern Taiwan typically consumed artesian well water with arsenic 27
(As) concentrations as high as 0.7-0.93 mg/L (Kuo, 1964). Several studies have 28
shown a dose-response relationship between As in drinking water and the prevalence 29
of diabetes mellitus in southwestern Taiwan (Wang et al., 2003). 30
As is abundant in the environment (Smith et al., 2002) and its threat in the 31
Western Pacific region has been noted (Suk et al., 2003). A great deal of new 32
information is emerging from the extensive research on the health effects of chronic 33
As toxicity (Guha Mazumder, 2008). Chronic exposure to high levels of inorganic 34
As (iAs) is associated with a wide range of human ailments including cancer, 35
arteriosclerosis, hypertension, and type 2 diabetes (T2D) (Fu et al., 2010). Recently 36
it has been shown that even low levels of exposure to iAs in drinking water may 37
play a role in the prevalence of T2D (Navas-Acien et al., 2008). Groundwater and 38
industrial materials are important sources of As (Nordstrom, 2002). Epidemiological 39
studies carried out in Taiwan (Chiou et al., 2006), Bangladesh (Nabi et al., 2005), 40
and Mexico (Coronado-Gonzalez et al., 2007) have shown a strong diabetogenic 41
effect of As in humans. 42
It is recognized that iAs contributes to oxidative stress in several organs and 43
systems through generation of reactive oxygen species, which can function as 44
signaling molecules to activate a number of cellular stress-sensitive pathways linked 45
to insulin resistance and decreased insulin secretion (Izquierdo-Vega et al., 2006). 46
T2D accounts for 90-95% of all cases of diabetes and is a major public health 47
problem (Wild et al., 2004). The prevalence of T2D has been increasing 48
substantially worldwide, including in Taiwan (Wang et al., 2005). Conventional risk 49
factors have been identified, but they have not yet been sufficiently explained (Wang 50
et al., 1997). Metabolic syndrome (MetS) has been demonstrated as a strong 51
predictor for T2D incidence in middle-aged individuals (Wannamethee et al., 2005). 52
Established risks factors for T2D include older age, obesity, physical inactivity, 53
family history, and genetic polymorphisms (Navas-Acien et al., 2006). Moreover, As, 54
an environmental toxicant, has been suggested to play an etiologic role in the 55
development of diabetes (Tseng, 2004). Wang et al. (2007) has also reported a 56
relationship between hair arsenic levels and MetS in a cross-sectional study in 57
Taiwan. 58
The toxicity of As greatly differs among their chemical species, and methylated 59
arsenicals are considered to be less toxic than iAs. Methylation is the major 60
metabolic pathway for iAs in humans, and most of the iAs (arsenite [AsIII] and 61
arsenate [AsV]) are metabolized to monomethylarsonic acid (MMAV) and 62
dimethylarsinic acid (DMAV) before excretion in the urine. Methylation of As 63
involves a two-electron reduction of pentavalent (e.g., AsV and MMAV) to trivalent 64
(e.g., AsIII and MMAIII [monomethylarsonous acid]) As species followed by the 65
transfer of a methyl group from a methyl donor, such as S-adenosylmethionine 66
(Thompson, 1993). In the biotransformation process of As, As (+3 oxidation state) 67
methyltransferase (AS3MT) and glutathion S-transferase ω (GSTO) are required in a 68
variety of animals including humans (Aposhian and Aposhian, 2006). GST is a 69
phase II enzyme that can detoxify xenobiotics by catalyzing their conjugation with 70
reduced glutathione. GSTO1 is involved in the reduction activities of AsV, MMAV, 71
and DMAV (Agusa et al., 2010). Human AS3MT is known to catalyze the 72
methylation of arsenite (Fujihara et al., 2010). However, methylation of iAs is not 73
necessarily a detoxification process, in that methylation is paradoxically both a 74
detoxification and activation process (Thomas et al., 2007). 75
In order to evaluate the changes in disease risk, we follow a community-based 76
population with documented previous ingestion of As from artesian well water 77
(Chen et al., 1995). We aimed to assess if GSTO1 and AS3MT affected the As 78
methylation patterns and evaluated the association among As methylation patterns, 79
gene polymorphisms, and the occurrence of MetS. 80
81
2. Materials and Methods 82
2.1 Study site and subjects 83
Subjects were form a community-based cohort recruited in 1990 (Chen et al., 84
1995) consisting of 1297 men and women over 40-years-old. All subjects were from 85
Putai village, a high arsenic exposure township in southwestern Taiwan, where the 86
prevalence of black foot disease (BFD) was the highest and a median As 87
concentration in the artesian well water ranging from 700 to 930 μg/L (Kuo, 1964). 88
The soil and water from shallow wells in this area has a high salt content. The 89
residents, therefore, have used artesian well water since the 1900s. During 1972 and 90
thereafter, a tap water supply system was implemented in this BFD endemic area, 91
which almost completely supplied the entire area with municipal water. In 1997 and 92
2002-3, we successfully followed 287 subjects from the residents, and 247 subjects 93
with urinary arsenic speciation measurements and single-nucleotide polymorphism 94
determinations. 95
96
2.2 Data and specimen collections 97
Informed consent from each participant and approval by the Human Subjects 98
Review Board of National Health Research Institutes in Taiwan was obtained prior 99
to data collection. Demographic factors, artesian well water usage, personal and 100
family disease history of diabetes mellitus, dietary habits, and life style information 101
were acquired using standardized questionnaires at both baseline and follow-up. 102
Blood pressure was measured using a mercury sphygmomanometer with a suitable 103
cuff. Two measurements were carried out at least 30 min apart while subjects sat 104
calmly. If the difference between the two measurements exceeded 5% (i.e., >5 105
mmHg out of 100 mmHg), blood pressure was measured a third time. The average 106
of the two closest values was used for data analysis. The fasting blood samples were 107
stored frozen after collection and then keep in a -700C freezer until analysis. 108
109
2.3 Specimen analysis 110
We quantified four As species in urine collected at the 2002-2003 follow-up: 111
arsenite (AsIII), arsenate (AsV), monomethylarsonic acid (MMA), and 112
dimethylarsinic acid (DMA). Urinary As species were analyzed using 113
high-performance liquid chromatography (HPLC) coupled with flow injection 114
atomic absorption spectrometry. The HPLC system consisted of a solvent delivery 115
pump (PU-1580; Jasco, Tokyo, Japan) and a silica-based anion-exchange column 116
(Nucleosil 10 SB, 250 mm × 4.6 mm; Phenomenex, Torrance, CA, USA) with a 117
guard column packed with the same material. A flow injection analysis system 118
(FIAS-400; PerkinElmer, Waltham, MA, USA) was designed as the on-line interface 119
to the continuous hydride generation system (Analyst 100; PerkinElmer, Waltham, 120
MA, USA). The within-day and between-day precision (coefficient of variation, 121
CV%) for AsIII, AsV, MMA, and DMA determinations ranged from 1.0 to 3.7%. 122
The recoveries for AsIII, AsV, MMA, and DMA were 99.0, 98.9, 99.0, and 99.0%, 123
while the detection limits were 0.75, 1.47, 1.19, and 0.76 μg/L, respectively. 124
Fasting plasma was analyzed in a central laboratory of the Kaohsiung Medical 125
Center for blood glucose, cholesterol, triglycerides, low- and high-density 126
lipoproteins, urine acid, and urine creatinine using a Beckmen Synchron LX20 127
System (Beckman Coulter, Brea, CA, USA). The CV% ranged between 0.4% and 128
3.4% with a mean of 2.8% and 2.2% for day-to-day and within-run measurements, 129 respectively. 130 131 2.4 Genotype Analysis 132
Genomic DNA was extracted from buffy coat using a commercial kit (Gentra 133
Puregene; Qiagen, Hilden, Germany). The genotype of GSTO1 A140D was 134
determined using polymerase chain reaction (PCR) followed by restriction enzyme 135
digestion as described previously (Marahatta et al., 2006). For the GSTO1 A140D 136
genotype, a PCR containing 100 ng of DNA was incubated at 930C for 5 min 137
followed by 33 cycles at 930C for 60 sec, 510C for 60 seconds, and 720C for 30 138
seconds, with a final 4-min extension at 720C. The A140D polymorphism was 139
detected by Cac 8I digestion, with the result of a single 254 bp band indicating the 140
presence of the D allele, while double bands (186 and 68 bp) indicating the A allele. 141
For the GSTO2 N142D genotype, PCR conditions included an initial step at 950C for 142
5 min followed by 35 cycles of 930C for 60 sec, 620C for 60 sec, and 720C for 30 sec, 143
with a final 4-min extension at 720C. A fragment of 185 bp was amplified and 144
analyzed using Mbo I. The presence of the variant D allele resulted in digested 145
bands of 122 and 63 bp. All PCR products were analyzed using 3.5% NuSieve 146
(Cambrex, Charles City, IA, USA) agarose gel electrophoresis. Primers for GSTO1 147
A140D were 5’-GAACTTGATGCACCCTTGGT-3’ (forward) and 148
5’-TGATAGCTAGGAGAAATAATTAC-3’ (reverse). Primers for GSTO2 N142D 149
were 5’-AGGCAGAACAGGAACTGGAA-3’ (forward) and 150
5’-GAGGGACCCCTTTTTGTACC-3’ (reverse). 151
The AS3MT M287T genotype was determined using a commercial TaqMan 152
SNP Genotyping Assay (Assay ID C_31979150_10; Applied Biosystems, Foster 153
City, CA, USA). Reactions were conducted following the instructions of the 154
manufacturer. 155
2.5 Data analysis 157
Adult Treatment Panel III (2001) (Alberti et al., 2006; Saely et al., 2006) 158
criteria were adopted to define MetS: fasting plasma glucose (≥ 110 mg/dL), 159
triglycerides (≥ 150 mg/dL), high density lipoprotein (≤ 40 mg/dL for men and ≤ 50 160
mg/dL for women), increased systolic (≥ 130 mmHg) or diastolic (≥ 85 mmHg) 161
blood pressure, and waist girth (≥ 90 cm for men and ≥ 80 cm for women). MetS 162
was defined as the presence of three or more of the risk factors mentioned above. We 163
also calculated insulin sensitivity (Si), which was the inverse of the homeostasis 164
model assessment index, defined as 22.5EXP[-ln(glucose)]/insulin (Cohen et al., 165
2006). 166
The total urine As (TotAs) in the present study was defined as the sum of AsIII, 167
AsV, MMA, and DMA. The cumulative arsenic exposure (CAE) (mg/L-y) was 168
defined as the sum of the products, derived by multiplying the As concentration in 169
the well water by the duration of water consumption during consecutive periods of 170
living at different villages (Chen et al., 1995). Primary methylation index (PMI) and 171
secondary methylation index (SMI) were defined as MMA divided by (AsIII+ AsV) 172
and as DMA divided by MMA, respectively. Because of the distribution of As was 173
skewed to the right, As concentrations were log-transformed and calculate as 174
geometric means (GM). We examined the differences between (Student’s t-test) and 175
among the groups (analysis of variance, ANOVA) using GM. A chi-square test was 176
performed for categorical variables. The univariate and multivariate logistic 177
regression analyses were used to evaluate MetS status in relation to risk factors, with 178
the multivariate model adjusted for significant risk factors identified by univariate 179
analysis. All analyses were performed using SPSS v15 (SPSS, Chicago, IL, USA). 180
181
3. Results 182
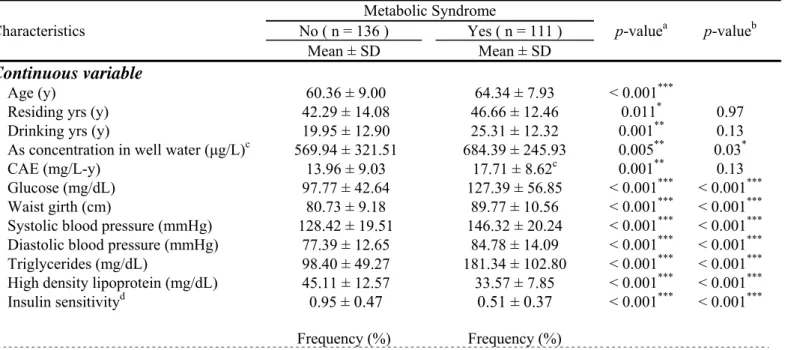
Among the 247 followed subjects, 111 were found to have MetS. Table 1 183
shows the occurrence of MetS according to demographic factors, life style, and 184
MetS-related risk factors. The mean age of the group with MetS (64.34 ± 7.93) was 185
significantly higher than that of the group without MetS (60.36 ± 9.00) (p < 0.001). 186
Insulin sensitivity showed a significant difference the groups without and with MetS 187
(0.95 ± 0.47 vs. 0.51 ± 0.37, respectively; p < 0.001). We also found that the As 188
concentration in the well water and betel nut chewing significantly correlated with 189
the risk of MetS after adjustment for age. Table 2 shows MetS according to As 190
metabolites and genotypes. MMA levels were significantly lower in the group with 191
MetS than those without MetS. Subjects without MetS tended to have a higher 192
incidence of the AA genotype, with borderline significance after adjustment for age. 193
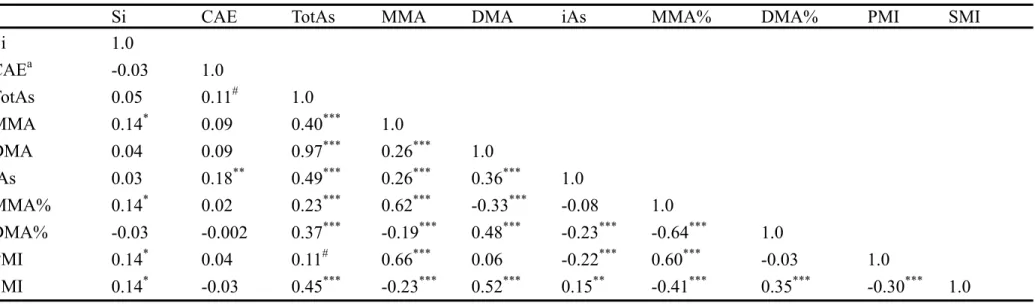
Table 3 shows the Pearson correlation coefficients for Si and As metabolites. We 194
found that Si was associated with MMA, MMA%, PMI, and SMI. TotAs showed a 195
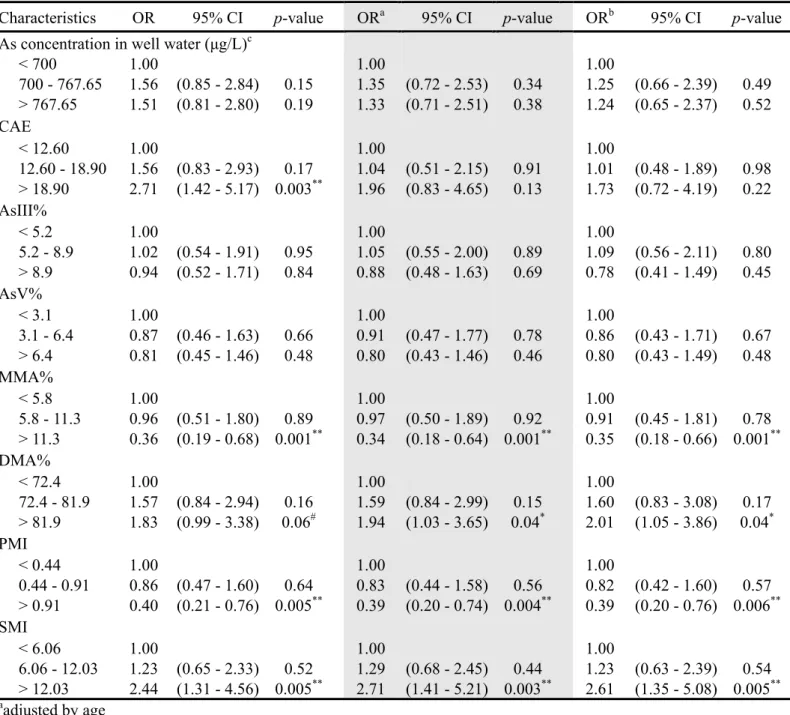
high correlation with other As metabolites, but not with CAE. Table 4 shows the 196
results of multiple logistic regression analysis for MetS in relation to tertiles of As 197
methylation patterns by three models. The upper groups of MMA% (MMA/TotAs), 198
DMA% (DMA/TotAs), PMI, and SMI showed significant differences as compared 199
to their reference groups. MMA% and PMI were negatively associated with MetS 200
(OR = 0.35, 95% CI: 0.18-0.66 and 0.39, 95% CI: 0.20-0.76 for MMA% > 0.11 and 201
PMI > 0.91 compared to MMA% < 0.06 and PMI < 0.44, respectively). DMA% and 202
SMI were also associated with increased risk of MetS (OR = 2.01, 95% CI: 203
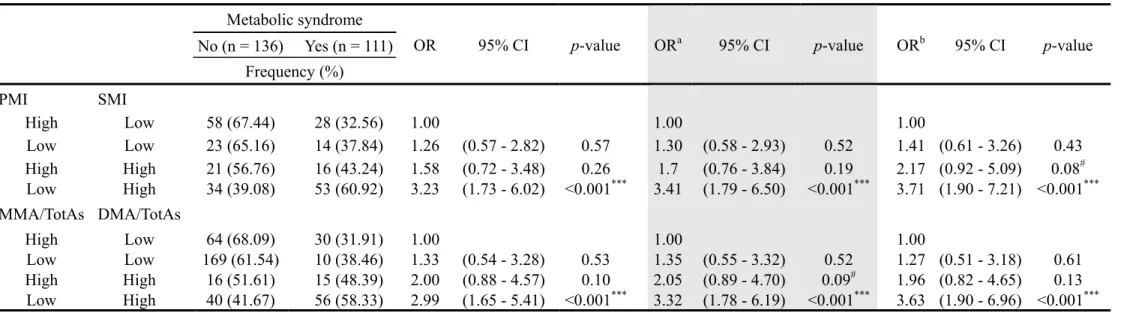
1.05-3.86 and 2.61, 95% CI: 1.35-5.08 for DMA% > 0.82 and SMI > 12.03, 204
respectively). Table 5 shows the arsenic methylation patterns linked to MetS. Three 205
models for logistic regression were performed and four As methylation patterns, 206
MMA%, DMA%, PMI, and SMI, were considered. We found the MetS OR for 207
subjects with a lower PMI and higher SMI was significantly higher (3.71, 95% CI: 208
1.90-7.21) than that for subjects with a higher PMI and lower SMI. Consistently, the 209
MetS OR for subjects with a lower MMA% and higher DMA% was significantly 210
higher (3.63, 95% CI: 1.90-6.96) than that for subjects with a higher MMA% and 211
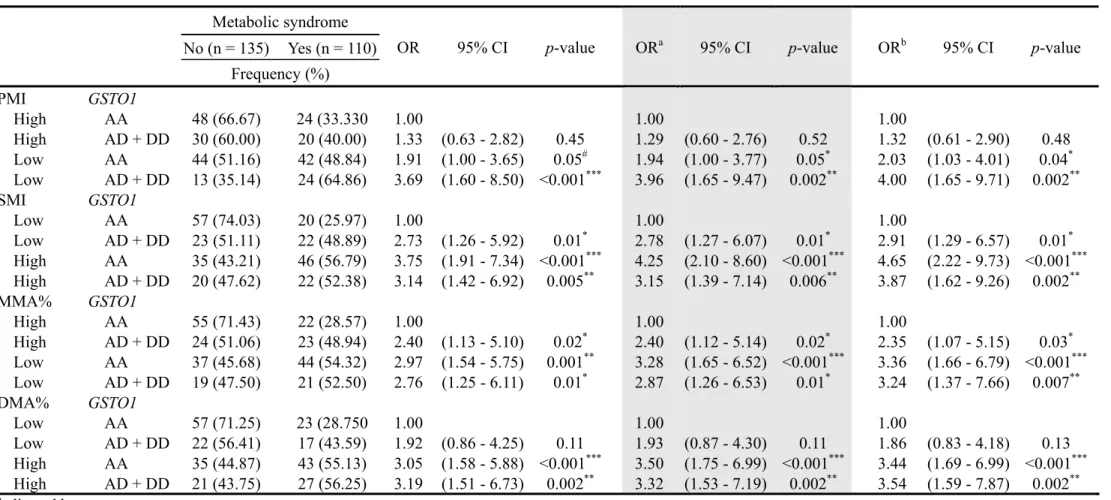
lower DMA%. Table 6 shows the arsenic methylation patterns and GSTO1 212
genotypes linked to MetS. The analysis of the four As methylation patterns and 213
GSTO1 genotypes were performed using three logistic regression models. Subjects 214
with a lower PMI, lower MMA%, and the AD+DD genotype showed a significantly 215
higher MetS risk of around 3–4 fold (ORs were 4.00 and 3.24 for lower PMI and 216
lower MMA%, respectively). Subjects with both a higher SMI and higher DMA% 217
showed a significantly higher MetS risk (ORs were 3.87 and 3.54 for higher SMI 218
and higher DMA%, respectively). 219
220
4. Discussion 221
The positive association between arsenic exposure and increased rates of 222
diabetes has been shown in Taiwan; however, its association with MetS, an 223
important risk factor and predictor for cardiovascular diseases including T2D 224
(especially for middle-age subjects), is seldom studied. A cross-sectional study in 225
Taiwan (Wang et al., 2007) indicated the increasing prevalence of MetS from the 2nd 226
tertile (0.034 μg/g) of hair arsenic levels (OR = 2.54, p = 0.015) after adjustment for 227
age, gender, occupation, and life style. To our knowledge, the present study is the 228
first to report the relation between arsenic methylation patterns and MetS, with 229
genotype and other risk covariates taken into account. 230
The excretion of methylated As metabolites in urine is the result of a number of 231
factors, though our knowledge of the importance of these factors is limited. 232
According to a report from the National Research Council (1999), it can be 233
concluded that the level of arsenic has little influence on methylation efficiency. The 234
rates of As metabolites in our study are close to those of a previous study (Vahter, 235
2000), which indicated that most individuals have an average of 10–30% iAs, 236
10–20% MMA, and 60–70% DMA (for this study, 17%, 10%, and 73% for iAs, 237
MMA, and DMA, respectively). In one study, a 500-μg/L increase in the 238
concentration of As metabolites in urine corresponded to a 2% increase in urine 239
MMA and a 3% decrease in DMA (Hopenhayn-Rich et al., 1996). We found an 240
association between AS3MT and MMA that was similar to the results of a recent 241
study (Ahusa et al., 2010). MMA%, PMI, and SMI are affected by AS3MT (MM vs. 242
MT genotype: 0.10 vs. 0.22, 0.82 vs. 1.75, and 18.25 vs. 3.45, respectively; data not 243
shown). Some studies have shown that MMA is more cytotoxic (Petrick et al., 2000) 244
and genotoxic (Mass et al., 2001) than AsIII and AsV, suggesting that the oxidation 245
state of methylated arsenicals is important for the manifestation of their toxic and/or 246
genotoxic effects. A recent study (Chung et al., 2009) showed that MMM% might be 247
a potential predictor of cancer risk and that changes in MMA% are linked to 248
individual cancer susceptibility related to AS3MT. In the present study, however, we 249
found that Si increased with increasing MMA, MMA%, PMI, and SMI. We also 250
found that lower PMI and MMA% and higher SMI and DMA% seemed to be risk 251
factors for MetS. When looking at the As methylation pattern and the genotypes of 252
GSTO1 (Table 5), As methylation patterns seems to be dominate factors of MetS 253
risk, as apposed to GSTO1. Up to now, a clear cut-off level for As exposure or 254
As-induced health effects has not been established. The biological exposure index of 255
35 μg/g creatinine is based on an estimated risk for lung cancer. The thresholds of 256
different As metabolites for developing MetS are not clear and await further 257
investigation. 258
Several factors can influence the toxicity of As towards organs involved in 259
glucose metabolism and can determine the progression of insulin resistance, such as 260
personal susceptibility with respect to genetics, nutritional uptake, health status, 261
detoxification capability, interactions with other trace elements, and the other 262
well-recognized risk factors for diabetes mellitus. Although drinking water is the 263
main source of As uptake, up to 44% of ingested As may come from food sources 264
(Del Razo et al., 2002). Another study has indicated that diet is the largest exposure 265
source for most individuals, with an average intake of about 50 μg/d from food 266
(Tchounwou et al., 2003). Other uptake routes are usually much smaller, but may 267
become significant in areas of As contamination. For accumulative As, we measured 268
individual As exposure and then multiplied the number of years lived in a specific 269
area times the average As level in the well water. The measurement, however, was 270
based on one measurement for the period and assumed constant water As 271
concentrations throughout the period. Das et al. (1989) proposed that selenium (Se) 272
and As counteract each other in regards to glucose metabolism and that the joint 273
effect of high As and low Se could play a role in developing T2D. The variation of 274
exposure to Se, consumption of As via food, and other nutrients were not considered 275
in this study. 276
Induction of oxidative stress and interference of signal transduction or gene 277
expression by As or by its methylated metabolites are the most possible causes to 278
As-induced T2D through mechanisms of induced insulin resistance (Tseng, 2004). 279
In subjects with chronic As exposure, oxidative stress is increased. The expression 280
levels of tumor necrosis factor α (TNFα) and interleukin-6 (IL-6), both cytokines, 281
are well known for their effect on the induction of insulin resistance. Fu et al. (2010) 282
indicated that low levels of As provoke a cellular adaptive oxidative stress response 283
that increases antioxidant levels, dampens reactive oxygen species signaling 284
involved in glucose-stimulated insulin secretion, and thus disturbs β-cell function. It 285
was reported that the methylation of As in individuals via drinking water (in Taiwan) 286
is associated with genetic polymorphism in GST (Chiou et al., 1997). Between 287
individuals, there are a lot of differences in As biomethylation. As such, it is likely 288
that there are genetic polymorphisms affecting the regulation of As 289
methyltransferases. It is possible that As metabolism is also affected by the 290
documented polymorphism in enzymes involved in the remethylation of 291
homocysteine. 292
Current available evidence (including in vitro, in vivo, and animal studies) are 293
inadequate to establish the cause-effect relationship between As and MetS. Due to 294
the short biological half-life of arsenic, hair or nails may be a more valid source for 295
estimating individual As exposure. Further studies should focus on the measurement 296
of appropriate samples (e.g., hair) that more accurately represent long-term As 297 exposure. 298 299 5. Conclusions 300
We found that the group of subjects with MetS had a higher As concentration in 301
their well water. AS3MT polymorphisms were associated with MMA%, PMI, and 302
SMI. Multiple logistic regression analysis showed that the OR of MetS significantly 303
decreased with increasing MMA% and decreasing DMA%. We found that subjects 304
with lower PMI and higher SMI levels had a significantly increased OR of MetS. 305
The high OR (4.65, 95% CI: 2.22-9.73, p<0.001) was found in the higher SMI group 306
with the AA genotype compared to the reference group with lower SMI and the AA 307
genotype. Our findings suggested that decreasing MMA% and PMI as well 308
increasing DMA% and SMI are associated with an increased risk of MetS and that 309
this risk might be marginally modified by the GSTO1 genotype among As-exposed 310 subjects. 311 312 Acknowledgements 313
The authors thank Ms. HY Chen for support with sample collection and 314
management. The statistical assistance from Mr. KH Chang is also acknowledged. 315
This study was supported by grant EO-094-PP-11 and EO-095-PP-07 from the 316
National Health Research Institutes (NHRI), Taiwan. 317
REFERENCES 319
Agusa, T., Iwata, H., Fujihara, J., Kunito, T., Takeshita, H., Minh, T.B., Trang, P.T., 320
Viet, P.H., Tanabe, S., 2010. Genetic polymorphisms in glutathione S-transferase 321
(GST) superfamily and arsenic metabolism in residents of the Red River Delta, 322
Vietnam. Toxicol Appl Pharmacol 242, 352-362. 323
Alberti, K.G., Zimmet, P., Shaw, J., 2006. Metabolic syndrome--a new world-wide 324
definition. A Consensus Statement from the International Diabetes Federation. 325
Diabet Med 23, 469-480. 326
Aposhian, H.V., Aposhian, M.M., 2006. Arsenic toxicology: five questions. Chem 327
Res Toxicol 19, 1-15. 328
Chen, C.J., Hsueh, Y.M., Lai, M.S., Shyu, M.P., Chen, S.Y., Wu, M.M., Kuo, T.L., 329
Tai, T.Y., 1995. Increased prevalence of hypertension and long-term arsenic 330
exposure. Hypertension 25, 53-60. 331
Chiou, H.Y., Hsueh, Y.M., Hsieh, L.L., Hsu, L.I., Hsu, Y.H., Hsieh, F.I., Wei, M.L., 332
Chen, H.C., Yang, H.T., Leu, L.C., Chu, T.H., Chen-Wu, C., Yang, M.H., Chen, 333
C.J., 1997. Arsenic methylation capacity, body retention, and null genotypes of 334
glutathione S-transferase M1 and T1 among current arsenic-exposed residents in 335
Taiwan. Mutat Res 386, 197-207. 336
Chiu, H.F., Chang, C.C., Tsai, S.S., Yang, C.Y., 2006. Does arsenic exposure 337
increase the risk for diabetes mellitus? J Occup Environ Med 48, 63-67. 338
Chung, C.J., Hsueh, Y.M., Bai, C.H., Huang, Y.K., Huang, Y.L., Yang, M.H., Chen, 339
C.J., 2009. Polymorphisms in arsenic metabolism genes, urinary arsenic 340
methylation profile and cancer. Cancer Causes Control 20, 1653-1661. 341
Cohen, D., Stolk, R.P., Grobbee, D.E., Gispen-de Wied, C.C., 2006. Hyperglycemia 342
and diabetes in patients with schizophrenia or schizoaffective disorders. Diabetes 343
Care 29, 786-791. 344
Coronado-Gonzalez, J.A., Del Razo, L.M., Garcia-Vargas, G., Sanmiguel-Salazar, F., 345
Escobedo-de la Pena, J., 2007. Inorganic arsenic exposure and type 2 diabetes 346
mellitus in Mexico. Environ Res 104, 383-389. 347
Das, P.M., Sadana, J.R., Gupta, P.K., Kumar, K., 1989. Experimental selenium 348
toxicity in guinea pigs: biochemical studies. Ann Nutr Metab 33, 57-63. 349
Del Razo, L.M., Garcia-Vargas, G.G., Garcia-Salcedo, J., Sanmiguel, M.F., Rivera, 350
M., Hernandez, M.C., Cebrian, M.E., 2002. Arsenic levels in cooked food and 351
assessment of adult dietary intake of arsenic in the Region Lagunera, Mexico. 352
Food Chem Toxicol 40, 1423-1431. 353
Fu, J., Woods, C.G., Yehuda-Shnaidman, E., Zhang, Q., Wong, V., Collins, S., Sun, 354
G., Andersen, M.E., Pi, J., 2010. Low-level arsenic impairs glucose-stimulated 355
insulin secretion in pancreatic beta cells: involvement of cellular adaptive 356
response to oxidative stress. Environ Health Perspect 118, 864-870. 357
Fujihara, J., Soejima, M., Yasuda, T., Koda, Y., Agusa, T., Kunito, T., Tongu, M., 358
Yamada, T., Takeshita, H., 2010. Global analysis of genetic variation in human 359
arsenic (+3 oxidation state) methyltransferase (AS3MT). Toxicol Appl 360
Pharmacol 243, 292-299. 361
Guha Mazumder, D.N., 2008. Chronic arsenic toxicity & human health. Indian J 362
Med Res 128, 436-447. 363
Hopenhayn-Rich, C., Biggs, M.L., Smith, A.H., Kalman, D.A., Moore, L.E., 1996. 364
Methylation study of a population environmentally exposed to arsenic in 365
drinking water. Environ Health Perspect 104, 620-628. 366
Izquierdo-Vega, J.A., Soto, C.A., Sanchez-Pena, L.C., De Vizcaya-Ruiz, A., Del 367
Razo, L.M., 2006. Diabetogenic effects and pancreatic oxidative damage in rats 368
subchronically exposed to arsenite. Toxicol Lett 160, 135-142. 369
Kuo, T.L., 1964. Arsenic content of artesian well water in endemic area of chronic 370
arsenic poisoning, in Reports of insulin of pathology. National Taiwan 371
University College of Medicine, Taipei, Taiwan 7-13. 372
Marahatta, S.B., Punyarit, P., Bhudisawasdi, V., Paupairoj, A., Wongkham, S., 373
Petmitr, S., 2006. Polymorphism of glutathione S-transferase omega gene and 374
risk of cancer. Cancer Lett 236, 276-281. 375
Mass, M.J., Tennant, A., Roop, B.C., Cullen, W.R., Styblo, M., Thomas, D.J., 376
Kligerman, A.D., 2001. Methylated trivalent arsenic species are genotoxic. 377
Chem Res Toxicol 14, 355-361. 378
Nabi, A.H., Rahman, M.M., Islam, L.N., 2005. Evaluation of biochemical changes 379
in chronic arsenic poisoning among Bangladeshi patients. Int J Environ Res 380
Public Health 2, 385-393. 381
National Research Council, 1999. Risk assessment of arsenic in drinking water. 382
Subcommittee on arsenic in drinking water. National Academy Press, 383
Washington DC, pp. 263. 384
Navas-Acien, A., Silbergeld, E.K., Pastor-Barriuso, R., Guallar, E., 2008. Arsenic 385
exposure and prevalence of type 2 diabetes in US adults. JAMA 300, 814-822. 386
Navas-Acien, A., Silbergeld, E.K., Streeter, R.A., Clark, J.M., Burke, T.A., Guallar, 387
E., 2006. Arsenic exposure and type 2 diabetes: a systematic review of the 388
experimental and epidemiological evidence. Environ Health Perspect 114, 389
641-648. 390
Nordstrom, D.K., 2002. Worldwide occurrences of arsenic in ground water. Science 391
296, 2143-2145. 392
Petrick, J.S., Ayala-Fierro, F., Cullen, W.R., Carter, D.E., Vasken Aposhian, H., 2000. 393
Monomethylarsonous acid (MMA(III)) is more toxic than arsenite in Chang 394
human hepatocytes. Toxicol Appl Pharmacol 163, 203-207. 395
Saely, C.H., Koch, L., Schmid, F., Marte, T., Aczel, S., Langer, P., Hoefle, G., Drexel, 396
H., 2006. Adult Treatment Panel III 2001 but not International Diabetes 397
Federation 2005 criteria of the metabolic syndrome predict clinical 398
cardiovascular events in subjects who underwent coronary angiography. 399
Diabetes Care 29, 901-907. 400
Smith, A.H., Lopipero, P.A., Bates, M.N., Steinmaus, C.M., 2002. Arsenic 401
epidemiology and drinking water standards. Science 296, 2145-2146. 402
Suk, W.A., Ruchirawat, K.M., Balakrishnan, K., Berger, M., Carpenter, D., Damstra, 403
T., de Garbino, J.P., Koh, D., Landrigan, P.J., Makalinao, I., Sly, P.D., Xu, Y., 404
Zheng, B.S., 2003. Environmental threats to children's health in Southeast Asia 405
and the Western Pacific. Environ Health Perspect 111, 1340-1347. 406
Tchounwou, P.B., Patlolla, A.K., Centeno, J.A., 2003. Carcinogenic and systemic 407
health effects associated with arsenic exposure--a critical review. Toxicol Pathol 408
31, 575-588. 409
Thomas, D.J., Li, J., Waters, S.B., Xing, W., Adair, B.M., Drobna, Z., Devesa, V., 410
Styblo, M., 2007. Arsenic (+3 oxidation state) methyltransferase and the 411
methylation of arsenicals. Exp Biol Med (Maywood) 232, 3-13. 412
Thompson, D.J., 1993. A chemical hypothesis for arsenic methylation in mammals. 413
Chem Biol Interact 88, 89-14. 414
Tseng, C.H., 2004. The potential biological mechanisms of arsenic-induced diabetes 415
mellitus. Toxicol Appl Pharmacol 197, 67-83. 416
Vahter, M., 2000. Genetic polymorphism in the biotransformation of inorganic 417
arsenic and its role in toxicity. Toxicol Lett 112-113, 209-217. 418
Wang, S.L., Chang, F.H., Liou, S.H., Wang, H.J., Li, W.F., Hsieh, D.P., 2007. 419
Inorganic arsenic exposure and its relation to metabolic syndrome in an 420
industrial area of Taiwan. Environ Int 33, 805-811. 421
Wang, S.L., Chiou, J.M., Chen, C.J., Tseng, C.H., Chou, W.L., Wang, C.C., Wu, T.N., 422
Chang, L.W., 2003. Prevalence of non-insulin-dependent diabetes mellitus and 423
related vascular diseases in southwestern arseniasis-endemic and nonendemic 424
areas in Taiwan. Environ Health Perspect 111, 155-159. 425
Wang, S.L., Pan, W.H., Hwu, C.M., Ho, L.T., Lo, C.H., Lin, S.L., Jong, Y.S., 1997. 426
Incidence of NIDDM and the effects of gender, obesity and hyperinsulinaemia in 427
Taiwan. Diabetologia 40, 1431-1438. 428
Wannamethee, S.G., Shaper, A.G., Lennon, L., Morris, R.W., 2005. Metabolic 429
syndrome vs Framingham Risk Score for prediction of coronary heart disease, 430
stroke, and type 2 diabetes mellitus. Arch Intern Med 165, 2644-2650. 431
Wen, C.P., Cheng, T.Y., Tsai, S.P., Hsu, H.L., Wang, S.L., 2005. Increased mortality 432
risks of pre-diabetes (impaired fasting glucose) in Taiwan. Diabetes Care 28, 433
2756-2761. 434
Wild, S., Roglic, G., Green, A., Sicree, R., King, H., 2004. Global prevalence of 435
diabetes: estimates for the year 2000 and projections for 2030. Diabetes Care 27, 436
1047-1053. 437
Table 1. Occurrence of metabolic syndrome according to demographic factors, life style, and metabolic syndrome parameters (n = 247)
Characteristics Metabolic Syndrome p-valuea p-valueb No ( n = 136 ) Yes ( n = 111 ) Mean ± SD Mean ± SD Continuous variable Age (y) 60.36 ± 9.00 64.34 ± 7.93 < 0.001***
Residing yrs (y) 42.29 ± 14.08 46.66 ± 12.46 0.011* 0.97
Drinking yrs (y) 19.95 ± 12.90 25.31 ± 12.32 0.001** 0.13
As concentration in well water (μg/L)c 569.94 ± 321.51 684.39 ± 245.93 0.005** 0.03*
CAE (mg/L-y) 13.96 ± 9.03 17.71 ± 8.62c 0.001** 0.13
Glucose (mg/dL) 97.77 ± 42.64 127.39 ± 56.85 < 0.001*** < 0.001*** Waist girth (cm) 80.73 ± 9.18 89.77 ± 10.56 < 0.001*** < 0.001*** Systolic blood pressure (mmHg) 128.42 ± 19.51 146.32 ± 20.24 < 0.001*** < 0.001*** Diastolic blood pressure (mmHg) 77.39 ± 12.65 84.78 ± 14.09 < 0.001*** < 0.001*** Triglycerides (mg/dL) 98.40 ± 49.27 181.34 ± 102.80 < 0.001*** < 0.001*** High density lipoprotein (mg/dL) 45.11 ± 12.57 33.57 ± 7.85 < 0.001*** < 0.001*** Insulin sensitivityd 0.95 ± 0.47 0.51 ± 0.37 < 0.001*** < 0.001*** Frequency (%) Frequency (%) Categorical variable Gender Female 79 (58.09) 62 (55.86) 0.72 0.81 Male 57 (41.91) 49 (44.14) Alcohol drinking No 126 (92.65) 98 (89.09) 0.33 0.27 Yes 10 (7.35) 12 (10.91)
Betel nut chewing
No 126 (95.45) 98 (89.91) 0.09 0.045*
Yes 6 (4.55) 11 (10.09)
Smoking
No 105 (80.15) 78 (72.90) 0.19 0.28
Yes (including ever) 26 (19.85) 29 (27.10)
Secondary Smoking No 92 (71.32) 81 (75.00) 0.52 0.69 Yes 37 (28.68) 27 (25.00) Education No 36 (26.47) 40 (36.04) 0.11 0.46 Primary 71 (52.21) 57 (51.35)
High school or higher 29 (21.32) 14 (12.61) Exercise
No 75 (55.15) 59 (53.15) 0.75 0.47
Yes 61 (44.85) 52 (46.85)
aStudent’s T test for continuous variables, chi-square test for categorical variables bage-adjusted
c102 subjects had records available
dinsulin sensitivity, which was the inverse of the homeostasis model assessment index, was defined as
22.5EXP[-ln(glucose)]/insulin
Table 2. Metabolic syndrome according to arsenic patterns and genotypes (n = 247) Characteristics Metabolic Syndrome p-valueb p-valuec No ( n = 136 ) Yes ( n = 111 ) Mean ± SD Mean ± (SD) Arsenic metabolitesa iAs% 17.2 ± 14.4 16.8 ± 16.2 0.84 0.98 oAs% 82.6 ± 14.1 83.4 ± 15.8 0.84 0.98 AsIII% 10.1 ± 11.6 10.4 ± 13.1 0.73 0.98 AsV% 7.3 ± 7.3 6.9 ± 6.5 0.85 0.99 MMA% 10.6 ± 9.2 9.4 ± 8.8 0.08# 0.06# DMA% 72.3 ± 18.4 73.5 ± 20.0 0.49 0.37 PMI 0.92 ± 0.75 0.75 ± 0.71 0.08# 0.06# SMI 16.12 ± 31.21 19.98 ± 32.71 0.35 0.42 AsIII (μg/g creatinine) 3.79 ± 4.60 4.12 ± 6.15 0.64 0.79 AsV (μg/g creatinine) 1.78 ± 1.93 1.47 ± 1.14 0.11 0.29 iAs (μg/g creatinine) 5.57 ± 4.84 5.58 ± 6.08 0.98 0.97 MMA (μg/g creatinine) 4.51 ± 5.92 3.08 ± 2.95 0.02* 0.03* DMA (μg/g creatinine) 32.79 ± 28.94 35.52 ± 36.98 0.53 0.42 oAs (μg/g creatinine) 37.30 ± 30.92 38.60 ± 38.26 0.77 0.63 TotAs (μg/g creatinine) 42.87 ± 33.06 44.19 ± 40.94 0.78 0.66 Frequency (%) Frequency (%) Genotypes GST01 A140D AA 92 (68.15) 66 (60.00) 0.08 0.06 AD 37 (27.41) 31 (28.18) DD 6 (4.44) 13 (11.82) GST02 N142D NN 68 (50.75) 53 (47.75) 0.84 0.61 ND 53 (39.55) 48 (43.24) DD 13 (9.70) 10 (9.01) AS3MT M287T MM 130 (97.74) 109 (99.09) 0.63d 0.29 MT 3 (2.26) 1 (0.91)
aiAs: inorganic arsenic, AsIII+AsV; oAs: organic arsenic, MMA+DMA; TotAs: total arsenic, iAs+oAs; PMI:
MMA/(AsIII+AsV); SMI: DMA/MMA; (As metabolites)%: (As metabolites)/TotAs
bStudent’s T test for continuous variables, chi-square test for categorical variables cage-adjusted
dFisher's Exact Test #p<0.1, *p<0.05
Table 3. Pearson correlation coefficients for insulin sensitivity and arsenic metabolites (n = 247)
Si CAE TotAs MMA DMA iAs MMA% DMA% PMI SMI
Si 1.0 CAEa -0.03 1.0 TotAs 0.05 0.11# 1.0 MMA 0.14* 0.09 0.40*** 1.0 DMA 0.04 0.09 0.97*** 0.26*** 1.0 iAs 0.03 0.18** 0.49*** 0.26*** 0.36*** 1.0 MMA% 0.14* 0.02 0.23*** 0.62*** -0.33*** -0.08 1.0 DMA% -0.03 -0.002 0.37*** -0.19*** 0.48*** -0.23*** -0.64*** 1.0 PMI 0.14* 0.04 0.11# 0.66*** 0.06 -0.22*** 0.60*** -0.03 1.0 SMI 0.14* -0.03 0.45*** -0.23*** 0.52*** 0.15** -0.41*** 0.35*** -0.30*** 1.0 an = 238 #p<0.1, *p<0.05, **p<0.01, ***p<0.001
Table 4. Multiple logistic regression analysis for metabolic syndrome in relation to tertiles of previously exposed arsenic methylation patterns (n = 247)
Characteristics OR 95% CI p-value ORa 95% CI p-value ORb 95% CI p-value
As concentration in well water (μg/L)c
< 700 1.00 1.00 1.00 700 - 767.65 1.56 (0.85 - 2.84) 0.15 1.35 (0.72 - 2.53) 0.34 1.25 (0.66 - 2.39) 0.49 > 767.65 1.51 (0.81 - 2.80) 0.19 1.33 (0.71 - 2.51) 0.38 1.24 (0.65 - 2.37) 0.52 CAE < 12.60 1.00 1.00 1.00 12.60 - 18.90 1.56 (0.83 - 2.93) 0.17 1.04 (0.51 - 2.15) 0.91 1.01 (0.48 - 1.89) 0.98 > 18.90 2.71 (1.42 - 5.17) 0.003** 1.96 (0.83 - 4.65) 0.13 1.73 (0.72 - 4.19) 0.22 AsIII% < 5.2 1.00 1.00 1.00 5.2 - 8.9 1.02 (0.54 - 1.91) 0.95 1.05 (0.55 - 2.00) 0.89 1.09 (0.56 - 2.11) 0.80 > 8.9 0.94 (0.52 - 1.71) 0.84 0.88 (0.48 - 1.63) 0.69 0.78 (0.41 - 1.49) 0.45 AsV% < 3.1 1.00 1.00 1.00 3.1 - 6.4 0.87 (0.46 - 1.63) 0.66 0.91 (0.47 - 1.77) 0.78 0.86 (0.43 - 1.71) 0.67 > 6.4 0.81 (0.45 - 1.46) 0.48 0.80 (0.43 - 1.46) 0.46 0.80 (0.43 - 1.49) 0.48 MMA% < 5.8 1.00 1.00 1.00 5.8 - 11.3 0.96 (0.51 - 1.80) 0.89 0.97 (0.50 - 1.89) 0.92 0.91 (0.45 - 1.81) 0.78 > 11.3 0.36 (0.19 - 0.68) 0.001** 0.34 (0.18 - 0.64) 0.001** 0.35 (0.18 - 0.66) 0.001** DMA% < 72.4 1.00 1.00 1.00 72.4 - 81.9 1.57 (0.84 - 2.94) 0.16 1.59 (0.84 - 2.99) 0.15 1.60 (0.83 - 3.08) 0.17 > 81.9 1.83 (0.99 - 3.38) 0.06# 1.94 (1.03 - 3.65) 0.04* 2.01 (1.05 - 3.86) 0.04* PMI < 0.44 1.00 1.00 1.00 0.44 - 0.91 0.86 (0.47 - 1.60) 0.64 0.83 (0.44 - 1.58) 0.56 0.82 (0.42 - 1.60) 0.57 > 0.91 0.40 (0.21 - 0.76) 0.005** 0.39 (0.20 - 0.74) 0.004** 0.39 (0.20 - 0.76) 0.006** SMI < 6.06 1.00 1.00 1.00 6.06 - 12.03 1.23 (0.65 - 2.33) 0.52 1.29 (0.68 - 2.45) 0.44 1.23 (0.63 - 2.39) 0.54 > 12.03 2.44 (1.31 - 4.56) 0.005** 2.71 (1.41 - 5.21) 0.003** 2.61 (1.35 - 5.08) 0.005** aadjusted by age
badjusted by age and betel nut chewing cn = 238
Table 5. Arsenic methylation patterns and metabolic syndrome (n = 247)
Metabolic syndrome
OR 95% CI p-value ORa 95% CI p-value ORb 95% CI p-value
No (n = 136) Yes (n = 111) Frequency (%) PMI SMI High Low 58 (67.44) 28 (32.56) 1.00 1.00 1.00 Low Low 23 (65.16) 14 (37.84) 1.26 (0.57 - 2.82) 0.57 1.30 (0.58 - 2.93) 0.52 1.41 (0.61 - 3.26) 0.43 High High 21 (56.76) 16 (43.24) 1.58 (0.72 - 3.48) 0.26 1.7 (0.76 - 3.84) 0.19 2.17 (0.92 - 5.09) 0.08# Low High 34 (39.08) 53 (60.92) 3.23 (1.73 - 6.02) <0.001*** 3.41 (1.79 - 6.50) <0.001*** 3.71 (1.90 - 7.21) <0.001*** MMA/TotAs DMA/TotAs High Low 64 (68.09) 30 (31.91) 1.00 1.00 1.00 Low Low 169 (61.54) 10 (38.46) 1.33 (0.54 - 3.28) 0.53 1.35 (0.55 - 3.32) 0.52 1.27 (0.51 - 3.18) 0.61 High High 16 (51.61) 15 (48.39) 2.00 (0.88 - 4.57) 0.10 2.05 (0.89 - 4.70) 0.09# 1.96 (0.82 - 4.65) 0.13 Low High 40 (41.67) 56 (58.33) 2.99 (1.65 - 5.41) <0.001*** 3.32 (1.78 - 6.19) <0.001*** 3.63 (1.90 - 6.96) <0.001*** aadjusted by age
badjusted by age and betel nut chewing
Table 6. Arsenic methylation patterns and GSTO1 genotypes linked to metabolic syndrome (n = 247)
Metabolic syndrome
OR 95% CI p-value ORa 95% CI p-value ORb 95% CI p-value
No (n = 135) Yes (n = 110) Frequency (%) PMI GSTO1 High AA 48 (66.67) 24 (33.330 1.00 1.00 1.00 High AD + DD 30 (60.00) 20 (40.00) 1.33 (0.63 - 2.82) 0.45 1.29 (0.60 - 2.76) 0.52 1.32 (0.61 - 2.90) 0.48 Low AA 44 (51.16) 42 (48.84) 1.91 (1.00 - 3.65) 0.05# 1.94 (1.00 - 3.77) 0.05* 2.03 (1.03 - 4.01) 0.04* Low AD + DD 13 (35.14) 24 (64.86) 3.69 (1.60 - 8.50) <0.001*** 3.96 (1.65 - 9.47) 0.002** 4.00 (1.65 - 9.71) 0.002** SMI GSTO1 Low AA 57 (74.03) 20 (25.97) 1.00 1.00 1.00 Low AD + DD 23 (51.11) 22 (48.89) 2.73 (1.26 - 5.92) 0.01* 2.78 (1.27 - 6.07) 0.01* 2.91 (1.29 - 6.57) 0.01* High AA 35 (43.21) 46 (56.79) 3.75 (1.91 - 7.34) <0.001*** 4.25 (2.10 - 8.60) <0.001*** 4.65 (2.22 - 9.73) <0.001*** High AD + DD 20 (47.62) 22 (52.38) 3.14 (1.42 - 6.92) 0.005** 3.15 (1.39 - 7.14) 0.006** 3.87 (1.62 - 9.26) 0.002** MMA% GSTO1 High AA 55 (71.43) 22 (28.57) 1.00 1.00 1.00 High AD + DD 24 (51.06) 23 (48.94) 2.40 (1.13 - 5.10) 0.02* 2.40 (1.12 - 5.14) 0.02* 2.35 (1.07 - 5.15) 0.03* Low AA 37 (45.68) 44 (54.32) 2.97 (1.54 - 5.75) 0.001** 3.28 (1.65 - 6.52) <0.001*** 3.36 (1.66 - 6.79) <0.001*** Low AD + DD 19 (47.50) 21 (52.50) 2.76 (1.25 - 6.11) 0.01* 2.87 (1.26 - 6.53) 0.01* 3.24 (1.37 - 7.66) 0.007** DMA% GSTO1 Low AA 57 (71.25) 23 (28.750 1.00 1.00 1.00 Low AD + DD 22 (56.41) 17 (43.59) 1.92 (0.86 - 4.25) 0.11 1.93 (0.87 - 4.30) 0.11 1.86 (0.83 - 4.18) 0.13 High AA 35 (44.87) 43 (55.13) 3.05 (1.58 - 5.88) <0.001*** 3.50 (1.75 - 6.99) <0.001*** 3.44 (1.69 - 6.99) <0.001*** High AD + DD 21 (43.75) 27 (56.25) 3.19 (1.51 - 6.73) 0.002** 3.32 (1.53 - 7.19) 0.002** 3.54 (1.59 - 7.87) 0.002** aadjusted by age
badjusted by age and betel nut chewing