中國醫藥大學機構典藏 China Medical University Repository, Taiwan:Item 310903500/32408
61
0
0
全文
(2) 致 謝 終於寫到這一頁了,在中國醫求學了 6 年,從大學時期開始一直到研究所,不但 習慣這裡的環境,也習慣這裡的人、事、物,和大家相處起來非常輕鬆沒有壓力,所 以這些日子以來我非常快樂,因此也很珍惜和大家相處的時光。 能在兩年的時間內順利完成研究所的課程,取得碩士學位,最感謝的當然是我的 指導教授李采娟老師,除了在課業上細心協助及碩士論文的費心指導外,更感激老師 對於待人處事方面的教誨與包容,看到老師對人總是笑咪咪,就算有時出錯也不會責 罵,總是一遍又一遍耐心解釋提醒,覺得能夠當老師的研究生真的很幸福。再來要感 謝林正介院長,在每次研究團隊的討論中都會提出改進方法,在我論文口試的時候也 提供寶貴的意見讓我作修正,讓我的碩士論文更完整。 老闆辦公室是研究生每天待最久的地方,感謝幸玉學姊長期忍受我趕報告時各式 各樣的怪異問題,也謝謝俊華學長幫是個電腦白癡的我解決許多問題,還有佛心來著 的美慈,我跌倒送藥,我感冒了幫我買飯,還在我心情煩悶時陪我聊天。 回憶碩士班兩年的日子裡,碩一每天在研究室熬夜趕報告的那種痛苦感覺變淡了, 但求學辛苦的過程卻讓我很開心有你們的陪伴,在學校有爆米花逼逼波波,陳昱辰的 八卦永遠是我們關切的重點,還有搞笑的邱碧君和無厘頭的蕭伊秀;回到五人溫暖家 以後,有心靈導師邱郁雯,對我的抱怨總是一針見血的吳曉瑭,照顧弱智妹妹有愛心 的蘇珉慧,還有最佳飯友蘇小花,你們永遠都是我的油井阿,研究所苦悶的 700 多 個日子都是有你們我才能熬過來。 最後要感謝生統中心所有學長姐,你們就像是我們的褓姆一樣,幫我們解決各種 疑難雜症。兩年雖然是段不算長的時光,但在這兩年中的經驗是我從來沒體驗過的, 也要感謝我的家人在這段時間給我的幫助以及鼓勵,謝謝你們,我畢業了!.
(3) Abstract Diabetes is an important worldwide public health problem. The disease has also become one of most serious health conditions in Taiwan. There were limited studies on diabetes incidence in Taiwan, none of previous studies in Taiwan have reported the incidence rate of pre-diabetes. And the performance of screening tools for identifying new cases of pre-diabetes or diabetes has not been evaluated. Therefore, there are two aims in this study. One is to estimate the incidence of pre-diabetes or type 2 diabetes in Taiwan, and the other is to evaluate the performance of American Diabetes Association Risk Tool (ADART) proposed by American Diabetes Association (ADA) and other instruments published in the literature. This study followed for 3 years a random sample of 1021 residents with normal glycemia and without diabetic medication at baseline. New cases of hyperglycemia (Fasting plasma glucose, (FPG)≥100 mg/dl or medication) and type 2 diabetes (FPG≥126 mg/dl or medication) were ascertained from health check-up and laboratory examinations. Three multivariate logistic regression models were used, considering ADART only, ADART plus lifestyle behaviors, and ADART plus lifestyle behaviors and biomarkers. We also compared the ability of ADART with the other instruments published in the literature for screening undiagnosed pre-diabetes or diabetes. The areas under curves (AUC) of ROCs were calculated to compare their relative ability. Overall, 184 new cases of pre-diabetes and diabetes were identified after a mean follow-up period of 3 years, the age- and gender- weighted cumulative incidence was 17.83 (95% CI: 15.41-20.24) per 100. The AUCs of model 1 for males and females were 0.60 (95% CI i.
(4) 0.54-0.66) and 0.72 (95% CI 0.66-0.77); of model 2 were 0.62 (95% CI 0.56-0.68) and 0.74 (95% CI 0.68-0.80); of model 3 were 0.64 (95% CI 0.58-0.71) and 0.75 (95% CI 0.69-0.80). The AUCs of model 2 and model 3 were not significantly different from that of model 1 (p = 0.317and 0.106 in males, respectively; p = 0.213 and 0.086 in females, respectively). Conclusion, this study demonstrates that ADART is a good screening instrument for predicting the 3-year incidence of hyperglycemia for woman aged forty years and over in Taiwan.. Key words: pre-diabetes, incidence, American Diabetes Association Risk Tool, area under the receiver-operating characteristic curve. ii.
(5) 中文摘要 糖尿病不論在全世界及台灣都已經是嚴重的公共衛生問題,雖然在 台灣已有關於糖尿病發生率的報導,但是幾乎沒有關於糖尿病前期的探 討,且缺乏對於糖尿病前期篩檢工具的評估,因此本研究主要的研究目 的有二,第一為估算糖尿病前期的發生率;第二為評估 2004 年美國糖尿 病協會發展的糖尿病前期篩檢工具 (ADART) 預測糖尿病前期發生,並 比較和評估 ADART 及過去其他研究所發展的篩檢工具。 1021 位沒有空腹血糖異常或糖尿病的居民追蹤 3 年後,184 位新診 斷個案發展為糖尿病前期或糖尿病,累積 3 年糖尿病前期或糖尿病的粗 發生率為 18.02% % (95% CI: 15.64-20.36),在經過調整年齡和性別,累積 3 年糖尿病前期或糖尿病的發生率為 17.83% (95% CI: 15.41-20.24)。 使用羅吉斯迴歸分別比較 ADART (模型一),ADART 加上生活型態 (模型二),及 ADART 加上生活型態和生理生化值檢驗 (模型三) 三個模 型的接收者操作特徵曲線下面積。模型一的曲線下面積男性為 0.60 (95% CI 0.54-0.66),女性為 0.72 (95% CI 0.66-0.77);模型二男性為 0.62 (95% CI 0.56-0.68),女性為 0.74 (95% CI 0.68-0.80);模型三男性為 0.64 (95% CI 0.58-0.71),女性為 0.75 (95% CI 0.69-0.80)。不管在男性還是女性三個模 型都沒有統計上的顯著差異,顯示 ADART 用在篩檢女性 40 歲以上社區 居民是否為糖尿病前期是個不錯的篩檢工具。. 關鍵字:糖尿病前期、發生率、美國糖尿病協會篩檢工具、接收者操作 特徵曲線. iii.
(6) Contents Chapter I Introduction ........................................................................................................ 1 1.1 General background information ........................................................................ 1 1.2 Research objective .............................................................................................. 4 1.3 Organization of the dissertation .......................................................................... 4 Chapter II Literature Review .............................................................................................. 5 2.1 What’s pre-diabetes? ........................................................................................... 5 2.2 American Diabetes Association Risk Tool (ADART) and other screening tool . 6 Chapter III Methods ......................................................................................................... 12 3.1 Study design ...................................................................................................... 12 3.2 Study population ............................................................................................... 12 3.3 Data collection .................................................................................................. 13 3.4 American Diabetes Association Risk Tool ........................................................ 15 3.5 Statistical analysis ............................................................................................. 16 Chapter IV Results............................................................................................................... 19 4.1 The estimation of 3-year incidence of pre-diabetes or diabetes........................ 19 4.2 Assessing the ability of ADART for predicting 3-year incidence of pre-diabetes or diabetes ......................................................................................................... 30 4.3 Comparing the ability of ADART with other screening tools in diagnosed pre-diabetes or diabetes. ................................................................................... 35 Chapter V Discussion/Conclusions ..................................................................................... 39 5.1 The estimation of 3-year incidence of pre-diabetes or diabetes........................ 39 5.2 Assessing the ability of ADART for predicting 3-year incidence of pre-diabetes or diabetes ......................................................................................................... 40 5.3 Comparing the ability of ADART with other screening tools in diagnosing with pre-diabetes or diabetes. ................................................................................... 43 5.4 Strengths and limitations ...................................................................................... 49 References ........................................................................................................................... 50. iv.
(7) LIST OF TABLES Table 1—Screening tool of diabetes in the literature reviews ............................................... 8 Table 2—Comparison of baseline characteristics between individuals who were followed up and not followed up ........................................................................................ 20 Table 3—Three-year incidence rate of pre-diabetes or diabetes according to various risk factors stratified by gender. ................................................................................. 22 Table 4—Variables associated with incident pre-diabetes or diabetes and their corresponding odds ratios in the Taichung population aged 40 and over after a 3-year follow-up period. ...................................................................................... 28 Table 5—The ability of ADART (model 1) for predicting 3-year incidence of pre-diabetes or diabetes ............................................................................................................ 30 Table 6—The ability of ADART plus lifestyle behavior (model 2) for predicting 3-year incidence of pre-diabetes or diabetes .................................................................. 31 Table 7—The ability of ADART plus lifestyle behaviors and biomarkers (model 3) for predicting 3-year incidence of pre-diabetes or diabetes ...................................... 33 Table 8—The predictive performance of American Diabetes Association Risk Tool ........ 35 Table 9—ADART and instruments published in literature in screen undiagnosed pre-diabetes or diabetes ....................................................................................... 37 Table 10—Comparing the AUCs of ADART with the other instruments published in literature screening tools...................................................................................... 45 Table 11—Comparing the sensitivity, and specificity of ADART with the other instruments published in literature screening tools ............................................. 47. v.
(8) LIST OF FIGURES Figure 1—Comparing the AUCs of model 1, model 2, and model 3 in male ..................... 34 Figure 2—Comparing the AUCs of model 1, model 2, and model 3 in female .................. 34. vi.
(9) Chapter I Introduction 1.1. General background information Diabetes is becoming an important public health problem in the world.. According to World Health Organization (WHO) report, at least 171 million people worldwide have diabetes, and this figure is likely to be more than double by 2030. In Lin’s study, they use WHO diagnostic criteria, the prevalence rates of diabetes and impaired glucose regulation (IGR) were 9.51% (male, 10.08%; female, 9.14%) and 14.40% (male, 14.48%; female, 14.35%) respectively in Fujian province, southeast China (L. Lin, et al., 2009). Newly diagnosed diabetes was found in 53.44% of the diabetes subjects (L. Lin, et al., 2009). There are several studies on diabetes incidence. In a population-based study of diabetes and risk factors in Turkey, the 5-year incidences of type 2 diabetes, impaired glucose tolerance (IGT), and impaired fasting glucose (IFG) were 2.3%, 0.4%, and 0.7% respectively (Maral, et al., 2010). In another study of population based incidence of type 2 diabetes and its associated risk factors in Iran with a median follow-up of 6 years, 237 new cases of diabetes were ascertained corresponding to an age- and sex- standardized cumulative incidence of 6.4% (95% CI: 5.6-7.2) and incidence rate of 10.6 (9.2-12.1) per 1000 person-years (Harati, et al., 2009). Type 2 diabetes mellitus has also become one of the most severe health problems in Taiwan. Since 2002, diabetes was the fourth leading cause of death. According to Taiwanese Survey on Hypertension, Hyperglycemia, and 1.
(10) Hyperlipidemia (TwSHHH) from 2002 to 2007, diabetes incidence was 7.5‰ in male and 6.8‰ in female (Bureau of Health Promotion, BHP). Diabetes incidence grows with the increasing age. Of all insured subjects in National Health Insurance in 2003, newly-diagnosed diabetes patients were 149,361 and overall diabetes incidence was 0.67%, aged 45-64 was 1.5%; and aged 65 and over was 2.5% (Bureau National Health Insurance, BNHI). Diabetes has become the most challenging disease threatening public, hence early screening and effective prevention of diabetes has become a major public health issue. If we can prevent diabetes in early stage, then we can provide actions to against disease and disability, decline the complication even the death. To increase sensitivity of the diagnosis test, the American Diabetes Association (ADA) had lowered the cutoff for IFG from 110 to 100 mg/dl ("Report of the expert committee on the diagnosis and classification of diabetes mellitus," 2003), and use of this cutoff point has increased the number of Americans thought to have “pre-diabetes” to 41 million (Phillips, et al., 2006). The increasing trend in the prevalence of pre-diabetes is markedly in Chinese. Based on the results of direct oral glucose tolerance test (OGTTs), and the age-standardized prevalence of pre-diabetes in urban areas was 15.4% in 2002, whereas the prevalence was 28.7% in urban areas and 20.2% in rural areas in 2006 (Gao, et al., 2009). Pre-diabetes prevalence increased with body mass index (BMI), in male, the prevalence were 13.0% with BMI of 18.5-24 kg/m2, 23.3% with BMI of 24-26.9 kg/m2, and 29.7% with BMI>27 kg/m2. In female, pre-diabetes prevalence were 10.0% with BMI of 18.5-24 kg/m2, 22.5% with BMI of 24-26.9 kg/m2, and 33.6% with BMI>27 kg/m2 (Hwang, et al., 2006). 2.
(11) Although there were few studies on diabetes incidence in Taiwan, none of previous studies in Taiwan reported the incidence rate of pre-diabetes. Therefore, this study aimed to estimate the incidence of pre-diabetes or type 2 diabetes in Taiwan. A simple diabetes risk factor tool that does not require any laboratory test has its importance in screening individuals at higher risk. Previous studies had evaluated the performance of screening tools based on questionnaires in identifying pre-diabetes, diabetes, or metabolic syndrome in cross-sectional screening surveys (Aekplakorn, et al., 2006; Al-Lawati, et al., 2007; Baan, et al., 1999; Balkau, et al., 2008; Bindraban, et al., 2008; Cabrera de Leon, et al., 2008; Glumer, et al., 2004; Griffin, et al., 2000; Hippisley-Cox, et al., 2009; J. W. Lin, et al., 2009; Lindstrom, et al., 2003; Mohan, et al., 2005; Ramachandran, et al., 2005; Schmidt, et al., 2005; Schulze, et al., 2007; Stern, et al., 2002; Wilson, et al., 2007). The feasibility of these tools in identifying new cases of pre-diabetes or diabetes has not been evaluated. This study aimed to evaluate the performance of pre-diabetes risk score proposed by American Diabetes Association Risk Tool (ADART) along with the other screening tools in identifying 3-year incident cases of pre-diabetes or diabetes in a prospective cohort study in Taiwan.. 3.
(12) 1.2 Research objective There are three specific objectives of the current study. And they are as follows: 1. To estimate 3-year incidence of pre-diabetes or type 2 diabetes among residents aged 40 and over in Taichung city, Taiwan. 2. To assess the ability of ADART for predicting 3-year incidence of pre-diabetes or diabetes. 3. To compare the ability of ADART with the other instruments published in literature in screening undiagnosed pre-diabetes or diabetes.. 1.3 Organization of the dissertation The remainder of the dissertation consists of 5 chapters. Chapter 2 defined pre-diabetes and reviews the instruments published in literature in screening undiagnosed pre-diabetes or diabetes in the past. Chapter 3 draws the methodology used in this study, describing the study population and statistical analysis in detail. Chapter 4 presents the age- and gender- weighted cumulative pre-diabetes incidence and effects of risk factors were estimated. In this chapter we also assess the ability of ADART for predicting 3-year incidence of pre-diabetes or diabetes and comparing the ability of ADART with other screening tools in identifying pre-diabetes or diabetes. Chapter 5 interpreted the results in the current study, compared the results of the current study with those of previously studies, and discussed the implication of the findings of the current study.. 4.
(13) Chapter II Literature Review 2.1. What’s pre-diabetes? Diabetes has become the most challenging disease threatening public,. hence early screening and effective prevention of diabetes has become a major public health issue. To prevent or delay the development of diabetes, the early screening of diabetes is very important. Pre-diabetes is the state that occurs when a person's blood glucose levels are higher than normal but not high enough for a diagnosis of diabetes. About 11 percent of people with pre-diabetes in the Diabetes Prevention Program standard or control group developed type 2 diabetes each year during the average 3 years of follow-up. Other studies show that many people with pre-diabetes develop type 2 diabetes in 10 years. (ADA website) ADA has defined fasting plasma glucose (FPG) below 100 mg/dl as normal. A person with pre-diabetes has a FPG level between 100 and 125 mg/dl. If the FPG level rises to 126 mg/dl or above, a person is defined as having diabetes. ("Report of the expert committee on the diagnosis and classification of diabetes mellitus," 2003). 5.
(14) 2.2. American Diabetes Association Risk Tool (ADART) and other screening tool According to 2004 ADA Screening for Type 2 Diabetes, ADART. included 8 items for both men and women, and they were age over 45 years, being very overweight compared to height (BMI≥25 kg/m2), family history of diabetes, race or ethnicity, low physical activity level, previously identified IFG or IGT, high blood pressure, HDL cholesterol≤35 mg/dl (0.90 mmol/l) and/or a triglyceride level≥250 mg/dl (2.82 mmol/l), and history of vascular disease. There were two additional items for women: history of gestational diabetes mellitus (GDM) or delivery of a baby weighing>4000 gram(9 lbs), and with polycystic ovary syndrome. Since 1999, 16 screening tools (or questionnaires) for screening pre-diabetes or diabetes based on demographic, anthropometric and clinical information have been established and validated in different populations. Some of these studies were longitudinal studies (Aekplakorn, et al., 2006; Baan, et al., 1999; Balkau, et al., 2008; Lindstrom, et al., 2003; Schmidt, et al., 2005; Schulze, et al., 2007; Stern, et al., 2002; Wilson, et al., 2007), and the others were cross-sectional studies (Al-Lawati, et al., 2007; Bindraban, et al., 2008; Cabrera de Leon, et al., 2008; Glumer, et al., 2004; Griffin, et al., 2000; Mohan, et al., 2005; Ramachandran, et al., 2005). Some of these tools included lifestyle behaviors such as dietary factors (Lindstrom, et al., 2003; Schulze, et al., 2007) and physical activity levels (Baan, et al., 1999; Glumer, et al., 2004; Lindstrom, et al., 2003; Mohan, et al., 2005; Ramachandran, et al., 2005; Schulze, et al., 2007), blood sampling and laboratory measurements (Baan, et al., 1999; Cabrera de Leon, et al., 2008; Schmidt, et al., 2005; Stern, et al., 2002; Wilson, et al., 2007), and some tools investigated family history 6.
(15) of diabetes (Aekplakorn, et al., 2006; Al-Lawati, et al., 2007; Baan, et al., 1999; Balkau, et al., 2008; Cabrera de Leon, et al., 2008; Glumer, et al., 2004; Hippisley-Cox, et al., 2009; Mohan, et al., 2005; Ramachandran, et al., 2005; Schmidt, et al., 2005; Stern, et al., 2002; Wilson, et al., 2007), medication of antihypertension (Baan, et al., 1999; Griffin, et al., 2000; Hippisley-Cox, et al., 2009; Lindstrom, et al., 2003; Wilson, et al., 2007) or steroid (Griffin, et al., 2000; Hippisley-Cox, et al., 2009). Most of them used random samples of general population (Bindraban, et al., 2008; Cabrera de Leon, et al., 2008; Glumer, et al., 2004; Griffin, et al., 2000; Lindstrom, et al., 2003; Mohan, et al., 2005; Ramachandran, et al., 2005; Schulze, et al., 2007; Stern, et al., 2002; Wilson, et al., 2007), and one used a community-based population, which all the inhabitants of Ommoord, Rotterdam, the Netherlands were recruited.. 7.
(16) Table 1—Screening tool of diabetes in the literature reviews Authors. Country. Subjects. Study design. Variables in instruments. 1. Caroline A. Baan (1999). Rotterdam, Dutch. Participants of the Rotterdam Study, a population-based study.. prospective cohort study. PM (predictive model) 1: age, sex, presence of obesity, and use of antihypertensive medication PM2: addition to variables in PM1 plus family history of diabetes, BMI, and physical activity PM3: addition to variables in PM2 plus blood pressure, WHR. 2. S.J.Griffin (2000). Ely, Cambridgeshire, UK Wessex, southern England. Random sample. cross-sectional study. sex, prescribed antihypertensive medication, prescribed steroid, age, BMI, parent or sibling had diabetes, smoke. 3. Michael P. Stern (2002). San Antonio, Texas. San Antonio Heart Study, including Mexican American and non-Hispanic whites, a population-based random sample.. prospective cohort study. age, sex, ethnic, fasting glucose, systolic blood pressure, HDL cholesterol, BMI, family history of diabetes. 4. Jaana Lindström (2003). North Karelia, Kuopio and South-Western Finland, as well as from the Helsinki-Vantaa region. A random sample was drawn from the National Population Register and the other was from FINRISK Studies. prospective cohort study. concise model: age, BMI, waist circumference, use of blood pressure medication, history of high blood glucose full model: addition to variables in concise model plus physical activity<4h/week, daily consumption of vegetables, fruits, or berries. 8. No.
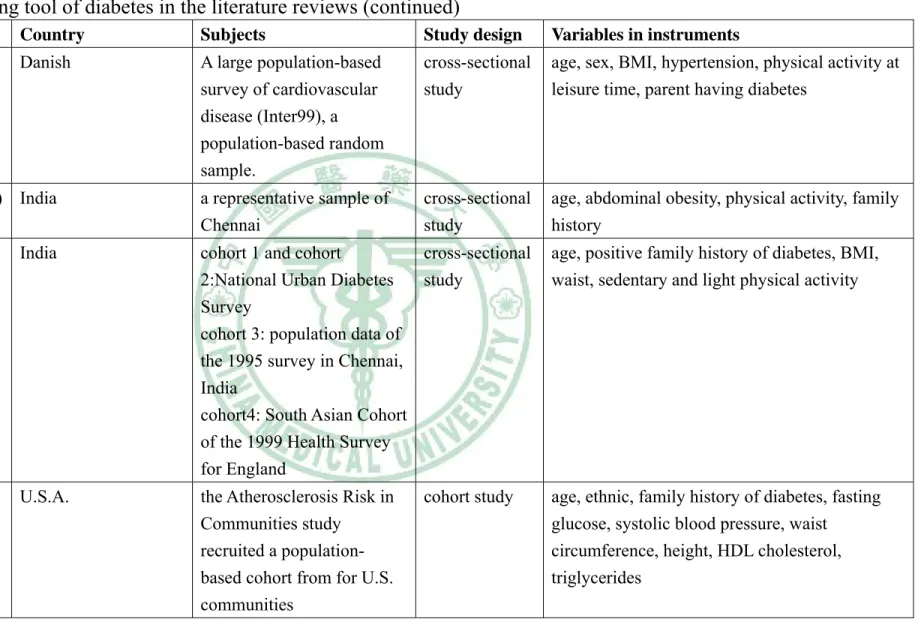
(17) Table 1 — Screening tool of diabetes in the literature reviews (continued) Authors. Country. Subjects. Study design. Variables in instruments. 5. Charlotte Glümer (2004). Danish. A large population-based survey of cardiovascular disease (Inter99), a population-based random sample.. cross-sectional study. age, sex, BMI, hypertension, physical activity at leisure time, parent having diabetes. 6. V Mohan (2005) India. a representative sample of Chennai. cross-sectional study. age, abdominal obesity, physical activity, family history. 7. A. Ramachandran (2005). India. cohort 1 and cohort cross-sectional 2:National Urban Diabetes study Survey cohort 3: population data of the 1995 survey in Chennai, India cohort4: South Asian Cohort of the 1999 Health Survey for England. age, positive family history of diabetes, BMI, waist, sedentary and light physical activity. 8. Maria Inês Schmidt (2005). U.S.A.. the Atherosclerosis Risk in Communities study recruited a populationbased cohort from for U.S. communities. age, ethnic, family history of diabetes, fasting glucose, systolic blood pressure, waist circumference, height, HDL cholesterol, triglycerides. 9. No. cohort study.
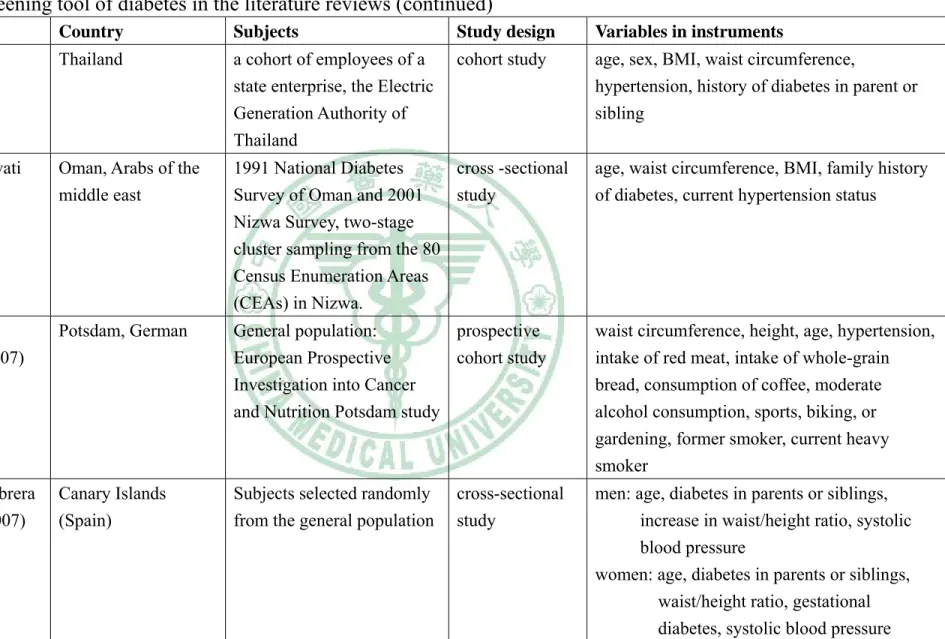
(18) Table 1 — Screening tool of diabetes in the literature reviews (continued). 10. No. Authors. Country. Subjects. Study design. Variables in instruments. 9. Wichai Aekplakorn (2006). Thailand. a cohort of employees of a state enterprise, the Electric Generation Authority of Thailand. cohort study. age, sex, BMI, waist circumference, hypertension, history of diabetes in parent or sibling. 10. J.A. Al-Lawati (2007). Oman, Arabs of the middle east. 1991 National Diabetes cross -sectional Survey of Oman and 2001 study Nizwa Survey, two-stage cluster sampling from the 80 Census Enumeration Areas (CEAs) in Nizwa.. age, waist circumference, BMI, family history of diabetes, current hypertension status. 11. Matthias B. Schulze (2007). Potsdam, German. General population: prospective European Prospective cohort study Investigation into Cancer and Nutrition Potsdam study. waist circumference, height, age, hypertension, intake of red meat, intake of whole-grain bread, consumption of coffee, moderate alcohol consumption, sports, biking, or gardening, former smoker, current heavy smoker. 12. Antonio Cabrera de León (2007). Canary Islands (Spain). Subjects selected randomly from the general population. men: age, diabetes in parents or siblings, increase in waist/height ratio, systolic blood pressure women: age, diabetes in parents or siblings, waist/height ratio, gestational diabetes, systolic blood pressure. cross-sectional study.
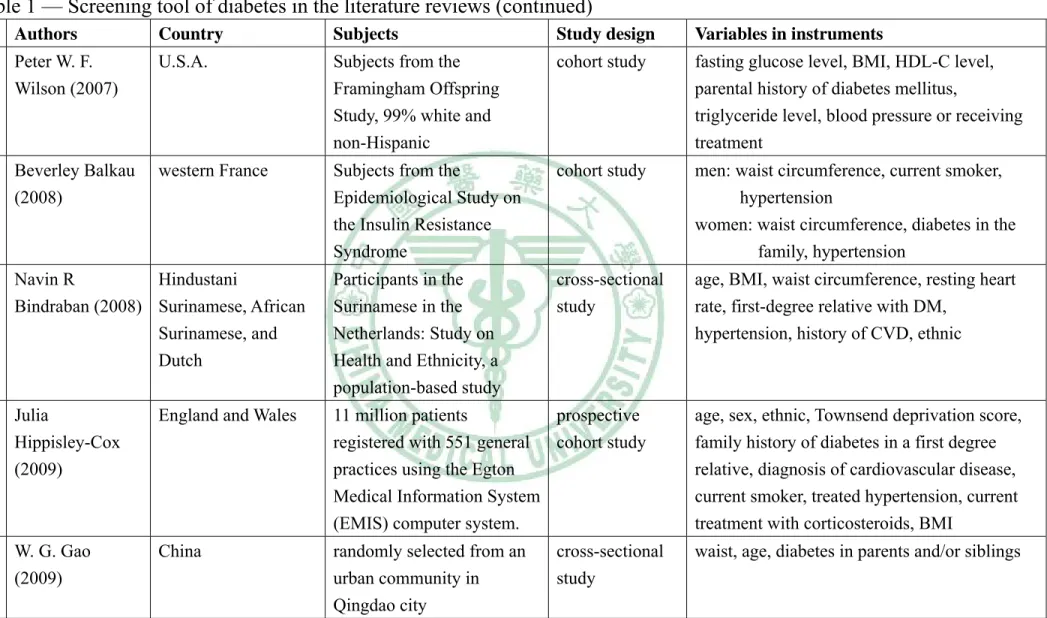
(19) Table 1 — Screening tool of diabetes in the literature reviews (continued) Authors. Country. Subjects. Study design. Variables in instruments. 13. Peter W. F. Wilson (2007). U.S.A.. Subjects from the Framingham Offspring Study, 99% white and non-Hispanic. cohort study. fasting glucose level, BMI, HDL-C level, parental history of diabetes mellitus, triglyceride level, blood pressure or receiving treatment. 14. Beverley Balkau (2008). western France. Subjects from the Epidemiological Study on the Insulin Resistance Syndrome. cohort study. men: waist circumference, current smoker, hypertension women: waist circumference, diabetes in the family, hypertension. 15. Navin R Hindustani Bindraban (2008) Surinamese, African Surinamese, and Dutch. Participants in the Surinamese in the Netherlands: Study on Health and Ethnicity, a population-based study. cross-sectional study. age, BMI, waist circumference, resting heart rate, first-degree relative with DM, hypertension, history of CVD, ethnic. 16. Julia Hippisley-Cox (2009). England and Wales. 11 million patients prospective registered with 551 general cohort study practices using the Egton Medical Information System (EMIS) computer system.. age, sex, ethnic, Townsend deprivation score, family history of diabetes in a first degree relative, diagnosis of cardiovascular disease, current smoker, treated hypertension, current treatment with corticosteroids, BMI. 17. W. G. Gao (2009). China. randomly selected from an urban community in Qingdao city. waist, age, diabetes in parents and/or siblings. 11. No. cross-sectional study.
(20) Chapter III Methods 3.1 Study design This was a prospective study with a random sample of 1,021 residents with normal glycemia and without any medication at baseline being followed for 3 years. New cases of pre-diabetes (fasting plasma glucose 100-126 mg/dl) and type 2 diabetes (fasting plasma glucose≥126 mg/dl or medication) were ascertained from physical check-up and laboratory examination.. 3.2. Study population This is a longitudinal epidemiological study based on data from the. Taichung Community Health Study (Lin, et al., 2007). The target population consisted of residents aged 40 and above in Taichung, Taiwan, in October 2004. There were a total of 363 543 residents in this area during the time of the study. A two-stage sampling design was used to recruit residents, with sampling rate proportional to size within each stage. A total of 4280 individuals were selected. During household visits we identified 750 individuals that were not eligible and, therefore, we excluded them from the study sample. At baseline, a total of 2359 residents who were randomly selected using multistage sampling and aged 40 and over in Taichung City, Taiwan, participated in October 2004. Between April 2007 and June 2009, the original participants were invited to participate in a follow-up examination. Of the remaining 1631 individuals, 610 subjects (37 %) with a past history of diagnosed diabetes mellitus or those with pre-diabetes (FPG≥100 mg/dl,. 12.
(21) according to ADA) were excluded from this analysis. There were 1021 individuals in the current analysis. This study was approved by the Human Research Committee of China Medical University Hospital. Written informed consent was obtained from each participant.. 3.3. Data collection Data on sociodemographic characteristics, including gender, age,. educational attainment, marital status, household income, smoking, drinking, physical activity, occupational activity, menopausal status, dietary habits, family history of cardiovascular-related diseases, physician-diagnosed diseases, and medication history were collected when the participants underwent a complete physical exam. In addition, educational level was divided into two categories: less than 9 years and more than 9 years. Marital status was divided into 3 categories: single, currently married and currently unmarried (including widowed, divorced or separated). Economic status was divided into two categories according to the participant’s monthly household income: NT40,000 or less and more than NT40,000. Questions on physical activity were separated into two categories: regular exercise yes/no. Anthropometric measurements were obtained from the complete physical examination. Weight and height were measured on an autoanthropometer (super-view, HW-666), with the subjects shoeless and wearing light clothing. Body mass index (BMI) was derived from the formula of weight (kg) ÷ (height)2 (m2). With the participant standing, waist circumference was measured midway between the superior iliac crest and the costal margin. Percent body fat mass (%FM) was assessed by conventional tetrapolar bioelectrical impedance analysis using the Tanita BC-418 MA 13.
(22) Impedanciometer (Tanita Corp., Tokyo, Japan) (Pietrobelli, et al., 2004). Blood pressure was measured using an electronic device (COLIN, VP-1000, Japan). Blood was drawn with minimal trauma from an antecubital vein in the morning, after a 12-hour overnight fasting, and was sent for analysis within four hours of collection. Biochemical markers such as fasting plasma glucose, high-density lipoprotein cholesterol (HDL-C), triglyceride, urine albumin and creatinine were analyzed by a biochemical autoanalyzer (Beckman Coluter Synchron system, Lx-20, Fullerton, CA, USA) at the Clinical Laboratory Department of China Medical University Hospital. Plasma cholesterol and triglyceride levels were determined by an enzymatic colorimetric method. The HDL-C level was measured by a direct HDL-C method and the low-density lipoprotein cholesterol (LDL-C) level was measured by a direct LDL-C method, too. The serum insulin level was measured by a commercial enzyme-linked immunosorbent assay kit (Diagnostic Products, Los Angeles, CA). The interassay CV for insulin was 8.7% and the intra-assay CV was 3.4%. Insulin sensitivity was estimated with a Homeostasis Model Assessment (HOMA-IR) equation. The HOMA-IR equals fasting serum insulin (μU/ml) times fasting plasma glucose (mmol/l) divided by 22.5 (Matthews, et al., 1985). Hs-CRP levels were measured by nephelometry, a latex particle-enhanced immunoassay (TBA-200FR, Tokyo, Japan). The interassay and intraassay CVs were <2.0% and <1.9%, respectively. The lower detection limit of the assay was 0.1 mg/L. The urinary albumin-to-creatinine ratio (ACR) in the morning urine sample was used as a marker of the albumin excretion rate. Urinary creatinine (Jaffe’s kinetic method) and albumin (colorimetyl bromcresol purple) were measured by an 14.
(23) autoanalyzer. The interassay precision coefficient of variation was <3.0% for both creatinine and albumin concentrations. Urinary ACR ranging from 30 mg g-1 creatinine to 300 mg g-1 creatinine was defined as microalbuminuria ("K/DOQI clinical practice guidelines for chronic kidney disease: evaluation, classification, and stratification," 2002). Using the Framingham risk score based on the LDL-C level (Wilson, et al., 1998), the estimated total coronary heart disease risk over a 10-year period for every individual was calculated. Data on sociodemographic characteristics, including gender, age, smoking, drinking, physical activity, occupational activity, menopausal status, family history of cardiovascular-related diseases, physician-diagnosed diseases, and medication history were collected when the participants underwent a complete physical examination.. 3.4. American Diabetes Association Risk Tool According to American Diabetes Association 2004 Screening for. pre-diabetes (ADA, 2004), American Diabetes Association Risk Tool (ADART) included 8 items for both men and women, and they were age over 45 years, being very over weight compared to height (BMI≥25 kg/m2), family history of diabetes, race or ethnicity, low physical activity level, previously identified IFG or IGT, high blood pressure, HDL cholesterol≤35 mg/dl (0.90 mmol/l) and/or a triglyceride level≥250 mg/dl (2.82 mmol/l), and history of vascular disease. There were two additional items for women: history of gestational diabetes mellitus (GDM) or delivery of a baby weighing>4000 gram (9 lbs), and with polycystic ovary syndrome. In this study, we didn’t take race or ethnicity into account. 15.
(24) 3.5. Statistical analysis Differences in proportions were assessed by using χ2 test. Weighted. cumulative incidence was calculated by using the following formula: 4. I. i. × Wi ,. i =1. where Ii is the age-, gender- and district-specific cumulative incidence in the study sample, and Wi is the weight of strata of various age, gender and district groups, which is equal to the number of size in the strata of the population divided by the number of entire population size. The weighted incidence was estimated by using the total population in Taichung aged 40 and over in 2003. To calculate the 95% confidence interval (CI) of the weighted cumulative incidence, the following formula for variance of the weighted cumulative incidence was used: 4. var = i =1. I i (1 − I i ) × (1 − f i ) × Wi 2 ni − 1. where Ii is the age-, gender- and district-specific cumulative incidence in the study sample, Wi is the weight of strata of various age, gender and district groups, and fi is the sampling probability, which is equal to the number of size in the strata of the sample divided by the number of size in the strata of the population. The strength of association between risk factors and the development of pre-diabetes or diabetes was measured by calculating age- and sex- adjusted odds ratios (ORs) with 95% confidence interval (CI) using multivariate logistic regression analyses. To validate the performance of (ADART) under different diabetes risk factors, we derived three logistic regression models: ADART only, ADART 16.
(25) plus significant lifestyle behaviors, and ADART plus significant lifestyle behaviors, physiological markers and biomarkers. All physiological markers and biomarkers were categorized according clinical criteria. Those variables which were significant at level of 0.25 were selected for enter into model. The areas under curves (AUCs) of ROC for these three models were calculated to compare their relative ability. Nonparametric method was used to test whether the AUCs of these three models were different (DeLong, et al., 1988). To draw the receiver operating characteristic (ROC) curve, sensitivity value is plotted against the 1-specificity value for each cutoff value. The nearest value to the intersection of the ROC curve and the 100%-to-100% diagonal line was considered as the best predictive value for identifying diabetes or pre-diabetes. Another way to identify the optimal sensitivity and specificity values of a ROC curve in detecting people with new pre-diabetes or diabetes, Youden index was used. After optimal sensitivity and specificity values of a ROC curve were identified, positive and negative likelihood ratios were reported. Positive likelihood ratio was defined as true positive rate divided by false positive rate, measuring the amount by which the pretest probability is increased in patients with a positive test. A positive likelihood ratio greater than or equal to 4 means the instrument is valuable and greater than or equal to 10 means the instrument is good (Stolper, et al., 2002). Negative likelihood ratio was defined as false negative rate divided by true negative rate, measuring the amount by which the pretest probability of disease is reduced in patients with a negative test. A negative likelihood ratio less than or equal to 0.6 means the instrument is useful and less than or equal to 0.1 means the instrument is good (Stolper, et al., 2002).. 17.
(26) Statistical analysis was performed using the SAS version 9.2 software (SAS Institute, Inc, Cary, NC).. 18.
(27) Chapter IV Results This chapter consists of three parts: the estimation of 3-year incidence of pre-diabetes or diabetes, assessing the ability of ADART for predicting 3-year incidence of pre-diabetes or diabetes, and comparing the ability of ADART with other screening undiagnosed pre-diabetes or diabetes.. 4.1. The estimation of 3-year incidence of pre-diabetes or diabetes Table 2 shows sociodemographic and anthropometric factors in males. and females who were followed up and those who were not followed up. Distributions of most variables were similar between individuals who were and who were not followed up, except microalbumin, cholesterol and triglyceride. Overall, 184 new cases of pre-diabetes or diabetes were identified after a mean follow-up of 3 years, which resulted in a crude cumulative incidence of 18.02% (95% CI: 15.64-20.36). The age- and gender- weighted cumulative incidence was 17.83% (95% CI: 15.41-20.24) using Taichung population in 2003 as standard population.. 19.
(28) Table 2—Comparison of baseline characteristics between individuals who were followed up and not followed up Male (n=1116). Female (n=1195). Not followed n=286(SD). Followed n=830(SD). Not followed n=394 (SD). Followed n=801(SD). Age (year). 59.29(13.26). 57.78(11.66). 55.96(11.63). 54.45(9.51). Weight (kg). 67.62(10.51). 69.29(10.18). 58.60(8.97). 57.25(8.36). Height (cm). 166.13(6.13). 166.63(6.15). 154.90(5.39). 155.62(5.29). FAT (%). 25.86(5.84). 26.01(5.58). 37.02(6.19). 35.83(5.88). SYS (mmHg). 141.04(21.10). 137.83(20.09). 136.29(24.63). 130.37(21.15). DIA (mmHg). 83.37(12.33). 82.22(11.03). 77.22(12.85). 74.51(11.93). Waist (cm). 85.87(9.01). 86.47(8.65). 78.14(9.50). 75.97(8.39). GOT (IU/L). 28.78(26.04). 27.47(11.88). 25.93(15.67). 25.64(14.84). GPT (IU/L). 30.95(48.61). 29.91(19.26). 25.56(30.62). 24.62(22.06). CHOL (mg/dl). 197.88(39.06). 201.67(35.99). 205.94(40.27). 206.11(37.48). TG (mg/dl). 128.63(97.06). 140.16(117.34). 112.92(76.73). 104.37(66.66). FPG (mg/dl). 110.46(41.05). 104.83(24.74). 104.91(35.60). 98.96(21.65). 6.53(1.88). 7.55(38.75). 5.80(1.64). 5.59(1.47). RBC (10 /μl). 4.94(0.57). 5.00(0.54). 4.51(0.45). 4.54(0.46). HGB (g/dl). 14.82(1.32). 15.05(1.18). 13.25(1.25). 13.21(1.22). HCT (%). 44.27(3.70). 44.86(3.29). 40.27(3.27). 40.20(3.21). 227.90(59.52). 224.29(57.10). 244.73(63.17). 247.67(57.99). URIC (mg/dl). 6.37(1.42). 6.30(1.39). 5.24(1.22). 4.94(1.06). HDL (mg/dl). 41.50(10.84). 41.28(10.61). 49.04(12.36). 50.80(12.78). LDL (mg/dl). 126.56(37.00). 128.22(32.77). 128.39(34.37). 127.13(33.49). BUN (mg/dl). 14.50(6.29). 13.87(4.28). 12.84(4.82). 11.97(3.91). MA (mg/g cr). 39.58(209.28). 25.20(100.26). 28.90(77.33). 20.22(90.65). 1.11(0.63). 1.05(0.25). 0.81(0.46). 0.73(0.17). WBC (103/μl) 6. 3. PLT (10 /μl). Creatine (mg/dl). 20.
(29) Table 3 reports the cumulative incidence and their 95% CIs of pre-diabetes or diabetes according to different risk factors stratified by gender. In males, most of the 100 incidence cases belonged to the 50-59 years group (37.00%) followed by 40-49 years (25.00%), 60-69 years (20.00%) and ≥ 70 years (18.00%). In females, most of the 84 incidence cases belonged to less than 60 years (73.81%), 60-69 years (20.24%) and ≥ 70 years (5.95%). The mean age at diagnosis of pre-diabetes or diabetes was 57.93 years in males and 54.45 in females with standard deviations of 11.26 and 8.89 years respectively. In males, individuals with income over NT40,000 significantly decreased incidence of abnormal glycemia (p=0.0331). Current or past smoking did not increase the incidence. Incidence of pre-diabetes or diabetes was higher in those with family history of hyperlipidemia (p=0.0406). As expected, higher diastolic blood pressure and higher triglyceride were significant predictors of incidence pre-diabetes or diabetes (p=0.0492, and p=0.0211, respectively). In females, lower education significantly increased the incidence (p=0.0018). Waist, BMI, Fat%, hypertension, triglyceride and Framingham score were all significant associated with the incidence of pre-diabetes and diabetes (the corresponding p values were 0.0202, <0.0001, <0.0001, 0.0071, 0.0145, 0.0029, 0.0068, respectively).. 21.
(30) Table 3—Three-year incidence rate of pre-diabetes or diabetes according to various risk factors stratified by gender. Male (n=456) N. IFG or DM % (95% CI). Female (n=565) P value. N. IFG or DM (%) % (95% CI). P value. Sociodemographic factors at baseline Age (year). 0.0866. 0.4500. 40-49. 161. 15.5 (9.9-21.1). 246. 12.6 (8.5-16.8). 50-59. 145. 25.5 (18.4-32.6). 198. 15.7 (10.6-20.7). 60-69. 72. 27.8 (17.4-38.1). 88. 19.3 (11.1-27.6). ≥70. 74. 24.3 (14.6-34.1). 28. 17.9 (3.7,32.0). Education. 0.2790. 0.0018*. ≤9. 121. 25.6 (17.8-33.4). 190. 21.6 (15.7-27.4). >9. 331. 20.9 (16.5-25.2). 370. 11.6 (8.4-14.9). Income. 0.0331*. 0.7014. ≤ 40000. 193. 26.9 (20.7-33.2). 236. 15.7 (11.4-20.3). >40000. 259. 18.5 (13.8-23.3). 324. 14.5 (10.7-18.3). Smoking. 0.8956. 0.7782. Never. 235. 22.1 (16.8-27.4). 537. 15.1 (12.1-18.1). Current. 129. 20.9 (13.9-28.0). 18. 11.1 (0.0-25.6). Former. 87. 24.1 (15.2-33.1). 4. 25.0 (0.0-67.4). Drinking. 0.6534. 0.5334. Never. 254. 24.0 (18.8-29.3). 494. 14.6 (11.5-17.7). Current. 158. 20.3(14.0-26.5). 59. 17.0 (7.4-26.5). Former. 39. 18.0 (5.9-30.0). 7. 28.6 (0.0-62.0). Betel nut chewing. 0.2624. 1.0000. Never. 379. 21.4 (17.2-25.5). 558. 15.1 (12.1-18.0). Current. 24. 37.5 (18.1-56.9). 1. 100 (100-100). Former. 46. 21.3 (9.6-33.0). 1. 100 (100-100). Exercise. 0.9419. 0.2468. No. 149. 22.8 (16.1-29.6). 177. 12.4 (7.6-17.3). Yes. 301. 21.9 (17.3-26.6). 383. 16.2 (12.5-19.9). Family history of diabetes. 0.8189. 0.1093. No. 335. 22.4 (17.9-26.9). 382. 13.4 (9.9-16.8). Yes. 117. 21.4(13.9-28.8). 178. 18.5 (12.8-24.3). 22.
(31) Table 3—Three-year incidence rate of pre-diabetes or diabetes according to various risk factors stratified by gender. (continued) Male (n=456) N. IFG or DM % (95% CI). Family history of heart disease. Female (n=565) P value. N. IFG or DM (%) % (95% CI). 0.5655. 0.5291. No. 353. 21.5 (17.2-25.8). 411. 15.6 (12.1-19.1). Yes. 99. 24.2 (15.8-32.7). 149. 13.4 (8.0-18.9). Family history of cardiovascular disease. 0.4520. 0.5371. No. 390. 21.5 (17.5-25.6). 446. 15.47 (12.1-18.8). Yes. 62. 25.8 (14.9-36.7). 114. 13.2 (7.0-19.4). Family history of high blood pressure. 0.6340. 0.5607. No. 258. 21.3 (16.3-26.3). 257. 16.0 (11.5-20.4). Yes. 194. 23.2 (17.3-29.1). 303. 14.2 (10.3-18.1). Family history of hyperlipidemia. 0.0406*. 0.6602. No. 401. 20.7 (16.7-24.7). 464. 15.3 (12.0-18.6). Yes. 51. 33.3 (20.4-46.3). 96. 13.5 (6.7-20.4). Family history of gout. 0.3368. 0.1121. No. 43. 27.9 (14.5-41.3). 35. 5.7 (0.0-13.4). Yes. 409. 21.5 (175-25.5). 525. 15.6 (12.5-18.7). Marital status. 0.8771. 0.2389. single. 12. 16.7 (0.0-37.8). 28. 7.1 (0.0-16.7). married. 400. 22.5 (18.4-26.6). 446. 16.1 (12.7-19.6). widowed/ divorced/ separated. 38. 21.1 (8.1-34.0). 82. 11.0 (4.2-17.7). TV watching time (hrs/week) rd. <3 quartile. 0.6858. 0.0003*. 288. 21.5 (16.8-26.3). 415. 11.8 (8.7-14.9). 164. 23.2 (16.7-29.6). 145. 24.1 (17.2-31.1). (M<21, F<25) ≥3rd quartile. (M≥21, F≥25). 23. P value.
(32) Table 3—Three-year incidence rate of pre-diabetes or diabetes according to various risk factors stratified by gender. (continued) Male (n=456) N. IFG or DM % (95% CI). Female (n=565) P value. N. IFG or DM (%) % (95% CI). P value. Health status at baseline Waist (cm). 0.6979. 0.0202*. M≤ 90, F≤80. 346. 22.5 (18.1-27.0). 446. 13.2 (10.1-16.4). M>90, F>80. 106. 20.8 (13.0-28.5). 114. 21.9 (14.3-29.5). BMI (kg/m2) st. 0.8216. <.0001*. 1 tertile (M=23.12, F=21.76). 151. 23.8 (17.0-30.6). 187. 6.42 (2.9-9.9). 2nd tertile. 147. 21.1 (14.5-27.7). 184. 14.7 (9.6-19.8). 154. 21.4 (15.0-27.9). 189. 23.8 (17.7-29.9). (M=25.38, F=24.14) 3rd tertile Fat (%) st. 0.3410. <.0001*. 1 tertile (M=22.9, F=32.8). 146. 20.6 (14.0-27.1). 181. 6.1 (2.6-9.6). 2nd tertile (M=27.3, F=37.7). 149. 19.5 (13.1-25.8). 186. 16.1 (10.8-21.4). 3rd tertile. 154. 26.0 (19.1-32.9). 191. 22.5 (16.6-28.4). Systolic blood pressure (mmHg). 0.0582. 0.0071*. <130. 191. 17.8 (12.4-23.2). 347. 11.8 (8.4-15.2). ≥130. 261. 25.3 (20.0-30.6). 213. 20.2 (14.8-25.6). Diastolic blood pressure (mmHg). 0.0492*. 0.0145*. <85. 295. 19.3 (14.8-23.8). 465. 13.3 (10.2-16.4). ≥85. 157. 27.4 (20.4-34.4). 95. 23.2 (14.7-31.6). 24.
(33) Table 3—Three-year incidence rate of pre-diabetes or diabetes according to various risk factors stratified by gender. (continued) Male (n=456) N. IFG or DM % (95% CI). Total cholesterol (mg/dl) st. Female (n=565) P value. N. IFG or DM (%) % (95% CI). 0.0815. P value 0.8610. 1 tertile (M=184, F=188). 149. 16.1 (10.2-22.0). 181. 13.8 (8.8-18.8). 2nd tertile. 148. 23.7 (16.8-30.5). 185. 15.7 (10.4-20.9). 155. 26.5 (19.5-33.4). 194. 15.5 (10.4-20.6). (M=215, F=218) 3rd tertile. Triglyceride (mg/dl). 0.0211*. 0.0029*. ≤150. 326. 19.3 (15.0-23.6). 479. 13.2 (10.13-16.2). >150. 126. 29.4 (21.4-37.3). 81. 25.9 (16.4-35.5). LDL-cholesterol (mg/dl) st. 0.8909. 0.4547. 1 tertile (M=114.9, F=109.7). 148. 23.0 (16.2-29.8). 186. 12.4 (7.6-17.1). 2nd tertile. 149. 20.8 (14.3-27.3). 183. 15.9 (10.6-21.1). 155. 22.6 (16.0-29.2). 191. 16.8 (11.5-22.1). (M=140.8, F=137.9) 3rd tertile. HDL-cholesterol (mg/dl). 0.9600. 0.0567. M<40, F<50. 227. 22.0 (16.6-27.4). 273. 18.0 (13.4-22.5). M≥40,. 225. 22.2 (16.8-27.7). 287. 12.2 (8.4-16.0). F≥50 GOT (IU/L). 0.7050. 0.3682. <40. 424. 21.9 (18.0-25.9). 537. 14.7 (11.7-17.7). ≥40. 28. 25.0 (9.0-41.0). 23. 21.7 (4.9-38.6). GPT(IU/L). 0.2393. 0.0530. <40. 383. 21.2 (17.1-25.2). 516. 14.2 (11.1-17.2). ≥40. 69. 27.5 (17.0-38.1). 44. 25.0 (12.2-37.8). 25.
(34) Table 3—Three-year incidence rate of pre-diabetes or diabetes according to various risk factors stratified by gender. (continued) Male (n=456) N. IFG or DM % (95% CI). Framingham score. Female (n=565) P value. N. IFG or DM (%) % (95% CI). 0.9305. 0.0068*. <9. 336. 22.0 (17.6-26.5). 402. 12.4 (9.21-15.7). ≥9. 116. 22.4 (14.8-30.0). 158. 21.5 (15.1-27.9). Micro albumin. P value. 0.3813. 0.4897. <30. 368. 21.6 (17.6-25.7). 460. 14.7 (11.7-17.8). ≥30. 48. 27.1 (14.5-39.7). 37. 18.9 (6.4-31.5). ≤1.5. 439. 22.1 (18.2-26.0). 558. 15.1 (12.1-18.0). >1.5. 13. 23.1 (0.2-46.0). 2. 100.0 (100-100). creatinine. Uric acid. 1.0000 0.2606. 1.0000. M<7, F<6.5. 336. 20.8 (16.5-25.2). 530. 15.1 (12.1-18.1). M≥7, F≥6.5. 116. 25.9 (18.0-33.8). 30. 13.3 (1.2-0.25.5). 26. 1.0000.
(35) Table 4 demonstrates the results of the logistic regression model with p value of less than 0.25 in table 3. In male, the multivariate model included age, low income, family history of hyperlipidemia, hypertension, high total cholesterol, high TG and abnormal GPT. In female, low education level, regular exercise, family history of diabetes, family history of gout, martial status, waist, BMI, hypertension, high TG, low HDL, abnormal GPT and Framingham score were included in the multivariate model. The significant independent variables in male were age 50-59 (OR=1.9, 95% CI=1.1,3.4), age 60-69 (OR=2.1, 95% CI=1.0-4.2), and family history of hyperlipidemia (OR=2.1, 95% CI=1.1-4.0). In female, they were education≤9 years (OR=1.9, 95% CI=1.1-3.2), BMI in the 2nd tertile (OR=2.1, 95% CI=1.0-4.4), and in the 3rd tertile (OR=3.5, 95% CI=1.6-7.7).. 27.
(36) Table 4—Variables associated with incident pre-diabetes or diabetes and their corresponding odds ratios in the Taichung population aged 40 and over after a 3-year follow-up period. Variables. OR (95%CI). P. —. —. 50-59. 1.9 (1.1-3.4). 0.0339. 60-69. 2.1 (1.0-4.2). 0.0416. ≥70. 1.8 (0.9-3.8). 0.1142. Income≤40000 NT. 1.5 (0.9-2.4). 0.1142. With family history of hyperlipidemia. 2.1 (1.1-4.0). 0.0358. Systolic blood pressure≥130 (mmHg). 1.3 (0.7-2.2). 0.3829. Diastolic blood pressure≥85 (mmHg). 1.1 (0.6-1.9). 0.8117. 1st tertile (<184) (ref). —. —. 2nd tertile (184-215). 1.7 (0.9-3.0). 0.1048. 3rd tertile (≥215). 1.7 (1.0-3.2). 0.0690. Triglyceride>150 (mg/dl). 1.5 (0.9-2.4). 0.1260. GPT≥40 (IU/L). 1.3 (0.7-2.5). 0.3835. Male Age (year) 40-49 (ref). Total cholesterol (mg/dl). Odds ratios were obtained by multivariate logistic regression analysis.. 28.
(37) Table 4—Variables associated with incident pre-diabetes or diabetes and their corresponding odds ratios in the Taichung population aged 40 and over after a 3-year follow-up period. (continued) Variables. OR (95%CI). P. Education≤9 years. 1.9 (1.1-3.2). 0.021. No regular exercise. 1.2 (0.7-2). 0.611. family history of diabetes. 1.6 (0.9-2.7). 0.082. family history of gout. 7.5 (1.0-58.0). 0.055. —. —. married. 2.4 (0.5-11.1). 0.2634. widowed/divorces/separated. 1.2 (0.2-6.7). 0.8366. 0.8 (0.4-1.5). 0.501. —. —. 2nd tertile (21.76-24.14). 2.1 (1.0-4.4). 0.0448. 3rd tertile (≥24.14). 3.5 (1.6-7.7). 0.0018. Systolic blood pressure≥130 (mmHg). 1.0 (0.5-1.9). 0.998. Diastolic blood pressure≥85 (mmHg). 1.5 (0.7-2.9). 0.292. Triglyceride>150 (mg/dl). 1.6 (0.8-3). 0.157. HDL-cholesterol<50 (mg/dl). 1.2 (0.7-2). 0.586. 1.7 (0.8-3.8). 0.173. 1.0 (0.6-2). 0.891. Female. Marital status single (ref). Waist>80 (cm) BMI 1st tertile (<21.76). Gpt≥40 (IU/L) Framingham score≥9. Odds ratios were obtained by multivariate logistic regression analysis.. 29.
(38) 4.2. Assessing the ability of ADART for predicting 3-year incidence of pre-diabetes or diabetes In model 1with the eight variables of ADART, the area under the ROC. curve was 0.60 (95% CI 0.54-0.66) (Table 5) in male. In female, there were ten variables in ADART and the AUC was 0.72 (95% CI: 0.66-0.77) (Table 5). In males, history of cardiovascular is a significant factor, whereas in females, they are BMI≥25 kg/m2, HDL≤35 mg/dl or TG≥250 mg and gestational diabetes or delivering a baby above 4000 gram. Table 5—The ability of ADART (model 1) for predicting 3-year incidence of pre-diabetes or diabetes Male (n=456) OR. P value. Female (n=565) OR. P value. AUC (95% CI) 0.60 (0.54-0.66). AUC (95% CI) 0.72 (0.66-0.77). 1.532. 0.205. 1.478. 0.312. 1.029. 0.908. 2.594. 0.001*. family history of diabetes. 1.104. 0.730. 1.489. 0.158. low physical activity level. 1.050. 0.848. 0.786. 0.400. previously identified IFG or IGT. 1.933. 0.462. 2.682. 0.475. high blood pressure. 1.374. 0.215. 1.165. 0.614. HDL cholesterol≤35 (mg/dl) or TG≥250 (mg/dl). 0.742. 0.255. 4.273. <.0001*. history of vascular disease. 2.705. 0.004*. 0.810. 0.694. history of GDM or delivery of a baby weighing>4000 g. -. -. 1.979. 0.038*. with polycystic ovary syndrome. -. -. 1.358. 0.552. model 1. age≥45 years BMI≥25 (kg/m2). 30.
(39) In model 2, we further considered family history of hyperlipidemia in male, the AUC was slightly higher than model 1 (0.62, 95% CI: 0.56-0.68) (Table 6). For female, we further considered education attainment≤9 years and TV watching time≥25 hrs/week, the AUC was 0.74 (95% CI: 0.68-0.80) (Table 6). The significance level of the added variables in male was at border line, whereas both of the added variables in female were significant at 0.05. Table 6—The ability of ADART plus lifestyle behavior (model 2) for predicting 3-year incidence of pre-diabetes or diabetes Male (n=456) OR. P value. Female (n=565) OR. P value. AUC (95% CI) 0.62 (0.56-0.68). AUC (95% CI) 0.74 (0.68-0.80). 1.567. 0.185. 1.170. 0.689. 1.057. 0.825. 2.160. 0.006. family history of diabetes. 0.997. 0.991. 1.596. 0.107. low physical activity level. 1.058. 0.823. 0.735. 0.292. previously identified IFG or IGT. 2.020. 0.436. 3.498. 0.357. high blood pressure. 1.284. 0.337. 1.176. 0.595. HDL cholesterol≤35 (mg/dl) or TG≥250 (mg/dl). 0.744. 0.260. 4.347. <.0001*. history of vascular disease. 2.721. 0.004. 0.781. 0.654. history of GDM or delivery of a baby weighing>4000 g. -. -. 2.038. 0.034. with polycystic ovary syndrome. -. -. 1.539. 0.403. family history of hyperlipidemia. 1.873. 0.065. -. -. education attainment≤9 years. 1.902. 0.019. TV watching time≥25 hrs/week. 1.951. 0.016. model 2. age≥45 years BMI≥25 (kg/m2). 31.
(40) In model 3, taking physiological markers and biomarkers into account, in male, after adding TG into model, the AUC became 0.64 (95% CI: 0.58-0.71) (Table 7). In female, we considered diastolic blood pressure, the AUC became 0.75 (95% CI: 0.69-0.80) (Table 7). There were no statistical difference in the AUCs among the ADART, model 2 and model 3 both in man and woman. In model 3, among ADART variables in male, history of cardiovascular disease still remained significant after further taking physiological markers and biomarkers into account. In female, all added variables were not significant in model 3. The significant factors associated with higher risk were BMI≥25 kg/m2, HDL cholesterol≤35 mg/dl or TG≥250 mg/dl, history of GDM or delivery of a baby weighing>4000 g, education attainment≤9 years, and TV watching time≥25 hrs/week. We further examined whether the AUCs of models 1, 2 and 3 and the results that there were no statistical difference in the AUCs among in these 3 models both in male and female (p=0.2678 for male and p=0.1564 for female) (Figures 1 and 2).. 32.
(41) Table 7—The ability of ADART plus lifestyle behaviors and biomarkers (model 3) for predicting 3-year incidence of pre-diabetes or diabetes Male (n=456) OR. P value. Female (n=565) OR. P value. AUC (95% CI) 0.64 (0.58-0.71). AUC (95% CI) 0.75 (0.69-0.80). 1.547. 0.200. 1.151. 0.721. 1.017. 0.948. 2.076. 0.010*. family history of diabetes. 0.981. 0.947. 1.631. 0.094. low physical activity level. 1.035. 0.893. 0.736. 0.297. previously identified IFG or IGT. 2.049. 0.430. 3.058. 0.406. high blood pressure. 1.240. 0.415. 0.974. 0.938. HDL cholesterol≤35 (mg/dl) or TG≥250 (mg/dl). 0.620. 0.084. 4.463. <.0001*. history of vascular disease. 2.960. 0.002*. 0.790. 0.672. history of GDM or delivery of a baby weighing>4000 g. -. -. 2.048. 0.033*. with polycystic ovary syndrome. -. -. 1.637. 0.342. family history of hyperlipidemia. 1.740. 0.108. triglyceride>150 (mg/dl). 1.959. 0.011*. education attainment≤9 years. 1.830. 0.028*. TV watching time≥25 hrs/week. 1.920. 0.020*. diastolic blood pressure≥85 mmHg. 1.645. 0.156. model 3. age≥45 BMI≥25. 33.
(42) P=0.2678. Figure 1—Comparing the AUCs of model 1, model 2, and model 3 in male. P=0.1564. Figure 2—Comparing the AUCs of model 1, model 2, and model 3 in female. 34.
(43) Table 8—The predictive performance of American Diabetes Association Risk Tool Model. AUC (95% CI). p value. sensitivity. specificity. LR+. LR-. Youden index. Male model 1 model 2 model 3. 0.60 (0.54-0.66) 0.62 (0.56-0.68) 0.64 (0.58-0.71). 0.3171 0.1055. 0.24 0.78 0.71. 0.90 0.34 0.45. 2.47 1.19 1.28. 0.84 0.64 0.65. 0.14 0.12 0.16. Female model 1 model 2 model 3. 0.72 (0.65-0.77) 0.74 (0.68-0.80) 0.75 (0.69-0.80). 0.2126 0.0862. 0.74 0.75 0.74. 0.58 0.60 0.62. 1.76 1.86 1.94. 0.45 0.42 0.42. 0.32 0.35 0.36. model 1: ADART, model 2: ADART+lifestyle behavior, model 3: ADART+lifestyle behavior+anthropometric Youden index was defined as the maximum of (sensitivity+specificity-1) 4.3 Comparing the ability of ADART with other screening tools in diagnosed pre-diabetes or diabetes.. The predictive performance of these screening tools for pre-diabetes or diabetes in our study are summarized in Table 9. In male, the largest AUC for pre-diabetes and diabetes was 0.64 (95% CI : 0.58-0.70), developed by Schmidt with 56% sensitivity and 67% specificity using optimal cutoff values. There were statistical differences in the AUC for pre-diabetes or diabetes between ADA, and tools developed by Ramachandran, Aekplakorn, Lawati, Balkau, Bindraban, but there were no statistical differences in the AUC between ADA and tools developed by Baan, Griffin, Stern, Lindström, Glumer, Mohan, Schulze, de León, Cox, Wilson, and Schmidt. In female, the largest AUC for pre-diabetes or diabetes was 0.72 (95% CI: 0.65-0.77), with 74% sensitivity and 58% specificity. There were statistical differences in the 35.
(44) AUC between ADA, and tools developed by Baan PM1, Lindström, Glumer, Mohan, Romachandran, Lawati, Schulze, Balkau, Bindraban, and Wilson, and, there were no statistical differences in the AUC between ADA, and tools developed by Baan PM2, Griffin, Stern, Aekplakorn, León, Cox, and Schimidt for pre-diabetes or diabetes. Among these tools, none of them had positive likelihood ratio greater than or equal to 4 either in male or female. On the contrary, three in male and 10 in female had negative likelihood ratio less than or equal to 0.6. These useful tools for male were developed by Baan, Mohan, and León and for female were developed by ADA, Baan, Griffin, Stern, Schmidt, Lawati, Schulze, León, Balkau, and Cox.. 36.
(45) Table 9—ADART and instruments published in literature in screen undiagnosed pre-diabetes or diabetes tool Male ADA Baan PM1 PM2 Griffin1 Stern2 Lindström Glümer Mohan Ramachandran Schmidt2 Aekplakorn Lawati Schulze3 León Wilson4 Balkau Bindraban Cox. AUC (95%CI) sensitivity specificity. LR+. LR-. youden index. 0.60(0.54-0.66). 0.24. 0.90. 2.47. 0.84. 0.14. 0.57(0.51-0.63) 0.54(0.48-0.60) 0.54(0.47-0.60) 0.60(0.54-0.66) 0.55(0.48-0.61) 0.56(0.50-0.62) 0.53(0.47-0.59) 0.51(0.44-0.57). 0.77 0.90 0.69 0.72 0.86 0.55 0.96 0.27. 0.35 0.18 0.38 0.45 0.23 0.58 0.10 0.79. 1.18 1.10 1.11 1.30 1.12 1.30 1.07 1.28. 0.66 0.54 0.82 0.63 0.61 0.78 0.39 0.92. 0.12 0.08 0.07 0.17 0.09 0.13 0.06 0.06. 0.64(0.58-0.70) 0.50(0.44-0.57) 0.52(0.46-0.58) 0.55(0.49-0.61) 0.57(0.51-0.63) 0.54(0.48-0.60) 0.50(0.44-0.56) 0.53(0.47-0.59) 0.52(0.46-0.59). 0.56 0.27 0.18 0.73 0.74 0.71 0.82 0.71 0.09. 0.67 0.77 0.87 0.40 0.44 0.38 0.21 0.35 0.95. 1.71 1.19 1.35 1.22 1.32 1.14 1.03 1.09 1.83. 0.65 0.94 0.95 0.67 0.59 0.77 0.87 0.84 0.96. 0.23 0.04 0.05 0.13 0.18 0.09 0.03 0.06 0.04. 1: lack of prescribed steroid 2: lack of ethnic 3: lack of intake of red meat and whole-grain 4: Fasting glucose level 100-126 mg/dL, yes/no. 37.
(46) Table 9—ADART and instruments published in literature in screen undiagnosed pre-diabetes or diabetes (continued) tool Female ADA Baan PM1 PM2 Griffin1 Stern2 Lindström Glumer Mohan Ramachandran Schmidt2 Aekplakorn Lawati Schulze3 León Wilson4 Balkau Bindraban Cox. AUC (95%CI) sensitivity specificity. LR+. LR-. youden index. 0.72(0.65-0.77). 0.74. 0.58. 1.76. 0.45. 0.32. 0.58(0.52-0.64) 0.69(0.64-0.75) 0.66(0.60-0.72) 0.73(0.67-0.79) 0.62(0.55-0.69) 0.62(0.56-0.69) 0.53(0.46-0.60) 0.64(0.58-0.71). 0.35 0.80 0.74 0.71 0.30 0.54 0.14 0.63. 0.76 0.52 0.52 0.65 0.87 0.67 0.91 0.58. 1.47 1.65 1.55 2.02 2.28 1.60 1.55 1.52. 0.86 0.39 0.50 0.44 0.81 0.70 0.94 0.63. 0.11 0.31 0.26 0.36 0.17 0.20 0.05 0.21. 0.73(0.67-0.79) 0.68(0.62-0.74) 0.63(0.57-0.69) 0.65(0.59-0.71) 0.65(0.59-0.71) 0.63(0.56-0.70) 0.65(0.59-0.71) 0.65(0.59-0.71) 0.67(0.61-0.73). 0.83 0.54 0.85 0.73 0.85 0.54 0.67 0.48 0.90. 0.55 0.70 0.39 0.54 0.39 0.66 0.57 0.74 0.35. 1.84 1.76 1.40 1.58 1.39 1.57 1.55 1.83 1.39. 0.30 0.67 0.39 0.51 0.40 0.70 0.59 0.71 0.27. 0.38 0.23 0.24 0.27 0.24 0.20 0.24 0.22 0.25. 1: lack of prescribed steroid 2: lack of ethnic 3: lack of intake of red meat and whole-grain 4: Fasting glucose level 100-126 mg/dL, yes/no. 38.
(47) Chapter V Discussion/Conclusions 5.1. The estimation of 3-year incidence of pre-diabetes or diabetes In this prospective study, we estimated the incidence rates of. pre-diabetes or diabetes and evaluate various risk factors for the development of pre-diabetes or diabetes in a representative sample of the general population of the entire Taichung City in central Taiwan. New cases of pre-diabetes or diabetes were determined on the basis of a fasting glucose test both at baseline and at follow-up, which represented known and unknown pre-diabetes or diabetes cases. Although 30% of the participants at the follow-up of the original cohort were not complete, the distributions of baseline variables were pretty similar between participants and without follow-up, thus minimizing the potential selection bias. The incidence rate of pre-diabetes or diabetes has not been reported for Asia populations and other countries, mainly because data are lacking. Most of previous studies based on review of medical record, use of drugs, or questionnaires reported incidence rates of type 2 diabetes ranging from 1 to 5 cases/1000 person-years (Harati, et al., 2009; Longo-Mbenza, et al., 2010; Valdes, et al., 2007). These rates should be underestimated because these studies only included individuals who already had a diagnosis of diabetes. In this first report of the population-based incidence of pre-diabetes or diabetes in the Asia region, which used FPG to ascertain glucose status both at baseline and at follow-up, we estimated the standardized incidence rate of pre-diabetes or diabetes in a representative sample of Taiwanese adults aged 40 and over to be 17.83% in a 3-year period. 39.
(48) Our study findings indicated that family history of hyperlipidemia, large waist, high BMI, high blood pressure, triglyceride, and Framingham score were important risk factors for development of pre-diabetes or diabetes in our study, which was consistent with those reported by previous studies (Valdes, et al., 2007). In addition, our study findings showed low education level was a strong predictor of pre-diabetes or diabetes. After multivariate adjustment, identified significant risk factors namely age and family history of hyperlipidemia in male, and low education and BMI in female. Because of lacking pre-diabetes incidence in the past, we can’t compare our findings with those in literature. But in the current study, we found pre-diabetes or diabetes incidence was higher than diabetes incidence by previous studies. Using the criteria of glucose tolerance test, the estimates of incidence rate of type 2 diabetes in most European studies range from 7.6 to 10.8/1000 per-year. (Bonora, et al., 2004; Forouhi, et al., 2007; Valdes, et al., 2007). In particular, in the Ely study in UK the crude incidence rate was 7.3/1000 PY (Forouhi, et al., 2007), similar to a recent report in the Australia (7.0/1000 PY) (Magliano, et al., 2008).. 5.2. Assessing the ability of ADART for predicting 3-year incidence of pre-diabetes or diabetes Most of the prior studies regarding evaluation of risk tool were. cross-sectional study (Al-Lawati, et al., 2007; Bindraban, et al., 2008; Cabrera de Leon, et al., 2008; Glumer, et al., 2004; Griffin, et al., 2000; Mohan, et al., 2005; Ramachandran, et al., 2005). Some studies evaluated risk scores for diabetes by using prospective cohort study (Aekplakorn, et al., 2006; Baan, et al., 1999; Balkau, et al., 2008; Hippisley-Cox, et al., 2009; Lindstrom, et al., 40.
(49) 2003; Schmidt, et al., 2005; Schulze, et al., 2007; Stern, et al., 2002; Wilson, et al., 2007). However, most of them developed for Caucasian, and only one for Thai population. Furthermore, none of these studies developed an applicable screening tool to predict incidence of abnormal glycemia in Chinese population. In the current study, we evaluated the predictive performance of ADART based on questionnaires for pre-diabetes and diabetes in a prospective cohort study in Taiwan. The prospective validation of ADART, including age, diabetes in parents or siblings, BMI, physical activity, known history of hypertension, gestational diabetes history, obesity, etc., showed a good performance for predicting 3-year incidence of pre-diabetes and diabetes especially in females. After taking additional demographic factors, lifestyle behaviors, physiological and biomarkers into account, the both differences in AUCs were not significant in male and in female among these three ROC curves (Table 8). Especially when biomarkers added into model with ADART only, it didn’t improve the prediction for 3-year incidence both in male and female (p=0.1497 and 0.8732, respectively). In additional analysis, we compared the model with ADART only to the model with FPG only in male (AUC=0.601 for ADART only vs. 0.6641 for FPG only, p=0.1121), and in female (AUC=0.715 for ADART only vs. 0.6824 for FPG only, p=0.4326). The model with ADART plus FPG and lifestyle behavior of family history of hyperlipidemia for predicting 3-years incidence of pre-diabetes or diabetes is significant better than that with ADART only in male (p=0.0003 ). In female, the model with ADART plus FPG and lifestyle behaviors of education attainment≤9years and TV watching 41.
(50) time ≥25 hrs/week for predicting 3-years incidence of pre-diabetes or diabetes is significant better than that with ADART only in female (p=0.0025). Similarly, when we combined FPG and ADART, this model performed much better than that with ADART only both in male (AUC=0.697 vs. 0.601, p=0.0005) and in female (AUC=0.759 vs. 0.715, p=0.0096). ADART revealed applicable prediction for screening as compared these three models, and there was no significant difference between them. ADART plus biomarkers didn’t improved the prediction for 3-year incidence of pre-diabetes or diabetes compared with this screening tool only. Hence it indicates that ADART alone can be apply to general population for screening pre-diabetes or diabetes. Considering the predictive ability of ADART for development of pre-diabetes or diabetes, this tool can be used in clinical practice and popularize to community to assist medical decision-making when caring for people, and to counsel people regarding the likely course of their potential disease. Particularly, the early lifestyle interventions and counseling can be implemented to reduce the risk of the disease. A screening program with blood test did not performed better than the simple risk tool both in men, and women, although ADART was developed to white and black populations. However, this risk assessment tool performs well in Taiwanese population. This might be because the lifestyle behaviors in our population are westernized and become similar to those in Western countries.. 42.
(51) 5.3 Comparing the ability of ADART with other screening tools in diagnosing with pre-diabetes or diabetes. We validated the predictive performance of current available screening tools based on sociodemographic characteristics and laboratory tests for pre-diabetes or diabetes in our longitudinal study in a representative sample of Taichung population in Taiwan. The predictive performance of these tools among Taiwanese was worse than to those in other ethnic populations. These screening tools were similar in that they all adopted age, obesity, and history of diabetes, however, they considered unique variables, such as steroid, daily consumption of vegetables, fruits, or berries, intake of red meat, whole-grain bread, consumption of coffee, moderate alcohol consumption, biking, or gardening, gestational diabetes, resting heart rate, and Townsend deprivation score. The AUCs of these 16 screening tools were smaller that of ADART. However, these tools had less number of variables than that of ADART. Only the tool developed by Bindraban in male and the tool developed by Schulze in female have the same number of variables as ADART (Table 10). In order to evaluate whether ADART performed better was due to greater number of variables, we excluded those variables with p value greater than 0.5. In male, after dropping BMI≥25, family history of diabetes, and light physical activity, the AUC of this reduced model is similar to that of the model with all variables of ADART (AUC: 0.601 vs. 0.600, p=0.9907). In female, after dropping high blood pressure, history of vascular disease, and polycystic ovary syndrome, the AUC of this reduced model is similar to that of the model all with variables of ADART (AUC:0.712 vs. 0.715, p=0.7321). Some variables of these tools were not included in the analyses because 43.
(52) of the lack of prescribed steroid (Griffin, et al., 2000; Hippisley-Cox, et al., 2009), daily consumption of berries (Lindstrom, et al., 2003), intake of red meat and whole-grain bread (Schulze, et al., 2007), consumption of coffee (Schulze, et al., 2007), moderate alcohol consumption (Schulze, et al., 2007), biking (Schulze, et al., 2007), gardening (Schulze, et al., 2007), and Townsend deprivation score in our study (Hippisley-Cox, et al., 2009). In order to understand how these screening tools would perform in our study sample, we represent the sensitivity and specificity calculated in original and in our study (Table 11). The AUCs in our sample were all smaller than those in the original study. The sensitivity estimates in our study were better than those of some original studies (Al-Lawati, et al., 2007; Griffin, et al., 2000; Lindstrom, et al., 2003; Mohan, et al., 2005; Schmidt, et al., 2005). The only tool with specificity estimates in this current study was better than that in their original study was the tool developed by Ramachandran. There were 4 possible explanations that these tools did not perform well in our study sample. First, these tools were not suitable for Chinese population. Second, these tools were developed for screening diabetes and they had limited ability in discriminating individuals with and without pre-diabetes or diabetes. Third, some of these tools were developed under cross-sectional study and they were not suitable for prediction of disease incidence. Last, some variables of these tools not measured in our study were not considered. Thus, the prediction ability of these tools lessened.. 44.
(53) Table 10—Comparing the AUCs of ADART with the other instruments published in literature screening tools Tool Baan PM1 PM2 Griffin Stern Lindström 1987 cohort 1992 cohort Glümer inter99-1 inter99-2 ADDITION Mohan Ramachandran cohort1 cohort2 cohort3 cohort4 Schmidt Aekplakorn Lawati Oman Nizwa Schulze Potsdam Heidelberg TÜF MeSyBePo León male female Wilson. No of item. 4 6 7-1 8-1 7. AUC (95%CI) Original population. Taichung City. 0.68 (0.64-0.72) 0.74 (0.70-0.78) 0.80 (0.68-0.91) 0.84 (0.82-0.87). 0.59 (0.55-0.64) 0.63 (0.58-0.67) 0.62 (0.58-0.66) 0.66 (0.62,0.70) 0.58 (0.53,0.62). 0.85 0.87 6. 4 5. 9-1 6 5. 0.61 (0.57,0.65) 0.80 (0.77-0.84) 0.76 (0.72-0.80) 0.80 (0.72-0.88) 0.70 (0.66-0.73) 0.73 (0.70-0.76) 0.70 (0.67-0.73) 0.73 (0.70-0.77) 0.67 (0.61-0.72) 0.80 0.74 (0.71-0.78). 0.53 (0.48,0.57) 0.58 (0.53,0.62). 0.69 (0.65,0.73) 0.60 (0.56,0.65) 0.58 (0.53,0.62). 0.83 (0.82-0.84) 0.76 (0.74-0.79) 11-2. 0.62 (0.57,0.66) 0.84 0.82 0.83 0.75. 4 5 6-1. 0.84 (0.80-0.87) 0.87 (0.85-0.90) 0.85. 45. 0.57 (0.51-0.63) 0.64 (0.58-0.70) 0.59 (0.55-0.64).
(54) Table 10—Comparing the AUCs of ADART with the other instruments published in literature screening tools (continued) Tool Balkau male female Bindraban Hindustani African Dutch Cox male female. No of item. AUC (95%CI) Original population. Taichung City. 0.71 0.83. 0.50 (0.44,0.56) 0.64 (0.59,0.70) 0.59 (0.54,0.63). 3 3 8. 0.58 (0.49-0.70) 0.79 (0.70-0.89) 0.77 (0.68-0.85) 10 0.83 0.85. 46. 0.52(0.46-0.59) 0.67(0.61-0.73).
(55) Table 11—Comparing the sensitivity, and specificity of ADART with the other instruments published in literature screening tools Tool. sensitivity (95% CI). No of. specificity (95% CI). original. Taichung. original. Taichung. item Baan PM1. 4. 0.78. 0.64 (0.60-0.68). 0.55. 0.50 (0.46-0.55). PM2. 6. 0.72. 0.68. 0.55. 0.51. Griffin. 7-1†. 0.77. 0.84 (0.81-0.86). 0.72. 0.36 (0.31-0.42). Stern. 8-1. —. 0.58 (0.53-0.63). —. 0.66 (0.63-0.70). Lindström. 7. †. 0.84 (0.81-0.87). 0.27 (0.22-0.33). 1987 cohort. 0.78 (0.71-0.84). 0.77 (0.76-0.79). 1992 cohort. 0.81 (0.69-0.89). 0.76 (0.74-0.77). Glümer. 6. 0.66 (0.62-0.70). 0.52 (0.47-0.56). inter99-1. 0.73 (0.66-0.81). 0.74 (0.73-0.76). inter99-2. 0.67 (0.58-0.75). 0.74 (0.72-0.75). addition. 0.76 (0.58-0.90). 0.72 (0.69-0.75). Mohan. 4. 0.73. Ramachandran 5. 0.92 (0.90-0.93). 0.60. 0.47 (0.42-0.52). 0.64 (0.60-0.67). cohort1. 0.77 (0.71-0.82). 0.60 (0.59-0.61). cohort2. 0.72 (0.66-0.78). 0.59 (0.58-0.60). cohort3. 0.74 (0.66-0.81). 0.61 (0.59-0.63). 0.92 (0.85-0.96). 0.26 (0.22-0.30). cohort4 Schmidt. 9-1. Aekplakorn. 6. Lawati. 5. †. 0.77 (0.73-0.80). 0.79 (0.75-0.82). 0.67 (0.66-0.68). 0.52 (0.47-0.56). 0.77. 0.62 (0.58-0.66). 0.60. 0.54 (0.50-0.58). 0.80 (0.77-0.83). 0.33 (0.28-0.39). Oman. 0.79 (0.75-0.82). 0.73 (0.72-0.75). Nizwa. 0.63 (0.54-0.71). 0.78 (0.76-0.80). Schulze. 0.13 (0.08-0.20). 11-2†. 0.82 (0.79-0.85). 0.39 (0.34-0.44). Potsdam. 0.94. 0.67. Heidelberg. 0.80. 0.79. TÜF. 0.83. 0.72. MeSyBePo. 0.94. 0.43. León male. 4. 0.94. 0.74 (0.70-0.77). 0.51. 0.44 (0.39-0.49). female. 5. 0.97. 0.85 (0.82-0.87). 0.48. 0.39 (0.34-0.44). —. 0.54 (0.50-0.59). —. 0.60 (0.55-0.63). Wilson. 6-1†. 47.
(56) Table 11—Comparing the AUCs, sensitivity, and specificity of ADART with the other instruments published in literature screening tools (continued) Tool. No of. sensitivity (95% CI). specificity (95% CI). original. Taichung. original. Taichung. item Balkau male. 3. —. 0.82 (0.79-0.85). —. 0.21 (0.16-0.27). female. 3. —. 0.67 (0.62-0.71). —. 0.57 (0.53-0.61). Bindraban. 8. 0.40 (0.35-0.46). 0.72 (0.68-0.75). Hindustani. 0.94. —. African. 0.88. —. Dutch. 0.64. —. Cox. —. 0.89 (0.86-0.91). —. 0.26 (0.21-0.32). †. : due to variables not available in the current study, one or two items were not considered in the calculation of sensitivity and specificity.. -: the estimate of sensitivity or specificity is not available in the original study.. 48.
數據
相關文件
• To achieve small expected risk, that is good generalization performance ⇒ both the empirical risk and the ratio between VC dimension and the number of data points have to be small..
This study proposed the Minimum Risk Neural Network (MRNN), which is based on back-propagation network (BPN) and combined with the concept of maximization of classification margin
This study aimed to establish the strength models of High-Performance Concrete (HPC) using Nonlinear Regression Analysis (NLRA), Back-Propagation Networks (BPN) and
This study aimed to explore the effectiveness of the classroom management of the homeroom teacher by analyzing the process of the formation of the classroom management and
Research of the actual construction project with the BIM modeling software tools, correct in identifying the building model , fitting-out works by trying to
This study aimed to establish the strength models of High-Performance Concrete (HPC) at different ranges of water binder ratio (W/B) using Genetic Operation Trees (GOT),
The objective is to evaluate the impact of personalities balance in a project management team on the team’s performance.. To verify the effectiveness of this model, two
The purpose of this study was to explore the effects of learning organization culture on teachers’ study and teaching potency in Public Elementary Schools.. The research tool of
