國立交通大學
環境工程研究所
碩士論文
結合部分硝化與厭氧氨氧化程序於處理高氮光電廢水之應用
Application of simultaneous partial nitrification and Anammox
Process for treatment of high strength nitrogen containing
opto-electronic wastewater
研究生:蘇信翰
指導教授:林志高 教授
結合部分硝化與厭氧氨氧化程序於處理高氮光電廢水之應用
Application of simultaneous partial nitrification and Anammox Process for
treatment of high strength nitrogen containing opto-electronic wastewater
研 究 生:蘇信翰 Student: Sin-Han Su
指導教授:林志高 Advisor: Jih-Gaw Lin
國立交通大學
環境工程研究所
碩士論文
A Thesis
Submitted to the Institute of Environmental Engineering College of Engineering
National Chiao Tung University in partial Fulfillment of the Requirements
for the Degree of Master
in
Environmental Engineering June, 2012
Hsinchu, Taiwan, Republic of China
中文摘要
本研究將部分硝化與厭氧氨氧化程序結合於單一反應槽內並針對處理兩股含有高 濃度氮氮之光電廢水進行探討。此兩股光電廢水之主要特性略有不同,其分別為 僅具有高濃度氨氮 (WW1) 與碳氮比為 0.2 (WW2) 之廢水。為強化培養厭氧氨氧 化菌之生長本研究於進流廢水中添加營養鹽與微量元素。WW1 與 WW2 分別以 18 L 與 2.5 L 的序批次反應槽 (SBR-18 & SBR-2.5) 進行處理,並在 16 個月的實驗 期間逐漸提升氮負荷。實驗結果顯示於 SBR-18 反應槽的最後階段總氮負荷最高可 達到 909 g -N m-3 d-1且平均總氮去除效率可達 90% 並持續維持 1 個月。而在 SBR-2.5 反應槽中的最後階段,總氮負荷與 COD 負荷最高分別可達到 428 g-N m-3 d-1與 89 g-COD m-3 d-1且平均總氮去除效率與 COD 去除效率分別可達 93% 與 79%。最後藉由聚合酵素鏈鎖反應 (PCR) 之菌相鑑定進一步證實了 SBR 內共同存 在了氨氧化菌與厭氧氨氧化菌且 Candidatus Kuenenia stuttgartiensis 為主要菌種之 一。ABSTRACT
Treatment of two optoelectronic industrial wastewaters (wastewater containing high ammonium concentration (WW1) and wastewater with C/N ratio of 0.2 (WW2)) were achieved using partial nitrification and Anammox processes in a single reactors. 18 L and 2.5 L lab scale sequencing batch reactors (SBR) were used to treat WW1 and WW2, respectively. Essential nutrients and trace elements were added in the influent wastewaters to support the Anammox growth. 18 L SBR (SBR-18) and 2.5 L SBR (SBR-2.5) were run for over 16 months in different stages. Nitrogen loading rate (NLR) was gradually increased from 10 g-N m-3 d-1 to 909 g-N m-3 d-1 and 16 g-N m-3 d-1 to 230 g-N m-3 d-1 in SBR-18 and SBR-2.5, respectively.
The SBR-18 was successfully run about 1 month (7 times of HRT) to treat WW1 without dilution i.e NLR of 0.9 g-N m-3 d-1. The average TN removal was 90% in the high NLR in SBR-18. In the case of SBR-2.5, the system successfully treated 89 g-COD m-3 d-1 and 428 g g-N m-3 d-1, respectively, with 79% and 93% of COD and TN removal efficiencies in later stages. Presence of ammonia oxidizing bacteria (AOB) and Anammox bacteria were confirmed by polymerase chain reaction (PCR) in the SBRs. PCR results also indicated that Candidatus Kuenenia stuttgartiensis was one of the dominant species in both SBRs.
誌謝
本論文得以完成首先要感謝指導教授林志高博士的悉 心 指 導 以 及 Achlesh Daverey 博 士 在 論 文 的 寫 作 上 與 研 究 上 給 與 莫 大 的 鼓 勵 與 支 持。此 外,特 別 感 謝 黃 郁 慈 博 士、宋 士 武 博 士、顧 繼 東 博 士 在 本 論 文 中 給 予 寶 貴 的 意 見 以 及 幫 助 , 使 論 文 得 以 順 利 的 完 成 , 於 此 表 達 無 限 的 謝 意 與 感 激 。 在 論 文 研 究 歷 程 中,特 別 感 謝 實 驗 室 的 至 誠 學 長 與 里安學長時常分享寶 貴的經驗,另外也謝謝彥均學長、茜茹學姐、維綸學長、怡君學姐與佩芸學姐以 及同窗好友南維同學和學弟妹們毅謙、瑛章、佳珊、銘益、念慈在求學期間給予 協助與鼓勵並一同分享生活中的喜怒哀樂使得研究生涯更添樂趣。 最後要謝謝我的父親以及母親在我求學期間給予我最大的支持與關懷,讓我 可以全力的完成論文。謹將此論文獻給我的家人及所有幫助過我的老師和朋友。CONTENTS
中文摘要 ...i
ABSTRACT ... ii
誌謝 ... iii
CONTENTS ...iv
LIST OF TABLES ...vi
LIST OF FIGURES ... vii
Chapter 1 Introduction ... 1
Chapter 2 Literature review ... 3
2.1 Nitrogen cycle ... 3
2.2 Biological Nitrogen removal processes ... 7
2.2.1 Conventional Nitrification-Denitrification ... 7
2.2.2 Innovation technology – Anammox (ANaerobic AMMonium OXidation) ... 8
2.2.3 Single reactor High activity Ammonia Removal over Nitrite (SHARON) ... 13
2.2.4 The combination of partial nitrification and Anammox in single reactor ... 14
Chapter 3 Materials and methods ... 16
3.1 Sequencing batch reactor with carriers (SBR-18) for treating ammonium-rich wastewater... 16
3.1.1 Seed sludge and feeding media used in SBR-18 ... 16
3.1.2 Experimental set-up and reactor system ... 18
3.2 Sequencing batch reactor (SBR-2.5) for treating the wastewater with low
C/N ratio ... 22
3.2.1 Seed sludge and feeding media for SBR-2.5 ... 22
3.2.1 Experimental set-up and reactor system ... 24
3.2.2 Measurements in SBR-2.5 ... 26
3.3 Analytical methods ... 27
3.4 Biological activity analyses ... 28
3.4.1 Specific Anammox activity (SAA) test ... 28
3.4.2 Nitrate Uptake Rate (NUR) test ... 30
3.5 Polymerase chain reaction (PCR) ... 30
Chapter 4 Results and Discussion ... 32
4.1 Sequencing batch reactor with carriers (SBR-18) for treating ammonium-rich wastewater 32 4.1.1 Characteristics of opto-electronic industrial wastewater ... 32
4.1.2 Nitrogen removal performance ... 32
4.1.3 Results from PCR ... 42
4.2 Sequencing batch reactor (SBR-2.5) for treating the wastewater with low C/N ratio ... 45
4.2.1 Nitrogen removal performance ... 46
4.2.1 Operational parameters for pH, Alkalinity, MLSS and MLVSS ... 55
4.2.2 COD removal from opto-electronic industrial wastewater ... 57
4.2.1 Result from NUR ... 59
4.2.2 Results from PCR ... 60
Chapter 5 Conclusion ... 62
LIST OF TABLES
Table 1 A list of currently sequenced microbial genomes with nitrogen cycle pathways
(Rick and Stuart., 2001) ... 3
Table 2 the major anthropogenic sources of nitrogen in aquatic ecosystems (Camargo and Alonso, 2006) ... 6
Table 3 Physiology of Anammox ... 9
Table 4 Inhibitor factors for Anammox ... 11
Table 5 Conversions for partial nitrification / Anammox process in single reactor ... 15
Table 6 Main characteristics of raw opto-electronic wastewater (WW1) ... 17
Table 7 Compositions of mineral medium and trace elements supplemented to WW1 & WW2 ... 18
Table 8 Operating parameters at different stages in the SBR ... 21
Table 9 Main characteristics of raw opto-electronic wastewater (WW2) ... 23
Table 10 Operating parameters at different stages in the SBR-2.5 ... 26
Table 11 Water quality analytical method ... 27
Table 12 Summary functional indicators of SBR-2.5 ... 50
Table 13 the metal ions (Ca, Mg, Fe) in WW1 ... 52
Table 14 Different medium compounds (Ca, Mg, Fe) using in stage VIII ... 52
LIST OF FIGURES
Figure 1 Human activity changing in nitrogen cycle (Pidwirny., 2006) ... 5
Figure 2 Human activites have increased the production of reactive nitrogen (Galloway and Cowling, 2002). ... 6
Figure 3 Configuration of SBR-18 ... 19
Figure 4 Operated cycle of SBR-18. ... 20
Figure 5 Configuration of SBR-2.5 ... 25
Figure 6 Profile of dissolved oxygen in SBR-18 during stage I. ... 34
Figure 7 Profiles of nitrogen compounds in influent and effluent, and nitrogen removal efficiencies in stage I of SBR-18. ... 35
Figure 8 The temporal variation of conversion efficiency ( 3 4 -2 NO ) NH NO ( Y ) during stage I of SBR-18. ... 35
Figure 9 Time profiles of pH and alkalinity in effluent during stage 1 of SBR-18. ... 36
Figure 10 Profiles of nitrogen compounds in influent and effluent, and nitrogen removal efficiencies in stage II of SBR-18. ... 37
Figure 11 The temporal variation of conversion efficiency ( (NO2-NO3)NH4 Y ) during stage II of SBR-18. ... 37
Figure 12 Time profiles of pH and alkalinity in effluent during stage II of SBR-18. ... 38
Figure 13 Profiles of nitrogen compounds in influent and effluent, and nitrogen removal efficiencies in stage III of SBR-18. ... 39
Figure 14 Time profiles of pH and alkalinity in effluent during stage III of SBR-18. .... 40
Figure 15 Profiles of nitrogen compounds in influent and effluent, and nitrogen removal efficiencies in stage IV of SBR-18. ... 41
Figure 17 Profiles of MLSS and MLVSS in SBR-18. ... 42 Figure 18 Results of PCR by performing agarose gel electrophoreses. The sample was taken on day 229 from SBR-18. ... 43 Figure 19 Results of PCR by performing agarose gel electrophoreses. The sample was taken on day 305 from SBR-18. ... 43 Figure 20 Results of PCR by performing agarose gel electrophoreses. The sample was taken on day 487 from SBR-18. ... 44 Figure 21 Profiles of nitrogen compounds in influent and effluent, and nitrogen removal efficiencies during stage I-VI of SBR-2.5. ... 47 Figure 22 Profile of dissolved oxygen in SBR-18 during stage I-VI. ... 48 Figure 23 The temporal variation of conversion efficiency ( 3 4
-2 NO )NH NO ( Y ) during stage I-VI of SBR-2.5. ... 48 Figure 24 Sludge in SBR 2.5 at day 497. ... 50 Figure 25 Profiles of nitrogen compounds in influent and effluent, and nitrogen removal efficiencies during stage VI-VIII of SBR-2.5. ... 53 Figure 26 Activity of Anammox bacteria in sludge ... 54 Figure 27 Profiles of Nitrogen volumetric removal capacity (NVRC) during day 465-497 of SBR-2.5. ... 54 Figure 28 pH and Alkalinity concentration in effluent ... 56 Figure 29 Profiles of MLSS and MLVSS during stage VI-VIII of SBR-2.5. ... 57 Figure 30 Profiles of COD in influent and effluent, and COD removal during stage I-VI of SBR-2.5. ... 58 Figure 31 Profiles of COD in influent and effluent, and COD removal during stage VI-VIII of SBR-2.5. ... 59
Figure 32 Consumption of COD and nitrate by denitrifiers present in the sludge of SBR-2.5. ... 60 Figure 33 the PCR results at day 229 ... 61
Chapter 1
Introduction
In recent years, the booming in semiconductor and opto-electronic industry has made Taiwan a huge economic growth. However, a number of optoelectronic industries, such as LED (Light-emitting diode) manufacturing plants, produced ammonium-rich wastewater in manufacturing processes.
Under the fast development of high technology industry, the impact of nitrogen pollution discharge brought to the environment has become an important issue. For example, the release of untreated wastewater can result in eutrophication of the receiving water bodies. Along with growing environment awareness, the EPA in Taiwan strives to set stringent standard regulations to control the emissions of nitrogen compounds to the surface waters. For example, an established opto-electronic industry should reduce the discharge limit of ammonium concentration in wastewater to 75 mg/L by July 1, 2012 and 30 mg/L by July 1, 2015.
Conventionally, biological nitrogen removal is achieved by nitrification followed by denitrification process in two separate reactors. In this process, first ammonia is oxidized to nitrite (NO2-) and then nitrate (NO3-) by autotrophic nitrifiers with oxygen
as the electron acceptor in aerobic condition, then NO2- or NO3- converted to gaseous N2
by heterotrophic microorganisms using organic matter as carbon source in anoxic condition. However, conventional nitrification and denitrification process needs an amount of biodegradable and inorganic carbonate source. High energy consumption is another disadvantage of this process. Therefore, the concept of nitrogen removal model has been changed since the confirmation of the anaerobic ammonium oxidation (Anammox) process [1], which is an autotrophic oxidation process and converts ammonia to N2 using nitrite as the electron acceptor. Moreover, Anammox reaction is
recognized as a cost-effective and sustainable technology for biological nitrogen removal [2].
In this study, Anammox reaction was used as a main reaction for nitrogen removal. The combination of partial nitrification which control further oxidation of NO2- to NO3- with
Anammox in single reactor can provide enough NO2- for Anammox, which uses nitrite
as the electron acceptor.
The objectives of this study were (i) Development of partial nitrification/Anammox process in sequencing batch reactor for treating opto-electronic wastewater containing high ammonium concentration. (ii) Evaluation of process performance by chemical analyses of water quality, monitoring of condition parameter and biomass measurements. (iii) Assessment of polyvalent ions effect on the growth of Anammox bacteria by monitoring the Anammox activity through SAA (specific Anammox activity) tests.
Chapter 2
Literature review
2.1
Nitrogen cycle
Nitrogen is constituted 79% by volume of Earth’s atmosphere. And it is essential to all organisms, for example nitrogen is used by organisms to produce amino acids, proteins and nucleic acids. However, nitrogen in the atmosphere cannot be used directly by either plants or animals. It must be transformed into other nitrogen species by microorganism. The nitrogen species existed in terrestrial and aquatic ecosystems include N2, NH3, NH4+, NO2-, NO3- and organic nitrogen. The transformation of these
nitrogen species consisted of several mechanisms including nitrogen fixation, assimilation, ammonification, nitrification and denitrification. These mechanisms related to specific microorganism. Table 1 shows the part of microorganism responsible for these mechanisms.
Table 1 A list of currently sequenced microbial genomes with nitrogen cycle pathways [3]
Species Pathways or enzymes
Nitrosomonas europaea Ammonia oxidation
Dissmilatory nitrite and nitric oxide reductases
Methylomonas sp. 16a Ammonia oxidation
Dissimilatory nitrite and nitric oxide reductases
Neisseria menigitidis Dissimilatory nitrite and nitric oxide reductases
Synechocystis sp. PCC6803 Cytochrome b nitric oxide reductase
Bacillus subtilis strain 168 Dissimilatory nitrate reduction to ammonia
Pseudomonas aeruginosa PAO Denitrification
Rhodobacter sphaeroides Denitrification Nitrogen fixation
Paracoccus denitrificans ATCC 19367 Denitrification
Heterotrophic nitrification
P. denitrificans strain SANVA100 Denitrification
Azoarcus tolulyticus Tol-4 Denitrification
Nitrogen Fixation
Nitrogen fixation is the reaction, which converts the N2 to nitrogen compound for plants
or animals used. And it includes biological, abiotic, or synthetic way. For example, biological way such as bean family (legumes), abiotic way such as lighting strikes and synthetic way such as anthropogenic activities.
Assimilation
Plants absorb nitrogen compound (i.e. NH4+and NO3-) from soils through their roots to
synthesize vegetable proteins.
Ammonification
Ammonification is the reaction, which decompose organic nitrogen compound back to ammonium nitrogen. For example, when plants or animals dies, or animals expel waste, the abiotic organic nitrogen compounds convert or decompose by bacteria into ammonium.
Nitrification
Nitrification includes both ammonium oxidation reaction and nitrite oxidation reaction. The oxidation of ammonium to nitrite is performed by ammonium oxidizing bacteria (AOB) such as the Nitrosomonas, Nitrosospira, Nitrosovibrio and Nitrosococcus. And the oxidation of nitrite to nitrate is responsible by nitrite oxidizing bacteria (NOB) such as Nitrobacter and Nitrococcus.
Denitrification
Denitrification is the reaction which convert nitrate back to gaseous N2. This process is
Figure 1 Human activity changing in nitrogen cycle [4]
The nitrogen cycle is a combination of several biological and non-biological processes as shown in Figure 1. However, the growing human population has gradually increased demand for food, energy and essential requirements. With these demands have increased the amount of reactive nitrogen, the primary processes were developed in the past century to convert unreactive nitrogen to reactive nitrogen. These primary processes including combustion of fossil fuels and planting of nitrogen-harnessing croplands resulted in the large acceleration of nitrogen cycle (Figure 2). Furthermore, the excess reactive nitrogen in the environment can lead to pollution. For example, the discharge of ammonium wastewater from anthropogenic activities resulted in the eutrophication of lakes and river. There are some major anthropogenic sources of nitrogenous pollutants enter aquatic ecosystems through point and nonpoint sources originated from human activites described inTable 2.
Figure 2 Human activites have increased the production of reactive nitrogen [5]
Table 2 the major anthropogenic sources of nitrogen in aquatic ecosystems [6] Point sources
- Wastewaters from livestock (cattle, pig, chickends) farming - N releases from aquaculture (fish,shrimps, spawns) operations
- Municipal sewage effluent (including effluent from sweage treatment plants without tertiary treatments in their facilities)
- Industrial wastewater discharges
- Runoff and infliltration from waste disposal sites
- Runoff from operational mines, oil fields, and industrial sites lacking sewage installations
Nonpoint sources
- Widespread cultivation of N2-fixing crops species, and subsequent N
moblisation
- N loadings to groundwater, ans subsequently, to receving surface water bodies (rivers, lakes, coastal zones)
-Urban runoff from sewered and unsewered areas - Septic leachate and runoff from septic systems - Runoff from burned forests and grasslands
- Other activities contributing to N mobilization (from long-term storage pools) such as biomass burning, land clearing and conversion, and wetland Drainage
2.2
Biological Nitrogen removal processes
2.2.1 Conventional Nitrification-Denitrification
Conventional biological nitrogen removal process is achieved by nitrification followed by denitrification process in two separate reactors. Nitrification is performed by two-step oxidative stages. First ammonium is converted to nitrite with oxygen as the electron acceptor by ammonia oxidizing bacteria (AOB) in aerobic conditions (Eq. 2.1). The most commonly recognized genus of bacteria for ammonium oxidation is
Nitrosomonas, Nitrosopira, Nitrosovibrio and Nitrosolobus. In the second stage, nitrite
is converted to nitrate by nitrite oxidizing bacteria (NOB) (Eq. 2.2). The most commonly recognized genus of bacteria for ammonium oxidation is Nitrobactor,
Nitrospira, Nitrospina, Nitrococcus and Nitrocystis. The overall equation for
inorganic carbon as a carbon source [7]. Nitration [8]: 4 2 3 5 7 2 2 2 2 3 55NH 76O 109HCO C H O N54NO 57H O104H CO (2.1) Nitration [8]: - - -2 4 2 2 3 3 5 7 2 2 3
400NO NH 195O 4H CO HCO C H O N 3H O 400NO (2.2) Nitrification (2.1+2.2)
4 1.83 2 1.98 3 0.021 5 7 2 0.98 3 1.041 2 1.88 2 3
NH O HCO C H O N NO H O H CO (2.3)
During the subsequent denitrification process, nitrite (NO2-) and nitrate (NO3-) are
converted to dinitrogen gas. Most of denitrification is performed in anaerobic (or anoxic) condition by heterotrophic denitrifying bacteria. The species of denitrifying bacteria are very wide and the available organic sources for denitrifying are also very wide. The genus of denitrifying includes Alcaligenes, Pseudomonas, Paracoccus, Thiobacillus,
Bacillus or Propionibacterium and so on [9]. The equation for denitrification using
methanol as carbon source is shown in Eq. 2.4. Denitrification [8]:
-
-3 3 2 3 2 5 7 2 2 3
NO 1.08CH OH 0.24H CO 0.47N 0.056C H O N 1.68H O HCO (2.4) The Nitrification-Denitrification process is used to treat the wastewater containing COD and ammonium nitrogen. When the COD is insufficient in wastewater for Denitrification process, the additional organic carbon should be dosed. Choi et al. indicated that a C/N ratio over 7 is required for nitrogen removal (above 89%) in intermittently aerated MBR system [10]. Therefore, considering with the operational cost, the Nitrification-Denitrification process is not suitable for treating the wastewater with low C/N ratio.
OXidation)
In 1977, based on thermodynamic calculations, Broda predict the biochemical reaction that the existence of chemolithotrophic bacteria able to oxidize ammonium to dinitrogen gas with nitrate [11]. However, there microorganisms has never been demonstrated in following decade. Until 1995, Mulder et al. found that ammonium and nitrate disappeared at the same time in the fluidized bed reactor which was treating bakery yeast wastewater effluent in the Netherland [1]. This discovery demonstrated the assumption by Broda was correct and the presence of this kind of microorganisms in nature. This novel reaction was named anaerobic ammonium oxidation (Anammox). Initially, Anammox bacteria were considered that nitrate is used as electron acceptor and the stoichiometry of Anammox reaction is shown below (Eq. 2.5). Afterward this stoichiometry has been modified by van de Graff et al. at 1995. The electron acceptor of the Anammox process is nitrite not nitrate and Anammox organisms grow with CO2 as
the carbon source [12] [13]. Subsequently, Strous et al. further formulated the stoichiometry of Anammox reaction (Eq. 2.6) using a sequencing batch reactor (SBR) based on the mass balance [14]. The advantage of the SBR for enriching Anammox bacteria is the efficient retention of sludge. By using an SBR, several important physiological parameters have been determined as Table 3 shown [14]. Compare Anammox with Nitrification, the growth rate of Anammox is really low and the doubling time of Anammox is fifteen times than Nitrification [15]
Table 3 Physiology of Anammox
4 3 2 2
5NH 3NO 4N 9H O 2H (2.5)
4 2 3 2 3 2 0.5 0.15 2
NH 1.32NO 0.066HCO0.13H 1.02N 0.26NO0.066 CH O N 2.03H O
(2.6) Furthermore, suitable operating conditions for growth of Anammox bacteria have been determined. For example, the optimum temperature for Anammox bacterial growth temperature is between 18-40 oC while the maximum activity was found at 35-40 oC [16]. The optimum range of pH is in between 6.7-8.3 [17]. The affinity of Anammox bacteria towards ammonium and nitrite are to or less 0.1 mg In addition, the potentially negative effects of the compounds present in the wastewater have been studied as summary in Table 4. One of the most critical aspects in the Anammox process stability is substrate. Ammonium and nitrite are nutrients for anammpx, but also potential inhibiting compounds for Anammox. Strous et al. indicated that Anammox is not inhibited by ammonium up to concentration of 980 mg/L [17] however other studies observed that concentrations of ammonium of 700 or 770 mg/L resulting in an activity loss of 50% [18][19]. Because of the coherent results, recently reasearchers consider free ammonia (FA), rather than ammonium, to be the true microbial substrate and inhibitor compound of Anammox [19][20]. Fernandez et al. further investigated the Biomass yield 0.066 mol C (mol ammonium)-1
Maximum specific ammonium consumption rate
45 nmol NH4+ (mg protein min)-1
Maximum specific growth rate 0.0027 h-1
long-term effects of FA on Anammox in SBR. The results showed a total loss of Anammox activity with long-term exposure to FA levels of 35-40 mg N/L but the performance can be recovered by reduced residual FA in effluent within 1 month [19]. Another inhibiting substrate for Anammox is nitrite. It has been considered that high concentration of nitrite inhibited Anammox activity [21]. The inhibition threshold concentrations of nitrite obtained from various studies were difference (Table 4). It may be attributable to differences in biomass characteristics (Anammox species) and experiment design (operational conditions). Basing on these results, the nitrite exposure concentration below to 80 mg/L was the security concentration for Anammox.
Table 4 Inhibitor factors for Anammox
Concentration Unit Effect Substrate Type Reference
NH4+-N
980 mg N/L No effect Synthetic Batch test [17] 770 mg N /L
-50 % activity
Synthetic Batch test [18]
700 mg N/L
-50 % activity
Synthetic Batch test [19]
FA (NH3-N)
38 mg N/L
-50 % activity
Synthetic Batch test [19]
20-25 mg N/L -25 % activity Synthetic SBR [19] 35-40 mg N/L -100 % activity Synthetic SBR [19] NO2--N 80 mg N/L -80 % activity Synthetic Fixed-bed reactor [22]
100 mg N/L
-100 % activity
Synthetic Batch test [17] 140 mg N/L -70% activity Synthetic Batch test [19] 280 mg N/L
-100 % activity
Synthetic Batch test [21]
350 mg N/L
-50 % activity
Synthetic Batch test [18]
NO3--N
980 mg N/L No effect Synthetic Batch test [17] 630 mg N/L
-50 % activity
Synthetic Batch test [18]
Chloride
50 mM No effect Synthetic Batch test [13] 200 mM -50% activity Synthetic Batch test [18] Phosphate 1 mM No effect Synthetic Batch test [13]
KH2PO4
5 or 50 mM
-100 % activity
Synthetic Batch test [13] 1 mM No effect Synthetic Batch test [13]
KHCO3
21 mM
-50 % activity
Synthetic Batch test [18] 20 or 40 mM No effect Synthetic Batch test [13]
Sulphide
1 or 5 mM
Increase activity
Synthetic Batch test [13]
0.3 mM
-50 % activity
2.2.3 Single reactor High activity Ammonia Removal over Nitrite
(SHARON)
The single reactor high activity ammonia removal over nitrite (SHARON) process, a technology, control further oxidation of NO2- to NO3- [23]. Compared with conventional
nitrification-denitrification processes, the advantage is needless oxidation of nitrite to nitrate results in the lower aeration cost and the dosage of organic carbon in denitrification process.
The strategies for controlling SHARON process include temperature, dissolved oxygen level, free ammonia (FA) concentration, pH and alkalinity. The maximum growth rate of AOB is higher than NOB at the operational temperature of 35C [23]. By controlling operational temperature at 35C and a proper sludge retention time, the AOB can retain in the reactor and NOB wash out. Because oxygen affinity of AOB is higher than NOB, the low dissolved oxygen level (0.4 mg/L) limits the growth of NOB [24]. The concentrations of free ammonia (FA) that inhibit AOB are greater than that inhibit NOB. The range of FA concentrations that begin to inhibit for AOB is 10-150 mg N/L while for NOB is 0.1-1 mg N/L [25]. Therefore keeping the higher influent ammonium concentration could inhibit NOB growth. Moreover, according to the chemical equilibrium of ammonium and ammonia in water the FA can increase by increasing the pH value (Eq.2.7 and Eq.2.8).
4 3 2 NH OH NH H O (2.7) 3 10 [ ] / 10 pH free pH a w TAN NH N K K (2.8)
where TAN is total ammoniacal nitrogen = ammonium + free ammonia Ka Kw = exp [6334 / (273+t)]
Ka is ionisation constant for ammonium (e.q., Ka at 20C = 10-9.24)
Kw is ionisation constant for water (e.q., Kw at 20C = 0.69 10-14)
t is temperature inC If the wastewater contains high ammonium and low COD, the combination of SHARON and Anammox is an appropriate system for ammonium removal. The first full-scale SHARON-Anammox reactor in the world was started in Rotterdam (NL). The effluent, a 50:50 mixture of NH4+ and NO2- from SHARON
reactor is used as a feed for following Anammox reactor [26].
2.2.4 The combination of partial nitrification and Anammox in single
reactor
The combination of partial nitrification and Anammox in a single reactor is also called several names such as CANON (Completely Autotrophic Nitrogen Removal over Nitrite) [27], [28], OLAND (Oxygen-Limited Autotrophic Nitrification – Denitrification) [29] and SNAP (Single-stage Nitrogen removal using Anammox and Partial nitrification) [30]. These operational condition and nitrogen removal modes are similar. The partial nitrification / Anammox process consist of AOB and anammox bacteria. When the presence of ammonium, AOB oxidize ammonium to nitrite, consume oxygen and so create anoxic conditions the anammox bacteria need. Compared with SHARON / Anammox in series, this process needs only one reactor. This implies that the less investment costs. The key for the successful partial nitrification / Anammox process is the suppression of nitrite oxidation and avoid high toxic nitrite. The
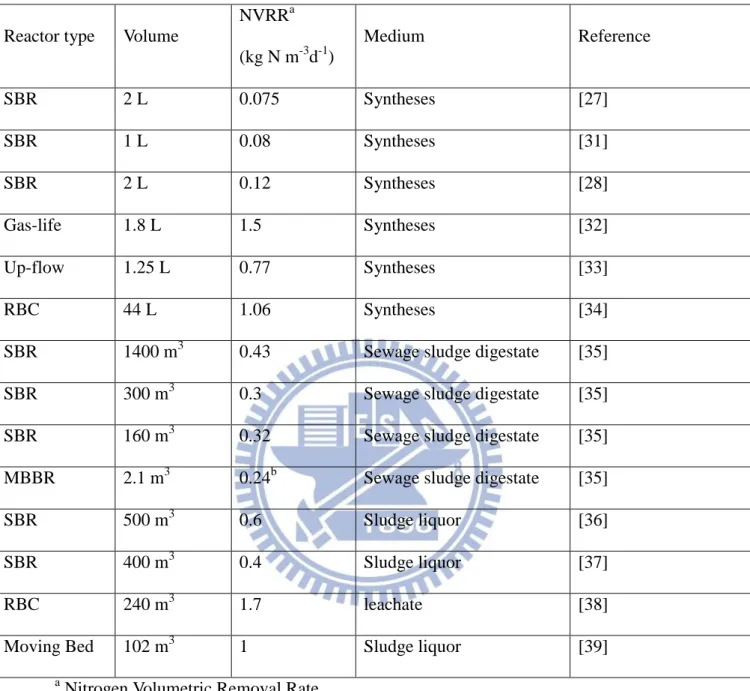
performances of partial nitrification / Anammox process in single reactor from various literatures are summaried in Table 5.
Table 5 Conversions for partial nitrification / Anammox process in single reactor Reactor type Volume
NVRRa (kg N m-3d-1) Medium Reference SBR 2 L 0.075 Syntheses [27] SBR 1 L 0.08 Syntheses [31] SBR 2 L 0.12 Syntheses [28] Gas-life 1.8 L 1.5 Syntheses [32] Up-flow 1.25 L 0.77 Syntheses [33] RBC 44 L 1.06 Syntheses [34]
SBR 1400 m3 0.43 Sewage sludge digestate [35] SBR 300 m3 0.3 Sewage sludge digestate [35] SBR 160 m3 0.32 Sewage sludge digestate [35] MBBR 2.1 m3 0.24b Sewage sludge digestate [35] SBR 500 m3 0.6 Sludge liquor [36] SBR 400 m3 0.4 Sludge liquor [37]
RBC 240 m3 1.7 leachate [38]
Moving Bed 102 m3 1 Sludge liquor [39]
a
Nitrogen Volumetric Removal Rate.
b
Chapter 3
Materials and methods
In this research work, two sequential batch reactors with working volume of 18 L and 2.5 L, respectively, were operated for treating two types of opto-electronic wastewater, from LED manufacturing plants located in Tainan, Taiwan. One of the wastewater only contains high ammonium (abbreviated as WW1), but the other wastewater contains both ammonium and COD with C/N ratio of ~0.2 (abbreviated as WW2). Studies on WW1 treatment were carried out in 18 L SBR (abbreviated as SBR-18), while studies on WW2 were carried out in 2.5 L SBR (abbreviated as SBR-2.5). Detail characteristics of opto-electronic wastewaters used in the study are given in below sections.
3.1
Sequencing batch reactor with carriers (SBR-18) for
treating ammonium-rich wastewater
In order to investigate the possible application of partial nitrification and Anammox process for treating ammonium rich opto-electronic wastewater, SBR-18 was used. The details of seed sludge and feeding media used, reactor configuration and modes of operation are given below.
3.1.1 Seed sludge and feeding media used in SBR-18
Seed sludge
The original sludge in the reactor were the same with our previous study [40], which is used to treat synthetic wastewater and reported to have Anammox bacteria, Nitrosomonas-like microorganisms and denitrifiers. The concentration of VSS in the reactor was 1370 mg/L at day 0. On day 94 the reactor was inoculated with new seed sludge collected from a full-scale landfill-leachate treatment plant in Taiwan, to
increased VSS concentration in the reactor up to 2800 mg/L. Anammox bacteria, nitrosomonas-like microorganisms and denitrifiers were reported in this landfill-leachate treatment plant sludge [41]. Furthermore, a part of biomass (16 g) from the reactor was discharged and 31 g of new seed sludge was introduced in to the reactor on day 306. The initial concentration of VSS after discharge and recharge biomass was 2589 mg/L.
Feeding media
The feeding wastewater (WW1) was collected from opto-electronic industry located at Tainan, Taiwan. The collected samples were stored in a refrigerator at 4C until used. WW1 was produced from the local scrubber where residual ammonia gas from etching process was washed. WW1 was characterized and its characteristics are shown in Table 6. As WW1 was originated from ultrapure water and pure chemicals, it was supplemented with mineral medium [27] as nutrients (Table 7). Moreover, the additional NaHCO3 was added to the wastewater for providing the inorganic carbon source which
Anammox and nitrifying bacteria needed in the lack of inorganic carbon condition. The pH of the wastewater was adjusted to 7.8-8.0 with HCl before introducing it to the reactor.
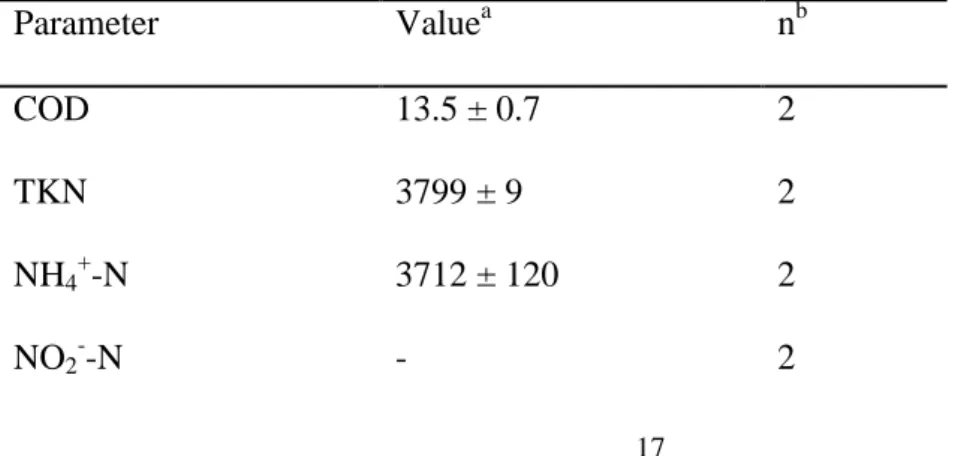
Table 6 Main characteristics of raw opto-electronic wastewater (WW1) Parameter Valuea nb
COD 13.5 ± 0.7 2
TKN 3799 ± 9 2
NH4+-N 3712 ± 120 2
NO3--N - 2
PO43--P - 2
pH 9.7±0.1 2
Alkalinity as CaCO3 5785±3341 2
a: all units are in mg/L, except pH
b: The number of times wastewater sample analyzed and collected from the industry Table 7 Compositions of mineral medium and trace elements supplemented to WW1 & WW2
Composition of mineral medium Composition of trace elements Component Concentrationa Component Concentrationa KH2PO4 25 EDTA 1500 CaCl2.2H2O 300 ZnSO4 7H2O 430 MgSO4 . 7H2O 200 CoCl2 6H2O 240 FeSO4 6.25 MnCl2 4H2O 990 EDTA 6.25 CuSO4 5H2O 250 KHCO3 1250 NaMoO4 2H2O 220
Trace element 1 ml/L NiCl2 2H2O 190
NaSeO4 10H2O 210
H3BO4 14
a: all units in the table are in mg/L, except trace element
3.1.2 Experimental set-up and reactor system
Reactor configuration
established for treating WW1 and the carrier of polyurethane spheres (diameter is 3 cm, total of 100) was employed as a bacterial support. Figure 3 shows the set-up of SBR-18 and the configuration of carriers. The carriers were stuffed in the bottom of the reactor at day 0. However, the reactor with carriers in the bottom had poor diffusion of sludge and nutrients. The poor diffusion will be a limiting factor for the reaction rate of bacteria at high loading rate condition. Therefore, the carriers were arranged in a hollow center of circle in the reactor on day 45 till the end of experiment.
Effluent port
P-2
pH, ORP DO
Influent
An overhead view of the carriers in the reactor
A carrier Air compressor
Water bath
Figure 3 Configuration of SBR-18
Operation strategy of SBR-18
SBR-18 was operated in cycles of 24 h. Each cycle consists of 23.4 h for feeding and reaction, 0.45 h for settling and 0.15 h for decanting as shown in Figure 4 . The feeding period was 12 h. The fed batch strategy was adopted in order to avoid a shock loading.
Filling
Reaction & Aeration
23.4 h 24 h 12 h
0 h
Settling & Decanting
Figure 4 Operated cycle of SBR-18.
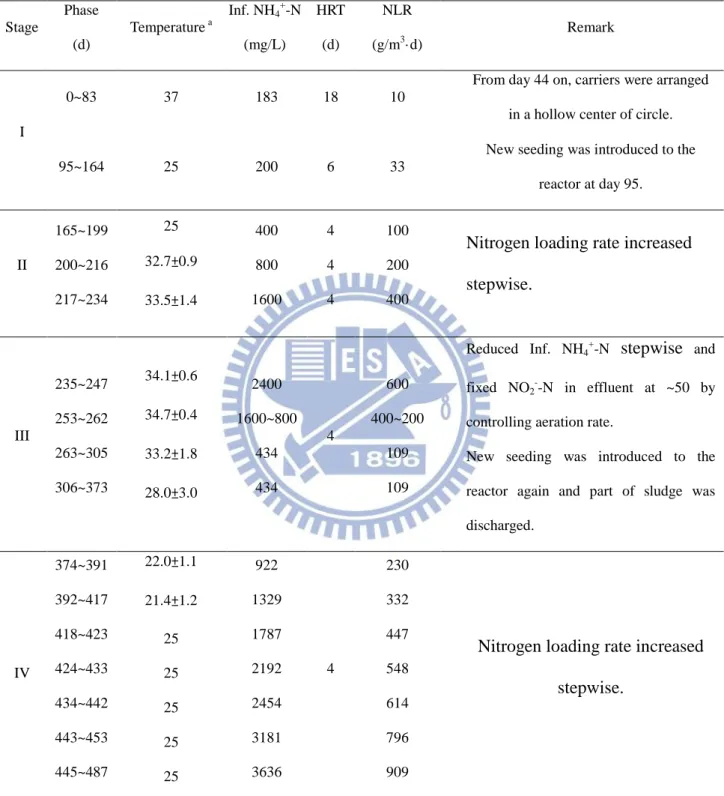
Experimental conditions
The experimental conditions were classified into 4 stages and each stage consists of several phases as summarized in Table 8. During stage I, the configuration of carrier in the reactor had been switched the bottom to the side. During stage II and IV, the loading rates were increased stepwise. However the loading rates were decreased gradually in stage III. The loading rates were determined by reducing the hydraulic retention time (HRT) and/or diluting the wastewater with deionized water. The alkalinity
concentration in the reactor was controlled by dosing bicarbonate (NaHCO3) in influent
wastewater to keep the alkalinity of effluent at ~850 mg/L as CaCO3 during stage II~ IV,
while the alkalinity concentration was not controlled in stage I. The operating
temperature was maintained at 37C during stage I, subsequently the temperature was reduced to 25C (from day 95 to 199). Because of the broke down of the water bath the temperature was out of control on day 200, and subsequently the reactor was operated under ambient temperature. The literature shows that Anammox bacteria can
successfully grow between 18~30C, and only when temperature higher than 45C or lower than 15C, the Anammox bacteria will lost its activity [16]. The temperature in the reactor was in ambient until the cold current come and result in temperature dropped to 17 C. Therefore, the water bath kept the temperature at 25C during day 418~445. During the experiment period, the sludge retention time (SRT) was maintained at
infinitive except the first and second addition of sludge. Table 8 Operating parameters at different stages in the SBR
Stage Phase (d) Temperature a Inf. NH4+-N (mg/L) HRT (d) NLR (g/m3·d) Remark I 0~83 37 183 18 10
From day 44 on, carriers were arranged in a hollow center of circle.
95~164 25 200 6 33
New seeding was introduced to the reactor at day 95. II 165~199 200~216 217~234 25 32.7±0.9 33.5±1.4 400 800 1600 4 4 4 100 200 400
Nitrogen loading rate increased stepwise. III 235~247 253~262 263~305 306~373 34.1±0.6 34.7±0.4 33.2±1.8 28.0±3.0 2400 1600~800 434 434 4 600 400~200 109 109
Reduced Inf. NH4+-N stepwise and fixed NO2--N in effluent at ~50 by controlling aeration rate.
New seeding was introduced to the reactor again and part of sludge was discharged. IV 374~391 392~417 418~423 424~433 434~442 443~453 445~487 22.0±1.1 21.4±1.2 25 25 25 25 25 922 1329 1787 2192 2454 3181 3636 4 230 332 447 548 614 796 909
Nitrogen loading rate increased stepwise.
a
: Temperature was controlled by using a water bath or in ambient.
3.1.3 Measurements in SBR-18
alkalinity, suspended solids (SS), volatile suspended solids (VSS), MLSS, MLVSS were monitored twice or thrice per week. The process parameters such as pH, ORP and DO were monitored using pH, OPR meter (Suntex PC3200, Taiwan) and DO meter (Insite IG model 1000CE, America), respectively. Moreover, process parameters were recorded manually in the end of the SBR cycle.
3.2
Sequencing batch reactor (SBR-2.5) for treating the wastewater
with low C/N ratio
In order to investigate the possible application of partial nitrification and Anammox process for treating opto-electronic wastewater with very low C/N ratio, SBR-2.5 was used. The details of seed sludge and feeding media used, reactor configuration and modes of operation are given below.
3.2.1 Seed sludge and feeding media for SBR-2.5
Seed sludge
The reactor was inoculated with SNAD seed sludge collected from a full-scale landfill-leachate treatment plant in Taiwan as mentioned above for SBR-18. As mentioned above, the presence of Anammox bacteria, Nitrosomonas-like microorganisms and denitrifiers were verified by the fluorescence in situ hybridization (FISH) and polymerase chain reaction (PCR) techniques [41].
Feeding media
The feeding wastewater (abbreviated as WW2) was also collected from opto-electronic industry located at Tainan, Taiwan. The collected samples were stored in a refrigerator
at 4C until used and its characteristics are shown in Table 9. WW2 is a comprehensive wastewater which is mixed with several unit processes, moreover the sources of COD are cleaning solvents used in manufacturing processes such as isopropyl alcohol (IPA), acetone or acetic acid. The source of ammonium is from ammonia gas used in etching process.
Additional medium supply to WW2
Metal ion is important for growth of microorganism. For example, part of enzyme needs some molecules to form complete enzymes and this kind of enzymes called holoenzyme. Metal ions can be one of the molecules as cofactor and it can assist enzymes during the catalysis of reactions. Furthermore, many studies also provided the synthesis wastewater with metal for inoculums of Anammox bacteria. To ensure Anammox bacteria can successful growth without lacking of trace element, additional medium was supplemented with mineral medium to WW2. In addition, the present of polyvalent metal cations can help the formation of boiflocculation causing more efficient of sludge settling. The compositions of the additional mineral supplied to WW2 were the same with supplied to WW1 as shown in Table 7. Moreover, the additional NaHCO3 was also
added to the wastewater. The pH of the feeding wastewater was adjusted to 7.8-8.0 by HCl before introducing it to the reactor.
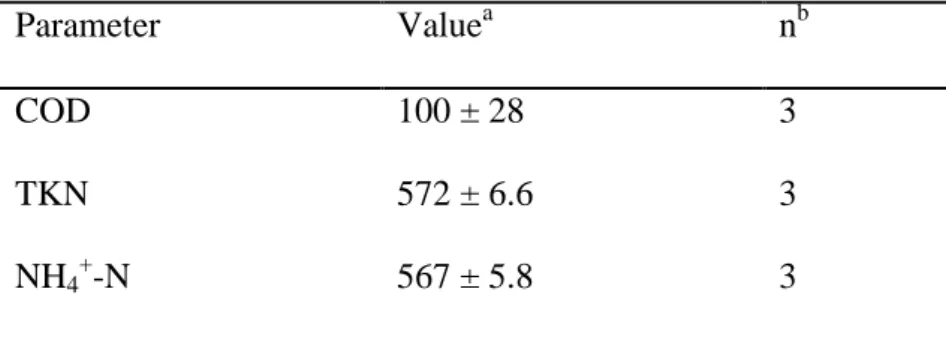
Table 9 Main characteristics of raw opto-electronic wastewater (WW2) Parameter Valuea nb
COD 100 ± 28 3
TKN 572 ± 6.6 3
NO2--N - 3
NO3--N 7±5.5 3
PO43--P 0.7±0.7 3
pH 9.4±0.1 3
Alkalinity as CaCO3 1260±208 3
a: all units are in mg/L, except pH
b: The number of times wastewater sample analyzed and collected from the industry
3.2.1 Experimental set-up and reactor system
Reactor configuration
This study was carried out in a SBR with working volume of 2.5 L (SBR-2.5) for treating WW2. Figure 5 shows the schematic diagram of the reactor. The influent and effluent were introduced using a peristaltic pump. Incubator was used to provide a constant temperature and keep the bacteria away from inhibition of light. During the feeding and reaction stages, a complete mixing inside the SBR was ensured by mixing the reactor via a stirrer at a suitable rotation rate (~ 125 rpm).
DO monitor O2 valve DO probe aerator effluent influnet Recorder (air flow
rate, DO, pH and ORP) Influent pump effluent pump agitator Figure 5 Configuration of SBR-2.5 Operation strategy of SBR-2.5
The operating mode of SBR-2.5 was the same as used in SBR-18 shown in Fig. 4.
Experimental conditions
The reactor operation was carried out over eight stages (stage I to VIII) with varying NLR from 16 to 428 (g/m3·d). The organic loading rate (OLR) was also increased with as NLR increased. The loading rates were determined by reducing the hydraulic retention time (HRT) and/or diluting the wastewater with deionized water. The operating temperature was maintained at 37C during stage I and II, subsequently the temperature was reduced to 25C (from day 87 to the end of the experiment). In view of reducing operation cost, the influence of additional medium on enrichment of Anammox bacteria was also studied in this case study. During stage VIII, supply of Ca2+, Mg2+ and Fe2+ to the WW2 were stopped at the period of day 472 to day 497.
Table 10 Operating parameters at different stages in the SBR-2.5
3.2.2 Measurements in SBR-2.5
Similar to SBR-18, ammonium, nitrite, nitrate, COD, alkalinity, suspended solid (SS), volatile suspended solid (VSS), MLSS, MLVSS were monitored twice or thrice per week. The process parameters such as pH, ORP and DO were monitored using pH, OPR meter (Suntex PC3200, Taiwan) and DO meter (MACH sc100, Germany), respectively. Process parameters were recorded manually in the end of the SBR cycle. Specific Anammox activity (SAA) test were also performed in order to monitor the variation of Anammox activity during day 465 to day 497. The concentrations of Ca2+, Mg2+ and Fe2+ in sludge were analyzed through Inductively Coupled Plasma Optical Emission Spectrometer (ICP-OES).
Parameter
Stage
I II III IV V VI VII VIII
Temperature (C) 37 37 25 25 25 25 25 25 Inf.NH4+-N (mg/L) 78 113 368 400 564 574 531 765 Inf. COD (mg/L) 20 20 43 105 99 99 107 159 HRT (d) 5 3 3 3 3 2.5 1.7 1.7 Duration (d) 0-59 (59) 60-86 (27) 87-118 (32) 119-163 (45) 164-191 (28) 192-288 (97) 289-415 (127) 416-497 (82) NLR (g/m3·d) 16 34 110 120 169 230 297 428 OLR (g/m3·d) 4 6 13 32 30 40 60 89
3.3
Analytical methods
All chemical analyses were performed according to the Standard Methods [42] as shown in Table 11.
Table 11 Water quality analytical method
Item Method Alkalinity Method 2320 B TSS&SS&MLSS Method 2540 B&D VSS &VS&MLVSS Method 2540 E COD Method 5520 B TKN Method 4500-Norg C NH4+-N Method 4500 NH3-F NO2--N Method 4500 NO2-B NO3--N Method 4500 NO3-B PO43--P Method 4500-P E
The nitrogen loading rate (NLR) and organic loading rate (OLR) were calculated by using the Eq. (3.1) and (3.2) , respectively.
4
inf. NH
N
NLR
HRT
(3.1)inf. COD
OLR
HRT
(3.2)3.4
Biological activity analyses
3.4.1 Specific Anammox activity (SAA) test
Anammox is the reaction where Anammox bacteria convert both ammonium and nitrite to nitrogen gas. According to the characteristics of gas production and ideal gas law, specific Anammox activity (SAA) tests were invented to assess the reaction rate of Anammox [18].
SAA tests were performed at the experimental period VIII of SBR- 2.5. In this period SAA were performed to assess Anammox activity per unit VSS inside the reactor. With the measurement of VSS inside the reactor and SAA of sludge, the nitrogen volumetric removal capacity (NVRC) was calculate by using equation (3.1) and it represents the total Anammox activity inside the reactor. SAA tests were performed once per 3-5 days, and each test needs 150 ml of sludge. The experimental procedure is introduced in the following paragraphs.
Nitrogen volumetric removal capacity =
3 1 1 3
2 2
( ) ( ( ) ) ( )
NVRC gN Nm d SAA gN N gVSS VSS gVSSm (3.3)
SAA tests procedure
The tests were performed as described by Dapena-Mora et al [18]. The chemical solutions used in this test include (1) NH4Cl solution (2300 mg N/L) (2) NaNO2 solution
(2300 mg N/L) (3) Phosphate buffer solution (0.14 g/L KH2PO4, 0.75 g/L K2HPO4 and
0.5 g KHCO3 g/L. All of these chemical solutions were purged with N2 gas for 10 min
before use.
The serum bottles with a total volume of 67 ml and rubber caps were used for SAA tests. The sludge was washed twice with phosphate buffer solution before it introduced to serum bottle. Each serum bottle was filled with the sludge of 53.6 ml, NH4Cl solution of
1.7 ml and NaNO2 solution of 1.7 ml. Therefore, the total volume of liquid phase was 57
ml and the gas phase was 10 ml. Moreover, the concentrations of NH4+-N and NO2--N
inside the bottles were 70 mg N/L. The headspace was gasified with N2 to remove the
oxygen. The initial pH value was always about 7.7. The serum bottles were placed in a thermostatic shaker, at 125 rpm and 25℃. The initial pressure was equalized to the atmospheric one. The pressure in the headspace was monitored by using a pressure meter (Copal Electronics model PG-100N) with a needle. The duration of the test was 4 hours and the measurement of pressure was carried out at every hour. All of the tests were performed in triplicate.
Calculations for SAA tests
Specific Anammox activity (SAA)
The N2 gas production rate was calculated from the slope of the curve describing the
pressure increase in the bottle along the time
2 VG dN dt R T , mol N2 hr-1 (3.4)
where VG is volume of gas phase (0.01 L), R the ideal gas constant 0.0820575 (atm l
mol-1 K-1), T the temperature (K) and α the slope of pressure increase in the bottle along the time (atm).
The SAA is calculated from the N2 gas production rate divided by the VSS
concentration inside the bottle.
2 28 24 L dN dt SAA X V , g N2-N (g VSS)-1d-1 (3.5)
where 28 is molecular weight of N2 (g N/mol), 24 the unit conversion factors from hour
volume of liquid phase in the bottle (0.057 L).
3.4.2 Nitrate Uptake Rate (NUR) test
To verify the presence of denitrification reaction in the reactor, the NUR test was carried out to assess the activity of denitrifying bacteria. The NUR tests were performed in a serum bottle with a total volume of 250 ml and gas-tight rubber caps. The sludge was taken from reactor and washed twice with mineral medium before it introduced to serum bottle. Nitrate (as sodium nitrate) and COD (as glucose) were added to a final concentration of about 90 mg N/L and 85 mg O2/L, respectively. The composition of the
mineral medium was: KHCO3 1.25, KH2PO4 0.025, CaCl2.2H2O 0.3, MgSO4.7H2O 0.2,
FeSO4 0.00625 and EDTA 0.00625. The serum bottles were made anaerobic by flushing
with pure nitrogen gas and were placed in a thermostatic shaker, at 125 rpm and 25℃. Nitrate, nitrite and COD were measured over time during 24 hours.
3.5
Polymerase chain reaction (PCR)
To confirm the activities of nitrifiers, Anammox and denitrifiers in the sludge of SBR-18 and SBR-2.5, PCR analysis of the total genomic DNA was carried out. The total genomic DNA of sample was extracted by using Power Soil DNA Isolation Kit (MO BIO Laboratories, USA). The DNA concentration was determined on a photometer ASP-3700 (ACTGene, USA). PCR reaction was performed in a 96 well Gradient Palm-Cycler (Corbett Research Pty Ltd, Austria). Each reaction was performed in a 25 μl volume containing 1 μl of DNA template (average 30 ng), 1 μl of each primer (10 μM), 9.5 μl of sterilized water and 12.5 μl of 2X Taq PCR Master Mix (Genomics BioSd & Tech, Taiwan). Primer set for AOB was amoA-1F with amoA-2R [43], for
nitrite oxidizing bacteria (NOB) was nirS-1F/nirS-6R [44], for denitrifying bacteria was cnorB-2F/cnorB-6R [45], for Anammox bacteria were Brod541F/Amx820R [46], [47] and AnnirS379F/AnnirS821R [48]. To target specific species of Anammox bacteria, primer set KS-qF3/KS-qR3 was used for Candidatus Kuenenia stuttgartiensis (KS), while BAqF/BAqR was used for Candidatus Brocadia anammoxidans (BA).
Results of PCR were checked by agarose gel electrophoreses and DNA sequencing. For qPCR analysis, primers BACT1369F/PROK1492R [49] and Amx809F/Amx1066R [50] were used to detect the eubacteria and most anammox, respectively. Each reaction was performed in a 10 μl volume containing 1 μl of DNA template (about 5 ng), 0.5 μl of each primer (10 μM), 3 μl of sterilized water and 5 μl of fluorescent dye SsoFastTM EvaGreen® Supermix (BIO-RAD, USA). The cycling parameters were 30s at 95°C and 40 cycles of 5s at 95°C, 5s at 54°C for BACT1369F/PROK1492R, or 58°C for Amx809F/Amx1066R followed by a dissociation stage (95°C for 15 seconds, 65°C for 15 seconds, followed by a slow ramp to 95°C). The melt curve appeared no detectable peaks that were associated with primer-dimer artifacts and no other nonspecific PCR amplification products were observed. Specificity of the qPCR products were also checked by agarose gel electrophoreses.
Chapter 4
Results and Discussion
4.1
Sequencing batch reactor with carriers (SBR-18) for treating
ammonium-rich wastewater
4.1.1 Characteristics of opto-electronic industrial wastewater
The characteristics of optoelectronic industrial wastewater are shown in Table 6. It is evident from the Table that the wastewater is highly alkaline in nature (pH, 9.7), very rich with inorganic nitrogen as the concentrations of NH4+-N and TKN are almost
similar, and depleted with organic carbon source. Very high NH4+ ion concentration
(3795 mg/l) without COD suggesting the wastewater is very complex in nature.
4.1.2 Nitrogen removal performance
SBR-18 was used to study the ammonium rich wastewater treatment. The overall study was divided into different stages viz (Table 8). Stage I – Reactor start-up (day 0-164); Stage II – increasing nitrogen loading (days 165-234); Stage III – Inhibition and recovery of reactor performance (235-373 d); Stage IV – Reactor performance at very high nitrogen loading rate (374-487). The concentrations of NH4+-N in influent, HRT
and NLR in each phase along with the duration of each phase is mentioned in Table 8.
4.1.2.1 Stage 1: Reactor start-up (days 0-164)
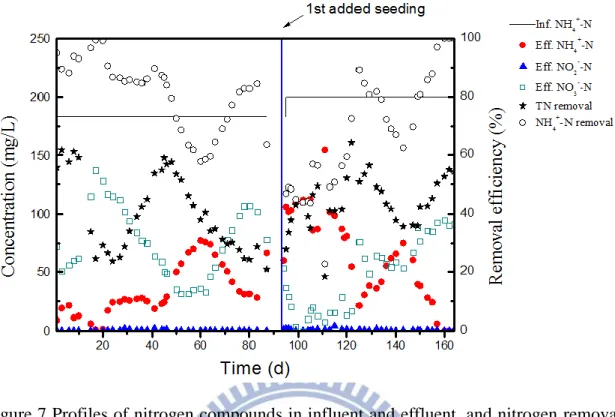
The reactor used in this study was previously used to develop a SNAD process using synthetic wastewater [40]. The synthetic wastewater was replaced with the real world opto-electronic wastewater. The carriers were also introduced into the reactor to support the microbial growth. The reactor was started with NLR and HRT of 10 g/m3/d and 18 d, respectively. The DO level was always maintained at 0.3-0.4 except day17~day 19 (Figure 6).The high DO resulted in high nitrate level in effluent and inhibited Anammox
activity, which resulted in the decreasing TN removal efficiency (Figure 7). However, Anammox activity recovered itself when DO level was maintained at low level (day 25-44). Strous et al also indicated that high DO is a reversible factor for Anammox activity [51].
In order to improve the diffusion of sludge and nutrients, the configuration of carriers was changed at day 45. However, TN removal efficiency reduced dramatically while nitrate concentration in the effluent increased sharply during days 50-88, this phenomenon was similar to the previous condition. The shock due to DO contamination during the period of the change in configuration of carriers might be the probable reasons for this decrease activity of the reactor. Moreover, the ratio of nitrite and nitrate production to ammonium conversion (
4 3 -2 NO ) NH NO (
Y ) in this stage were always higher than theoretical value in this stage (Figure 8), which indicates that partial nitrite was further oxidized to nitrate and suggests the enrichment of nitrite oxidizing bacteria (NOB) in the reactor .
Therefore, to improve the reactor performance fresh seed sludge was inoculated in the reactor on day 95 and NLR increased to 33 g/m3/d, while HRT reduced to 6 d. The reactor performance started to recover and TN removal and NH4+-N removal increased
to 60% and 80%, respectively on day 122 (Figure 7). After day 150, the TN removal and NH4+-N removal were sharply decreased to 40% and 80%, respectively. Low NLR
(less than 100 g/m3/d) during this start-up period might be the reason for poor and unstable performance of the system. As below this NLR, NOB such as nitrite-oxidizing
Nitrobacter and Nitrospira species start developing in the system [28]. These NOBs
disturbed the stoichiometry of CANON process by oxidizing NO2+-N into NO3+-N and
inhibit the Anammox reaction due to unavailability of NO2+-N in the reactor. The
found to be 75 mg/L. This high concentration of NO3+-N in the reactor suggested the
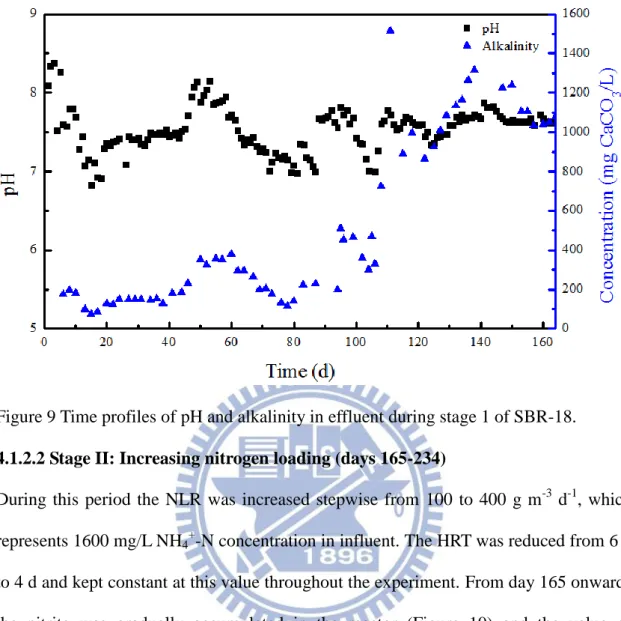
presence of NOB in the reactor. Therefore, the NLR was further increased to 100 g/m3/d on day 165 and reactor performance at increasing nitrogen loading rates was studied. Figure 9 shows the profiles of pH and alkalinity in the effluent. The DO was maintained below 0.5 mg/L for better growth of Anammox bacteria. The pH inside the reactor was maintained between 7.0 and 8.0 by adding the alkalinity in the reactor.
Figure 7 Profiles of nitrogen compounds in influent and effluent, and nitrogen removal efficiencies in stage I of SBR-18.
Figure 8 The temporal variation of conversion efficiency ( 3 4 -2 NO ) NH NO ( Y ) during stage I of SBR-18.
Figure 9 Time profiles of pH and alkalinity in effluent during stage 1 of SBR-18.
4.1.2.2 Stage II: Increasing nitrogen loading (days 165-234)
During this period the NLR was increased stepwise from 100 to 400 g m-3 d-1, which represents 1600 mg/L NH4+-N concentration in influent. The HRT was reduced from 6 d
to 4 d and kept constant at this value throughout the experiment. From day 165 onwards, the nitrite was gradually accumulated in the reactor (Figure 10) and the value of
3 4 -2 NO )NH NO (
Y was gradually decreased (Figure 11). This result indicated that NOB did not consume all available nitrite produced by AOB and the nitrite was used by Anammox bacteria. In addition, this accumulated level of nitrite (~35 mg N/L) in this stage is not inhibiting Anammox reaction according to Strous et al [17]. The TN removal and NH4+-N removal increased exponentially to 90% and ~100%, respectively
during this stage and maintained at these values for more than four times of HRT (Figure 10). Similar to stage I, DO was maintained below 0.5 mg/L and pH was maintained between 7.0 and 8.0 by adding the alkalinity in the reactor (Figure 12).
Figure 10 Profiles of nitrogen compounds in influent and effluent, and nitrogen removal efficiencies in stage II of SBR-18.
Figure 11 The temporal variation of conversion efficiency ( 3 4 -2 NO )NH NO ( Y ) during stage II of SBR-18.
Figure 12 Time profiles of pH and alkalinity in effluent during stage II of SBR-18.
4.1.2.3 Stage III: Inhibition and recovery of reactor performance (235-373 d)
The system successfully treated wastewater with influent NH4+-N concentration of 1600
mg/L i.e NLR of 400 g m3-1 d-1. However, as soon as the influent NH4+-N concentration
increased to 2400 mg/L (NLR of 600 g m3-1 d-1) and the aeration rate also increased from 0.4 NL/min to 0.6 NL/min, sharp decrease in reactor performance was observed. The accumulation of high nitrite concentration in the reactor was observed and the highest NO2--N concentration was 166 mg/L. Sudden increase in aeration rate (0.6
L/min) and insufficient Anammox activity could be the most probable reason for this. After day 247, feeding and aeration into the reactor was stopped until the nitrite level decreased to 10 mg/L. The NLR was decreased stepwise to 200 g m3-1 d-1 and aeration at 0.5 L/min was introduced into the reactor. The effluent concentrations of NH4+-N,
NO2+-N and NO3+-N were increased to 1000 mg/L, 100 mg/L and 40 mg/L, respectively,
between day 253-262 (Figure 13). Therefore, NLR was further decreased (on day 263) and maintained between 100-125 g m3-1 d-1 for 43 days (more than 10 times of HRT).
The reactor performance was not improved at this NLR, in spite of nitrite in effluent level fixed at ~50 mg N/L. The TN and NH4+-N removal were in range of 5-15%,
respectively, between days 263-305. The average concentrations of MLSS and MLVSS were 3300 mg/L and 1700 mg/L between days 235-305. On day 306, part of original sludge (16 g) was discharged and fresh seed sludge (31 g) was added into the reactor and the NLR was kept to 109 g m-3 d-1 for 68 days (17 times of HRT). The cumulate level of nitrite (92 mg N/L) was observed again, while this time Anammox perform temporary negative effect. The performance of reactor recovered as we observed 90% and 100% of TN and NH4+-N removal, respectively between days 340-373. Similar to
pervious stage, pH was maintained between 7.0 and 8.0 by adding the alkalinity in the reactor (Figure 14).
Figure 13 Profiles of nitrogen compounds in influent and effluent, and nitrogen removal efficiencies in stage III of SBR-18.
Figure 14 Time profiles of pH and alkalinity in effluent during stage III of SBR-18.
4.1.2.4 Stage IV: Reactor performance at very high nitrogen loading rate (days 374-487)
The strategy of controlling nitrite level was very important for Anammox. In order to avoid nitrite accumulation because of insufficient Anammox activity, the nitrite level was monitored in following 4 hours of the feeding phase and aeration rate adjusted gradually for different NLR. In this phase, the NLR was increased exponentially from 109 to 909 g m3-1 d-1 (the maximum possible NLR). At NLR of 909 g m-3 d-1, the influent NH4+-N concentration was 3636 mg/L, which represented the concentration of
NH4+-N in the real world optoelectronic industrial wastewater used in this study. The
SBR was run about 1 month (7 times of HRT) successfully to treat this high NLR (0.9 Kg m3-1 d-1). The average TN removal and NH4+-N removals were 90% and 100%,
respectively (Figure 15), in this phase. The average effluent concentrations of NH4+-N
and NO2+-N were less than 50 mg/L and 15 mg/L, respectively. MLSS and MLVSS
mg/L, respectively (Figure 17).
Figure 15 Profiles of nitrogen compounds in influent and effluent, and nitrogen removal efficiencies in stage IV of SBR-18.
Figure 17 Profiles of MLSS and MLVSS in SBR-18.
4.1.3 Results from PCR
To know the microbial community present in the reactor, PCR experiments were carried out using specific primers for AOB, Anammox bacteria (including primers for Kuenenia stuttgartiensis (KS) and Brocadia anammoxidans (BA)) and NOBs. Fig. 18 shows the PCR results of samples taken on day 229 from SBR-18. Bright DNA bands (around 500 bp and around 900 bp) exist on the lanes of amoA targeting AOB and on the lane of Nitro and NSR targeting NOB, respectively. For detecting most anammox bacteria and specific anammox species - KS and BA, bands near 500 bp, 100 bp and 300 bp can be seen on the lanes of AnnirS, KS, and BA, respectively. These results suggest that AOB, NOB and Anammox (BS and KS) bacteria were present in the reactor on day 229. However, the active population of NOB must have been very low in the reactor since the value of was 10% on day 229.
Figure 18 Results of PCR by performing agarose gel electrophoreses. The sample was taken on day 229 from SBR-18.
Fig. 19 shows the PCR results of sample taken on day 304 from SBR-18. Presence of AOB and NOB (the lane of nirS) in the reactor was evident from the Fig. 19. A very faint band in the lane of TA (total Anammox) in Fig. 19 compared to Fig. 18 suggests that Anammox activity is very little in the reactor during this period and therefore, reactor performance was inhibited during days 263-305 of stage III in the SBR-18.
taken on day 305 from SBR-18.
PCR results of sample taken on day 487 (steady state condition under highest NLR) confirmed the co-existence of AOB and anammox bacteria in the reactor (Figure 20). Besides, results from relatively quantitative analysis of qPCR showed the cell number of eubacteria changed from 1.1 108 to 3.4 109 cells/μg DNA and most anammox bacteria changed from 4.3 106 to 3.1 108. The percentages of anammox to eubacteria were 1.8% and 9.0% on 229 d and 487 d, respectively. These results showed anammox bacteria were enriched in the reactor under steady state condition, and the ratio of anammox to eubacteria increased 5 times.
Figure 20 Results of PCR by performing agarose gel electrophoreses. The sample was taken on day 487 from SBR-18.
4.2
Sequencing batch reactor (SBR-2.5) for treating the
wastewater with low C/N ratio
The nitrogen removal from opto-electronic wastewater with low C/N ratio was monitored over 16 months in SBR-2.5. As small amount of COD is present in the wastewater and the seed sludge used for start-up of SBR-2.5 contains AOB, Anammox and denitrifier, it is expected that SNAD system will develop in the SBR-2.5. Table 3 shows the operation conditions of SBR under various stages investigated in this study. In this system, ammonium would be converted partly to nitrite by AOB (Eq. (4.1)), and subsequently Anammox bacteria would convert ammonia with nitrite to nitrogen gas (Eq. (4.2)). The overall equation for this process is described as Eq. (4.3). The ratio of nitrite and nitrate production to ammonium conversion (
4 3 -2 NO ) NH NO ( Y ) was calculated according to Eq. (4.4) and was used to evaluate the performance of the SNAD system in the reactor. Theoretically, 100% ammonia should produce 88% nitrogen gas with 11% nitrate. This suggests that the value of
4 3 -2 NO )NH NO (
Y should be close to 11% for combined partial nitrification and Anammox reaction. However, the presence of heterotrophic denitrifiers can reduce the value of
4 3 -2 NO )NH NO ( Y to below 11% as they will utilize the COD to reduce the nitrate into nitrogen gas.
-3 2 2 2

![Table 1 A list of currently sequenced microbial genomes with nitrogen cycle pathways [3]](https://thumb-ap.123doks.com/thumbv2/9libinfo/8638205.192997/14.892.126.799.517.1144/table-currently-sequenced-microbial-genomes-nitrogen-cycle-pathways.webp)
![Table 2 the major anthropogenic sources of nitrogen in aquatic ecosystems [6]](https://thumb-ap.123doks.com/thumbv2/9libinfo/8638205.192997/17.892.127.764.127.796/table-major-anthropogenic-sources-nitrogen-aquatic-ecosystems.webp)
![HPSH [ 氧化數平衡反應式係數 ]](data:image/gif;base64,R0lGODlhAQABAIAAAP///wAAACH5BAEAAAAALAAAAAABAAEAAAICRAEAOw==)