國立交通大學
土木工程學系碩士班
碩士論文
振動夯實造成土壓力及其應力路徑之變化
Variation of Earth Pressure and Stress Path
due to Vibratory Compaction
研 究 生 : 江奕蓁
指導教授 : 方永壽 博士
振動夯實造成土壓力及其應力路徑之變化
Variation of Earth Pressure and Stress Path due to Vibratory
Compaction
研 究 生: 江奕蓁
Student:Yi-Jen Jiang
指導教授:方永壽 博士
Advisor:Dr. Yung-Show Fang
國 立 交 通 大 學 土 木 工 程 學 系 碩 士 班
碩士論文
A Thesis
Submitted to the Department of Civil Engineering
College of Engineering
National Chiao Tung University
in Partial Fulfillment of the Requirements
for the Degree of
Master of Engineering
in Civil Engineering
September, 2009
Hsinchu, Taiwan, Republic of China
中華民國九十八年九月
振動夯實造成土壓力及其應力路徑之變化
研究生 : 江奕蓁 指導教授 : 方永壽 博士
國立交通大學土木工程學系碩士班
摘要
本論文以實驗方法探討振動夯實造成之土壓力及其應力路徑的變化。本研究 以氣乾之渥太華砂為回填土,分五層填土並且分層夯實。夯實土層為每層 0.3 m, 總高度為 1.5 m.回填土初始相對密度(Dr)為 34.2 %,壓密後的相對密度(Dr)為 73.8 %。為了在實驗室模擬雙向平面應變的情況,本研究採用塑膠膜潤滑層來降低砂 土和填砂槽側牆間的摩擦力。本研究進行一連串相關的實驗,來探察振動夯實對 砂土所產生的影響。這些影響包括夯實後土壤的應力變化及其動態應力路徑。根 據實驗結果,本研究獲得以下幾項結論: 1. 對於疏鬆砂土,土體內的垂直土壓力和水平土壓力可分別以σv =γz 和 Jaky 公式來進行合理的估算。 2. 隨著夯實逐漸接近土壓力計,其應力路徑變化越來越明顯;在最靠近擋土牆的 地方夯實時,位於土壓力計上方的應力路徑變化是最大的; 隨著覆土深度逐漸 升高,因夯實造成之應力變化相當不顯著。 3. 比較各組之應力路徑發現,其大小尺寸是相似的,應力路徑軌跡像是一顆的彗 星。而動態應力路徑都介於K0線及Kp線。 4. 相較於Broms在 1971 提出之加載解載之應力路徑,本實驗量測出的應力路徑 軌跡與Broms的應力路徑軌跡有很大的差異。Broms 所提出的應力路徑是在土 體上方放置一個很重的且不會振動的壓路機,而本實驗是放置一個重量很輕且 具振動力的夯實機。造成差異之原因有可能是因為夯實機不只有垂直方向的出力(Fz),還有平行牆面的力 ( Fy ) 及與牆表面垂直的力 ( Fx ),這三個方向的
出力造成了彗星形狀的應力軌跡。
Variation of Earth Pressure and Stress Path due
to Vibratory Compaction
Student: Yi-Jen Jiang Advisor: Dr. Yung-Show Fang Institute of Civil Engineering
National Chiao Tung University
Abstract
This paper presents experimental data on the variation of earth pressure and dynamic stress path against a nonyielding retaining wall due to soil filling and vibratory compaction. The instrumented nonyielding wall facility at National Chiao Tung University in Taiwan was used to investigate the effects of vibratory compaction on the change of dynamic stress path. In this study, air-dry Ottawa sand was plated in five lifts
and the height of backfill was 1.5 m. The initial relative density Dr of the backfill was
34.2 %, and the compacted relative density Dr of the backfill was 73.8 % . To simulate
a plane strain condition in the laboratory, the friction between the soil and sidewalls of the soil bin was reduced with a lubrication layer. The variation of dynamic stress path was measured during compaction with a vibratory compactor. Based on the test results, the following conclusions were drawn.
1. For a loose backfill, the horizontal earth pressure in the soil mass was in good
agreement with Jaky’s solutions. The vertical earth pressure in soil was near to the
equation σv = γz.
2. As the area of the compaction approached the soil pressure transducer ( SPT ) in
x-direction ( perpendicular to the wall face), the dynamic stress path became more obvious when the compactor moved to the lane near the wall.
3. As the area of compaction passed the SPT in y-direction (parallel to the wall surface), the maximum dynamic stress path was obvious when the compactor was right in front of the SPT.
4. For a SPT at a lower elevation, when the area of compaction rose with the
elevation of the lift surface, the compaction-induced stress path became less significant.
5. The dynamic stress path of a soil element under vibratory compaction had the
shape of a comet. The shape size of the dynamic stress paths obtained at five different lifts was quite similar. The stress paths were bounded by the at-rest
K0-line and passive Kp-line.
6. The measured dynamic stress path was quite different from the stress path
proposed by Broms (1971). The stress path reported by Broms was induced by a static heavy compactor. The vibratory compactor used in this study vibrated and
generated cycle force in three direction: Fx, Fy, and Fz. This was probably the
main reason why the dynamic stress path due to vibratory compaction was so different from Broms’ finding.
v
ACKNOWLEDGEMENTS
The author wishes to give his sincere appreciation to his advisor, Dr. Yung-Show Fang for his continuous encouragement, helpful discussions and enthusiastic suggestions that made this work possible. The author also wants to express his appreciation to the members of his supervisory committee, Dr. Tsang-Jiang Chen and Dr. Chia-Cheng Fan for their valuable suggestions. Very special thanks are extended to Dr. Yii-Wen Pan, Dr. An-Bin Huang, Dr. Jyh-Jong Liao, Dr. Hsin-Yu Shan and Dr. Chih-Ping Lin for their encouragement and teaching. The author must extend his gratitude to Mr. Kuo-Hua Li, Mr. Shih-Ta Hsu and Mr. Yu-Lun Chien for their support and encouragement.
Appreciation is extended to all my friends and classmates, especially for Mr. Chih-Chung Chang, Mr. Sheng-Feng Huang, Mr. Cho-Min Lin, Mr. Wei-Ting Chen, Miss Yu-Fen Hsu, Mr. Kuan-Yu Chen, Mr. Ting-Yuen Huang and Mr. Li-Chun Chen for their encouragement and assistance.
Finally, the author would dedicate this thesis to his parents, brothers and boyfriend for their continuing encouragement and moral support.
Table of Contents
Page
Abstract (in Chinese) ……….. i
Abstract ………..……….. iii
Acknowledgements ……… v
Table of Contents ………. vi
List of Tables ……… viii
List of Figures ……….. ix
List of Symbols ……… xiii
Chapter 1 Introduction
………... 11.1 Objectives of Study ……… 1
1.2 Research Outline ……… 2
1.3 Organization of Thesis ……….……… 2
Chapter 2 Literature Review
………... 42.1 Earth Pressure At-Rest Theory ………... 4
2.1.1 Coefficient of Earth Pressure At-Rest ……… 4
2.1.2 Jaky’s Formula ……….………… 5
2.2 Plane Strain Condition ………. 7
2.3 Distribution of Contact Stress over Footings ……….. 7
2.4 Effects of Soil Compaction on Earth Pressure At-Rest ………..…… 8
2.4.1 Study of Broms ……….… 8
2.4.2 Study of Duncan and Seed ……… 11
2.4.3 Study of Peck and Mesri ………...…… 12
2.4.4 Study of Chen and Fang ……… 13
Chapter 3 Experimental Apparatus
…….……….. 163.1 Model Retaining wall ………..…… 16
3.3 Data Acquisition System ……… 17
3.4 Vibratory Compactor ………..…… 18
Chapter 4 Backfill and Interface Characteristics
……… 194.1 Backfill Properties ……….. 19
4.2 Side Wall Friction ……… 20
4.3 Control of Soil Density ………... 21
4.3.1 Air-Pluviated loose Ottawa Sand ………..………... 21
4.3.2 Compacted Dense Sand ………... 22
4.3.3 Uniformity of Soil Density ………..…... 22
Chapter 5 Test Results and Discussion
……… 245.1 Stress in Loose Sand …….…..………... 24
5.2 Dynamic Behavior of Soil compactor ………..……..… 25
5.3 Vertical and Horizontal Stresses in Sand during Compaction ……… 26
5.4 Stress Paths for Filling and Compaction of Backfill ……….… 27
5.5 Dynamic Stress Paths during Compaction ……….… 28
5.5.1 Compaction Approaching SPT in x-direction ……… 29
5.5.2 Compaction Passing SPT in y-direction ………. 29
5.5.3 Compaction Rising in z-direction ……….. 30
5.6 Comparison among Lifts and Tests ……….. 31
5.7 Theoretical and Experimental Stress Paths ………. 31
Chapter 6 Conclusions
…………..……… 33References
……….…..… 35
Tables ……….. 39
Figures ………..… 41
Appendix A : Calibration of Soil Pressure Transducers ……… 112
List of Tables
Number Page
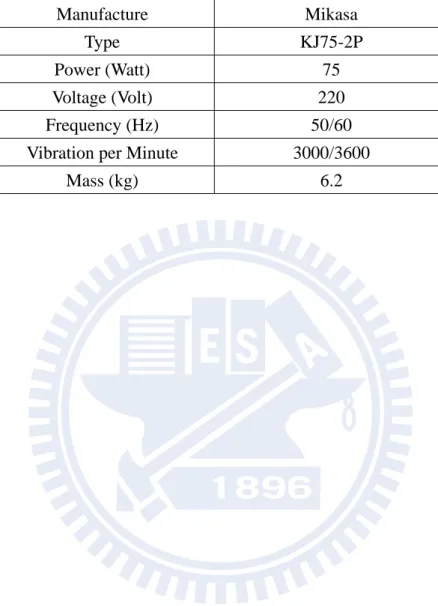
3.1. Technical Information of the Eccentric Motor ………... 39
List of Figures
Number Page
2.1. Development of in-situ Stresses 41
2.2. Principal Stresses in a Soil Element 42
2.3. Jaky’s Formulation of the Relationship between Ko on OC and φ Mobilized in
OAB (after Mesri and Hayat, 1993)
43
2.4. Definition of plane strain state-of-stress 44
2.5. Flexible (a) and Rigid (b) foundation on sand 45
2.6. Broms’s simplified compaction pressure theory (after Broms, 1971) 46
2.7. Lateral pressure distribution due to compaction of fill (after Broms, 1971) 47
2.8. Basic components of hysteretic Ko-loading/unloading model (after Duncan and
Seed, 1986)
48
2.9. Comparison between Final Pressure Distributions Based on Incremental
Analysis and Hand Solution (after Duncan and Seed, 1983)
49
2.10. Hand-calculation for estimating σh (after peck and Mesri, 1987) 50
2.11. Distribution of Horizontal Earth Pressure after Compaction (after Chen and
Fang, 2008)
51
2.12. Stress path of a soil element under compaction (after Chen and Fang, 2008) 52
2.13. Horizontal Earth Pressure Estimated with Various Methods after Compaction
(after Chen and Fang, 2008)
53
3.1. NCTU nonyielding Retaining-Wall Facility (after Chen and Fang, 2008) 54
3.2. Locations of soil-pressure transducers mounted on the wall (after Chen,
2003)
55
3.3. Soil-pressure transducer (Kyowa PGM-02KG) (after Chen, 2003) 56
3.5. Data Acquisition System 58
3.6. Side-View of Vibratory Soil Compactor (after Chen, 2002) 59
3.7. Vibratory Soil Compactor (after Chen, 2002) 60
3.8. Eccentric Motor with Eccentric Steel Plate (Mikasa KJ75) (after Wang, 2005) 61
4.1. Grain Size Distribution of Ottawa Sand (after Chen, 2003) 62
4.2. Shear box of direct shear test device (after Wu, 1992) 63
4.3. Relationship between Unit Weight γ and Internal Friction Angle φ
(after Chang, 2000)
64
4.4. Lubrication Layer on the side Wall 65
4.5. Schematic Diagram of Sliding Block Test (after Fang et al., 2004) 66
4.6. Sliding Block Test Apparatus (after Fang et al., 2004) 67
4.7. Variation of frition Angle with Normal Stress (after Fang et al., 2004) 68
4.8. Relationship among Slot Opening, Drop Height, and Relative Density (after
Ho, 1999)
69
4.9. Raining of sand from soil hopper 70
4.10. Pluviation of Ottawa Sand into Soil Bin 71
4.11. Soil compaction procedure 72
4.12. Dimensions of Soil Density Cup (after Ho, 1999) 73
4.13. Soil Density Cup (after Chen 2003) 74
4.14. Soil Density Cups Buried at Different Elevations 75
4.15. Arrangement of Soil Density Cups at Same Elevation 76
4.16. Density Control Test (a) Placement of Density Cup;(b) Measurement of Soil
Mass in Cup
77
4.17. Distribution of Soil Density 78
5.1. Locations of SPT to Measure Distribution of Earth Pressure 79
(b) Distribution of horizontal earth pressure at-rest 80
5.3. Accelerometer 81
5.4. Location of accelerometer to measure 82
(a) Acceleration in x-direction; 83
5.5.
(b) Force in x-direction. 83
5.6. Location of accelerometer to measure ay (m/s2) 84
(a) Acceleration in y-direction; 85
5.7.
(b) Force in y-direction. 85
5.8. Location of accelerometer to measure az 86
(a) Acceleration in z-direction; 87
5.9.
(b) Dynamic vertical force. 87
5.10. Total force in vertical direction 88
5.11. Distribution of vertical earth pressure in soil mass. 89
5.12. Distribution of horizontal earth pressure in compacted sand 90
5.13. Stress paths for soil element under filling and compaction of backfill (Test
0806)
91
5.14. Comparison of stress paths for soil element under filling and compaction of
backfill
92
5.15. Different direction for consider compaction-induced stress paths 93
5.16. Stress paths measured at center part of the model wall by SPT2 and SPT102
due to compaction on lift 1 from Lane f to Lane a
94
5.17. Stress paths measured at center part of the model wall by SPT5 and SPT105
due to compaction on lift 2 from Lane f to Lane a
95
5.18. Stress paths measured at center part of the model wall by SPT8 and SPT108
due to compaction on lift 3 from Lane f to Lane a
96
due to compaction on lift 4 from Lane f to Lane a
5.20. Stress paths measured at center part of the model wall by SPT14 and SPT114
due to compaction on lift 5 from Lane f to Lane a
98
5.21. Stress paths measure at SPT2 and SPT102 due to compaction on Lane (near
the wall) of Lift 1 from R750 to L750
99
5.22. Stress paths measure at SPT5 and SPT105 due to compaction on Lane (near
the wall) of Lift 2 from R750 to L750
100
5.23. Stress paths measure at SPT8 and SPT108 due to compaction on Lane (near
the wall) of Lift 3 from R750 to L750
101
5.24. Stress paths measure at SPT11 and SPT111 due to compaction on Lane (near
the wall) of Lift 4 from R750 to L750
102
5.25. Stress paths measure at SPT14 and SPT114 due to compaction on Lane (near
the wall) of Lift 5 from R750 to L750
103
5.26. Stress paths measure at SPT2 and SPT102 due to compaction on center part of
Lane a (near the wall) of Lift 1 to Lift 5
104
5.27. Stress paths measure at SPT5 and SPT105 due to compaction on center part of
Lane a (near the wall) of Lift 2 to Lift 5
105
5.28. Stress paths measure at SPT8 and SPT108 due to compaction on center part of
Lane a (near the wall) of Lift 3 to Lift 5
106
5.29. Stress paths measure at SPT11 and SPT111 due to compaction on center part
of Lane a (near the wall) of Lift 4 to Lift 5
107
5.30. Stress paths measure at SPT14 and SPT114 due to compaction on center part
of Lane a (near the wall) of Lift 5
108
5.31. Stress paths due to compaction at center of Lane a (near the wall) for Lift 1 to
Lift 5 (Test 0806)
109 5.32. Stress paths due to compaction at center of Lane a (near the wall) for Lift 1 to 110
Lift 5 (Test 0805)
List of Symbols
Cu Coefficient of uniformity
Dr Relative density
δ Friction angle
E Young’s modulus
ei Void ratio of soil
emax Maximum void ratio of soil
emin Minimum void ratio of soil
ε Strain
φ Effective stress friction angle
φ’ Effective stress friction angle for local shear failure
φcv Constant-volume friction angle
Gs Specific gravity of soil
γ Unit weight of soil
γd Dry unit weight of soil
γd(min) Dry unit weight of soil in the loosest state
H Thickness of backfill
Ka Coefficient of active earth pressure
Kh Coefficient of horizontal earth pressure
Ko Coefficient of earth pressure at-rest
Kol Earth pressure coefficient due to locked-in stress
Konc At-rest earth pressure coefficient for NC soil
Kp Coefficient of passive earth pressure
ν Poisson’s ratio
Ph Total horizontal force
qult Ultimate bearing capacity of soil
S Wall movement
σ1 Major principal stress
σ3 Minor principal stress
σcyc Compaction loading
σh Effective horizontal stress
Δσh,ci Peak compaction-influenced horizontal pressure
σn Normal stress
Chapter 1
INTRODUCTION
In the construction of highway embankments, earth dams, and many other engineering structures, engineers will compact loose soils to increase their unit weights. The objective of the compaction operation is to improve the engineering properties of soil such as increasing the fill bearing capacity or reducing settlement. In various methods of compaction, vibratory compactions are used mostly for the densification of granular soils
Before compaction, the vertical earth pressure is calculated by the equation σv = , γz
and the horizontal earth pressure is estimated with Jaky’s formula. According to Chengand Fang (2008), it shows the increment of horizontal pressure was more significant than vertical pressure on compaction. In this study, the variation of dynamic stress path will be described and compare to theoretical stress path.
1.1 Objectives of Study
To analyze the residual lateral earth pressure induced by soil compaction, several methods of analysis have been proposed by Broms (1971), Duncan and Seed (1986), Peck and Mesri (1987) and other researchers. Duncan et al. (1991) used the analytical procedures proposed by Duncan and Seed (1986) to develop earth pressure charts and tables that can be used to estimate residual earth pressure due to compaction. However,
study presents experimental data to investigate dynamic stress path due to compaction. All experiments mentioned in this study were conducted in the National Chiao Tung University (NCTU) retaining wall facility that is described in Chapter 3. The horizontal and vertical stresses were measured with the soil pressure transducers (SPTs) which mounted on the wall and embedded in the backfill.
1.2 Research Outline
This research utilizes the NCTU model wall facility to investigate the earth pressures against a non-yielding wall. The at-rest earth pressure theory and experimental findings associated with vibratory compaction are summarized in Chapter 2. Details of the NCTU non-yielding model wall system and the vibratory compactor used for the experiments are discussed in Chapter 3. Test results regarding the characteristics of backfill and soil density control are introduced in Chapter 4. To investigate the earth pressure and dynamic stress path induced by compaction, the backfill was prepared by air-pluviated method and compaction method. A vibratory compactor was employed to densify the cohesionless fill. Experimental results of the earth pressures and stress path due to vibratory compaction are reported in Chapter 5.
1.3 Organization of Dissertation
This paper is divided into the following parts:
1.Review of theories regarding the earth pressure at-rest and past investigations about soil compaction. (Chapter 2)
2.Description of National Chiao Tung University non-yielding retaining-wall facility. (Chapter 3)
4.Experimental results of earth pressure and dynamic stress path due to vibratory compaction, and the Comparison of Theoretical and Experimental Stress Paths. (Chapter 5)
Chapter 2
Literature Review
To improve its engineering properties, contractors are generally required to compact the loose soils to increase their unit weights and reducing settlements. Previous studies associated with the compaction-induced effects such as the change of soil density, the change of stresses in the soil mass and mechanism of soils under compaction are discussed in this chapter.
2.1 Earth Pressure At–Rest
2.1.1 Coefficient of Earth Pressure At–Rest
As shown in Fig. 2.1(a), a soil element A located at depth z is compressed by
the overburden pressure σv =γz. During the formation of the deposit, the
element A is consolidated under the pressure σv. The vertical stress induces a
lateral deformation against surrounding soils due to the Poisson’s ratio effect. Over the geological period, the horizontal strain is kept to be zero and the surrounding soil would develop a lateral stress to counteract the lateral deformation. A stable stress state will develop that the principal stresses acts
1
σ and σ 3 on the vertical and horizontal planes, as shown in Fig. 2.1(b).
The soil in a state of static equilibrium condition is commonly termed as the
Ko condition. Donath (1891) defined the ratio of the horizontal stress σh to
v h o K σ σ = (2.1)
since σv = , then γz σh =Koγz, where γ is the unit weight of soil.
For an isotropic soil element shown in Fig. 2.2, if the soil behaved as an
ideal elastic material, based on the mechanics of materials, the lateral strain εy
can be expressed as:
( x z) y y E E σ σ ν σ ε = − + (2.2) or h ( h v) h E E σ σ ν σ ε = − + (2.3)
where E is the elastic modulus and ν is the Poisson’s ratio of the soil.
Base on the definition of the at-rest condition, the lateral strain would be
zero (εh= 0) under the application of stress state and the . Then the
Eq. 2.3 can be written as:
v o h K σ σ = h = 1 (Ko v − Ko v − v)=0 E σ ν σ νσ ε (2.4) ν ν − = 1 o K (2.5)
It should be mentioned that Eq. 2.5 is applicable for the isotropic and elastic materials only. However, the behavior of soil element is more complex and far
from these assumptions. It is evident that the relationship between Ko and
elastic parameter, ν of Eq. 2.5 is not practical for predicting in-situ horizontal
stress.
strength properties of a soil and Ko. The empirical relationship to estimate Ko of
coarse-grained soil is discussed in the following section.
Mesri and Hayat (1993) reported that Jaky (1944) established a relationship
between Ko and maximum effective angle of internal friction φ by analyzing a
talus of granular soil freestanding at the angle of repose. Jaky (1944) supposed
that the angle of repose is analogous to the angle of internal friction φ. This is
reasonable for a sedimentary, normally consolidated material. Jaky (1944)
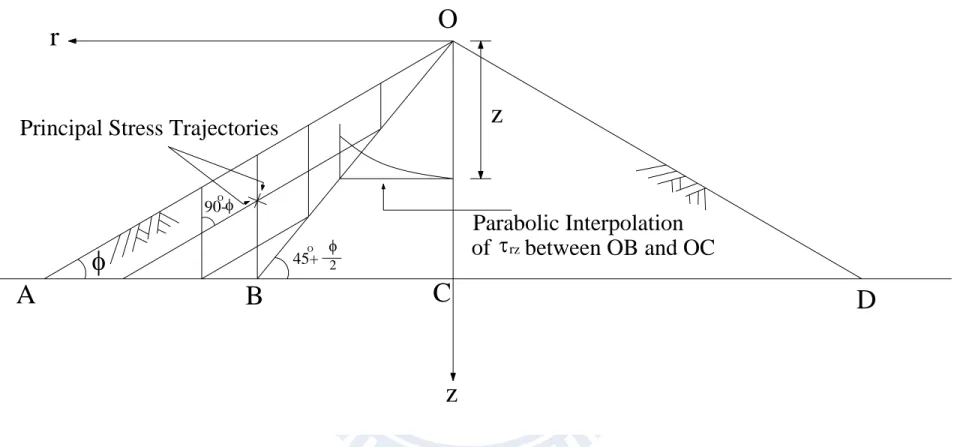
reasoned that the sand cone OAD in Fig. 2.3 is in a state of equilibrium and its
surface and inner points are motionless. The horizontal pressure acting on the vertical plane OC is the earth pressure at-rest. Slide planes exist in the inclined sand mass. However, as OC is a line of symmetry, shear stresses can not develop on it. Hence OC is a principal stress trajectory. Based on the equations
of equilibrium, Jaky expressed the coefficient of earth pressure at-rest Ko with
the angle of internal friction, φ :
φ φ φ sin 1 sin 3 2 1 ) sin 1 ( + + − = o K (2.6)
In 1948, Jaky presented a modified simple expression given by Eq. 2.7.
Ko =1−sinφ (2.7)
Mayne and Kulhawy (1982) reported that, the approximate theoretical
relationship for Ko for normally consolidated soils supposed by Jaky appears
valid for cohesionless soils. Using Jaky’s equation to estimate the in-situ lateral earth pressure is reliable for most engineering purposes.
2.2 Plane Strain Condition
In many soil mechanics problems, a type of state-of-stress that is often encountered is the plane strain condition. Referring to Fig. 2.4, for the strip footing the strain in the y direction at any point P in the soil mass is equal to
zero (εy = 0). The normal stress σy at all sections in the xz plane (i.e., normal to
the y axis) are the same,and the shear stresses (τyx = 0,τyz = 0) on these sections
are zero. Under a plane-strain state of stress, the normal and shear stresses on
the plane normal to the x axis are equal to σx and τxz. Similarly, the normal and
shear stress on the plane normal to the z axis are σz and τzx. The relationship
between the normal stresses can be expressed as
(
x zy ν σ σ
)
σ = + (2.8)
where ν is Poisson’s ratio.
2.3 Distribution of Contact Stress over Footings
In calculating the vertical stress σz acting between a footing and soil, it is
generally assume that the foundation of a structure is flexible and the contact
stress σx is uniform. The actual nature of the distribution of contact stress will
depend on the stiffness of the foundation and the soil on which the nature of the foundation is resting.
In Fig.2.5 (a), when a flexible foundation resting on a cohesionless soil, the distribition of contact pressure will be uniform. However, the maximum settlement will in the center of the foundation.This occus decause the soil located at the edge of foundation lacks lateral confining pressure and hence
will settle uniformly. The maximum contact pressure will be on the center of foundation.
2.4 Effects of Soil Compaction on Earth Pressure
Compaction of a loose soil can produce a stiff, settlement-free and less permeable mass. It is usually accomplished by mechanical means that cause the density of soil to increase. At the same time the air voids were reduced. It had been realized that the compaction of backfill material has important effects on the earth pressure in the soil mass.
Several theories and analytical methods had been proposed to analyze the residual lateral earth pressures induced by soil compaction. Most of these theories introduced the idea that compaction represented a form of over consolidation, where stresses resulting from a temporary or transient loading condition were retained following the removal of this load.
2.4.1 Study of Broms
Considering placement and compaction of horizontal layers of backfill adjacent to a non-deflection vertical wall, Broms (1971) proposed an analytical procedure based on the concept of hysteretic loading and unloading behavior. The stress path of hysteretic model that Broms’ analytical procedure based is
shown in Fig. 2.6a. Consideration of a soil element existed at some depth of
backfill, the initial horizontal stress state of the element can be illustrated as
σhi = Koσvi which is shown at point A in Fig. 2.6. When the compactor was
positioned immediately above the soil element, an increase of the vertical stress results in an increase in horizontal stress on the basis of the assumption of no
lateral yield. The stress state can be expressed as σhm = Koσvm (point B). As the
compactor moves off the fill, a subsequent decrease in vertical effective stress
(unloading) results in no lateral stress decrease until a limitation (Kr-line) is
reached (point C). The assumption is made that the maximum value of the horizontal stresses induced by compaction sustained until the vertical stress is
reduced below a critical value at point C as shown in Fig. 2.6. After that,
further unloading results in a decrease in horizontal stress through the stress
path as σhf = Krσvi (point D) until the original vertical stress is reached. Kr is
the coefficient of lateral earth pressure (Ko ≤ Kr ≤Kp, where K
p = coefficient
of passive earth pressure). Broms (1971) assumed that Kr equals to 1/Ko.
Compared with the residual horizontal stress, σhf and initial horizontal stress,
σhi at the same vertical effective stress. It is obviously that the σhf is much
higher than σhi. The process of soil compaction would result in a higher
residual horizontal stress exists.
For a deeper soil element, the vertical stress on the soil element increases
under the roller load from A’ to B’, and upon unloading the full maximum
horizontal load (σhm) is retained. Therefore, a critical depth zc will exist, where
the stress state after compaction will return exactly to point C’. The critical
depth zc can be expressed as follows:
r vm o c K K z γ σ = (2.10)
where σvm = γz + Δσv, γz is the vertical stress due to the weight of soil, and
Δσv is the temporary increase in vertical stress at depth z due to the compactor.
earth pressure involves incremental analysis of the stresses resulting from the placement and compaction of each layer of backfill. Compaction at any point is modeled as the application of a transient increase in vertical effective stress
(Δσv) caused by the compaction vehicle as determined by simple Boussinesq
elastic analysis, followed by subsequent removal of the transient vertical load. The horizontal effective stresses due to the transient compaction loading, as well as those due to surcharge increases as a result of fill placement, are then
determined by the model shown in Fig. 2.6.
Considering the effect of placing and removing a compactor at the surface of the fill, the distribution of lateral pressure due to compaction proposed by
Broms (1971) is shown in Fig. 2.7 (a). Before compaction is applied to the fill,
the soil element is under the condition of at-rest, and the horizontal pressure is
equal to Koσv (curve 1). The application of the compactor leads to an increase
in vertical stress which decreases with depth. The maximum horizontal
pressure can be calculated with Koσvm, where σvm equals to σv + Δσv and Δσv is
the increase in vertical stress at any depth due to the compactor (curve 2). As the compactor is removed, the backfill below the critical depth retains the increased horizontal stress and the fill above the critical depth reduces its
horizontal stress to Krσv (curve 3). Based on the above discussions, as the
backfill is compacted at the surface, the profile of the pressure distribution is
indicated by the shaded area in Fig. 2.7 (a).
In reality, compaction is carried out regularly on thin layers of fill up the back of the retaining wall. The residual lateral pressure distribution is then given by the locus of the point A as the surface of the fill moves upward. A
2.4.2 Study of Duncan and Seed
Duncan and Seed (1986) presented an analytical procedure for evaluation of peak and residual compaction-induced stresses either in the free field or adjacent to vertical,
non-deflecting soil-structure interfaces. This procedure employs a hysteretic Ko
-loading model shown in Fig. 2.8. The model is adapted to incremental analytical
methods for the evaluation of peak and residual earth pressures resulting from the placement and compaction of soil. When the surcharge is applied on the soil surface, it
will increase the vertical stress and the horizontal stress. In Fig. 2.8, as the virgin
loading is applied on the soil, both σv and σh increase along the Ko -line (Ko = 1-sinφ).
Nevertheless, when the surcharge is removed, σv and σh would decrease along the
virgin unloading path. As virgin reloading was applied again, the increment of earth pressure is less than that induced by the first virgin loading.
The hysteretic model may be applied to the analysis of compaction as represented by a transient, moving surficial load of finite lateral extent by directly modeling loading
due to increased overburden as an increase in vertical effective stress (Δσ’v). To model
compaction loading in terms of the peak virgin, compaction-induced horizontal stress
increase (Δσ’h,vc,p) is defined as the horizontal effective stress which would be induced
by the most critical positioning of the compactor. The Δσ’h,vc,p could be evaluated by
the simple elastic analysis if the soil had been previous uncompacted (if the soil had no “lock-in” residual stresses due to previous compaction). While the hysteretic model is
applied to the analysis of compaction loading cycle, the Δσ’h,vc,p should be transformed
to an equivalent peak vertical load increment (Δσ’v,e,p) calculated as
o p vc h p e v K ' , , ' , , σ σ = Δ Δ (2.11)
calculated lateral stress increase rather than directly calculated peak vertical stress
increase multiplied by Ko, Ka or some other coefficient. Seed and Duncan (1983)
concluded that either in the free field, or at or near vertical, nondeflecting soil/structure
interfaces, Δσ’h,vc,p resulting from surficial compaction loading can be calculated
directly by simple elastic analysis. The parameter of Poisson’s ratio, ν for surficial compaction loading may be chosen according to the empirically derived relationship
(0.5 ) 2 1 o o ν ν ν = + − (2.12) where o o o K K + = 1 ν Ko = 1-sinφ
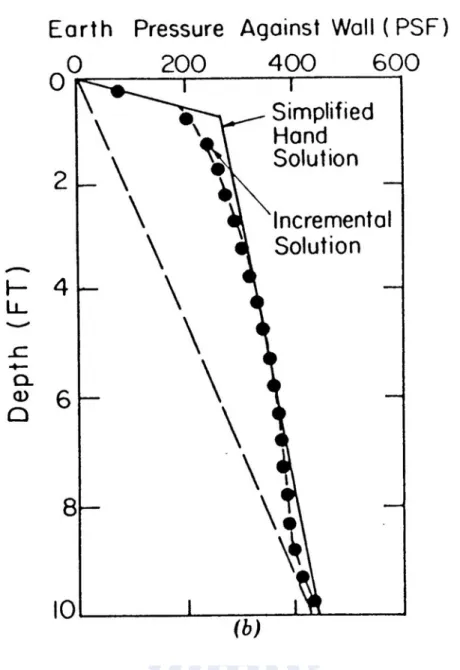
Seed and Duncan (1983) also brought up a simple hand calculation procedure which
results in good agreement with the incremental procedure described above. In Fig. 2.9,
it is apparent the simple hand solution has a good agreement with the incremental procedure.
2.4.3 Study of Peck and Mesri
Based on the elastic analysis, Peck and Mesri (1987) presented a calculation method to evaluate the compaction-induced earth pressure. The lateral pressure profile can be
determined by four conditions on σh, as illustrated in Fig. 2.10 and summarized in the
following.
1. Lateral pressure resulting from the overburden of the compacted backfill,
2. Lateral pressure limited by passive failure condition,
σh =tan2(45+φ/2)γz (2.14)
3. Lateral pressure resulting from backfill overburden plus the residual horizontal stresses, σh = − φ γz+ (5 φ −1)Δσh 4 1 ) sin 1 ( 1.2sin (2.15)
where Δσh is the lateral earth pressure increase resulted from the surface
compaction loading of the last backfill lift and can be determined based on the elastic solution.
4. Lateral pressure profile defined by a line which envelops the residual lateral pressures resulting from the compaction of individual backfill lifts. This line can
be computed by Eq. 2.16. σ φ (5 5 φ)γ 4 sin 1− − 1.2sin = Δ Δ z h (2.16)
Fig. 2.10 indicates that near the surface of backfill, from point a to b, the lateral pressure on the wall is subject to the passive failure condition. From b to c, the
overburden and compaction-induced lateral pressure profile is determined by Eq. 2.15.
From c the lateral pressure increases with depth according to Eq. 2.16 until point d is
reached. Below d, the overburden pressure exceeds the peak increase in stress by compaction. In the lower part of the backfill, the lateral pressure is directly related to the effective overburden pressure.
Chen and Fang (2008) reported some experiments in nonyielding retaining wall at National Chiao Tung University to investigate influence of earth pressure due to vibratory compaction. Air-dry Ottawa sand was used as backfill material. Vertical and horizontal stresses in the soil mass were measured in loose sand and compacted sand. Based on his test results, Chen and Fang (2008) proposed the following conclusions: (1) after compaction, the lateral stress measured near the top of backfill is almost identical to the passive earth pressure estimated with Rankine theory. The compaction-influenced zone rises with rising compaction surface. Below the compaction-influenced zone, the horizontal stresses converge to the earth pressure
at-rest, as indicated in Fig. 2.11 and Fig.2.12; (2) when total (static + dynamic) loading
due to the vibratory compacting equipment exceeds the bearing capacity of foundation soils, the mechanism of vibratory compaction on soil can be described with the bearing capacity failure of foundation soils; (3) the vibratory compaction on top of the backfill transmits elastic waves through soil elements continuously. For soils below the compaction-influenced zone, soil particles are vibrated. The passive state of stress among particles is disturbed. The horizontal stresses among soil particles readjust under the application of a uniform overburden pressure and constrained lateral deformation, and eventually converge to the at-rest state of stress.
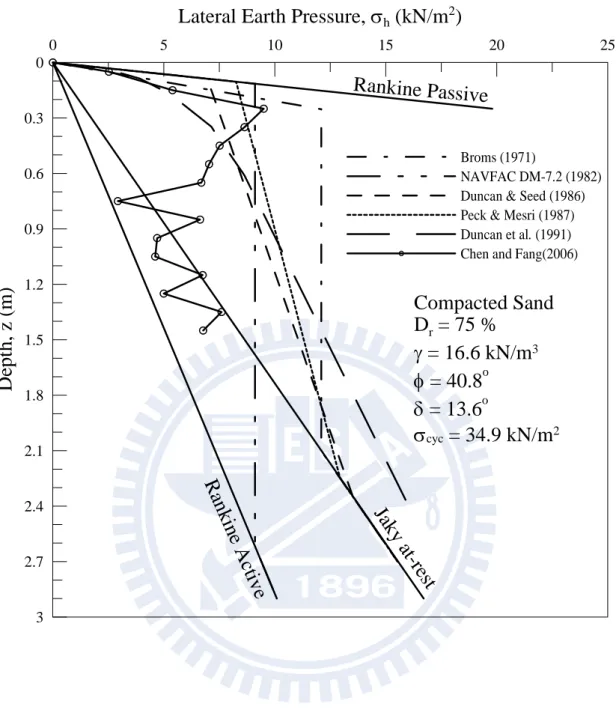
Chen’s test results were compared with the design recommendations proposed by NAVFAC DM-7.2 (1982), Duncan and Seed (1986), Peck and Mesri (1987), and
Duncan et al. (1991) as shown in Fig. 2.13. Parameter values used in the stress
calculation including the unit weight γ, relative Dr, internal friction angle φ, wall
friction angle δ, and cyclic compaction stress σcyc are shown in Fig. 2.13. The
horizontal pressure distribution suggested by the Navy Design Manual DM-7.2 was based on the analytical method proposed by Ingold (1979). The pressure distribution calculated with the method proposed by Duncan et al. (1991) was obtained from the
design chart for vibratory plates with a cyclic compaction stress q = 34.9 kN/m2 (5 psi).
In Fig. 2.13, Chen’s test data are in good agreement with the proposed design
methods. The horizontal stresses in the uppermost compacted lift are equal to or slightly less than the passive Rankine pressure. However, at a lower depth, the Chen’s test data are apparently lower than the calculated horizontal stresses. It is important that the application of Chen’s test findings are limited to estimating the horizontal stresses acting on a nonyielding wall induced by a small size vibratory hand tamper.
Chapter 3
Experimental Apparatus
To investigate the effects of vibratory compaction on the vertical stress σv
and horizontal stress σh in a cohesionless soil mass, the instrumented
non-yielding model retaining wall facility at National Chiao Tung University (NCTU) was used. This chapter introduced the NCTU non-yielding retaining wall facility and the vibratory compactor. Chen and Fang (2008) described the facility consist of three components: (1) model retaining wall; (2) soil bin; and (3) data acquisition system. The details of the foregoing apparatuses are described in the following sections.
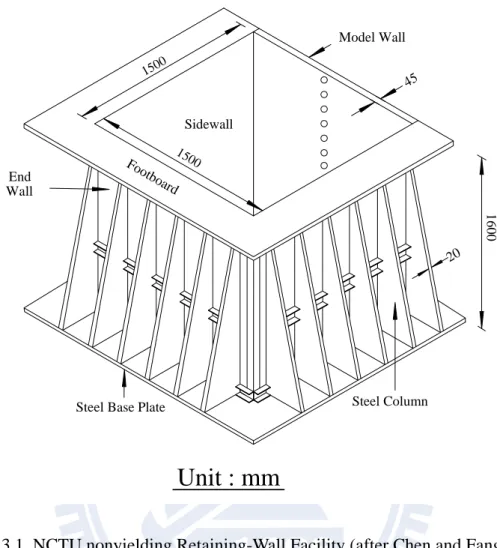
3.1 Model Retaining Wall
The model wall shown in Fig. 3.1 is 1,500 mm-wide, 1,600 mm-high, and 45
mm-thick. To achieve an at-rest condition, the wall material should be nearly rigid. It is hoped that the deformation of the model wall could be neglected with the
application of earth pressure. As indicated in Fig. 3.1, twenty-four 20 mm-thick
steel columns were welded to the four sidewalls to reduce any lateral deformation during loading. In addition, twelve C-shaped steel beams were also welded horizontally around the box to further increase the stiffness of the box.
3.2 Soil Bin
To simulate a plane strain condition for model test, the soil bin is designed to minimize the lateral deflection of sidewalls. In Fig. 3.1, the soil bin was fabricated of steel plates with inside dimensions of 1,500 mm ×1,500 mm ×1,600 mm.
Assuming a 1,500 mm-thick cohesionless backfill with a unit weight γ = 17.1
kN/m3, and an internal friction angle φ = 41o
was pluviated into the soil bin. A 45 mm-thick solid steel plate with a Young’s modulus of 210 GPa was chosen as the
wall material. The estimated deflection of the model wall would be only 1.22 × 10⁻³
mm. Therefore, it can be concluded that the lateral movement of the model wall is negligible and an at-rest condition can be achieved.
The end-wall and sidewalls of the soil bin were made of 35 mm-thick steel plates. Outside the steel walls, vertical steel columns and horizontal steel beams were welded to increase the stiffness of the end-wall and sidewalls. If the soil bin was filled with dense sand, the estimated maximum deflection of the sidewall would be
1.86 × 10⁻³ mm. From a practical point of view, the deflection of the four walls
around the soil bin can be neglected.
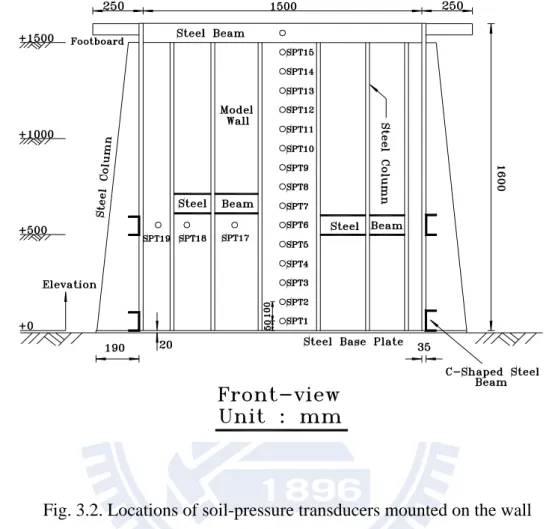
To investigate the distribution of horizontal earth pressure σh, soil pressure
transducers (SPT) were attached to the model wall as illustrated in Fig. 3.2. Fifteen
strain-gage-type transducers (Kyowa PGM-02KG, capacity = 19.62 kN/m2) were
arranged within the central zone of the wall. The soil pressure transducer with the
adapter is shown in Fig. 3.3. The diameter of the SPT sensing area is 12 mm. To
investigate the development of vertical stress σv in the backfill, another series of
soil pressure transducers (Kyowa BE-2KCM17, capacity = 98.1 kN/m2) were
arranged behind the model wall. The transducers were used to measure the
variation of vertical earth pressure σv during the filling and compaction process.
The soil pressure transducer buried in the backfill is shown in Fig. 3.4. The
diameter of the SPT sensing area is 22 mm.
3.3 Data Acquisition System
A data acquisition system was used to collect and store the considerable amount
of data generated during the tests. In the Fig. 3.5, the data acquisition system is
Computer. The analog signals from the sensors were filtered and amplified by the dynamic strain amplifiers. Then, the analog experimental data were digitized by an A/D-D/A card. The digital signals were then transmitted to the personal computer for storage and analysis.
3.4 Vibratory Compactor
To simulate compaction of backfill in the field, the vibratory compactor shown in Fig. 3.6 and Fig.3.7 was made by attaching an eccentric motor (Mikasa Sangyo, KJ75-2P) to a 225 mm ×225 mm steel plate. The mass of the vibratory compactor
is 12.1 kg. Fig. 3.8 shows that the eccentric force can be controlled by adjusting the
number of eccentric steel plates attached to the rotating shaft of motor. For this study, a total of sixteen eccentric plates (8+8) were used. The technical information
regarding the eccentric motor is listed in Table 3.1. It should be mentioned that the
distribution of contact pressure between the foundation and soil varies with the stiffness of the footing. If the footing is perfectly rigid, the static contact pressure on the footing increases from zero at the edge to a maximum at the center.
Chapter 4
Backfill and Interface Characteristics
The characteristics of the backfill, and the side wall friction are introduced in this chapter.
4.1 Backfill Properties
Air-dry Ottawa silica sand (ASTM C-778) was used as the backfill material in all experiments. Physical properties of the soil were summarized
in Table 4.1. Grain-size distribution of the backfill is shown in Fig. 4.1. The
major reasons to select Ottawa sand as the backfill material are listed below. 1. Its round shape, which avoids the effect of angularity of soil grains.
2. Its uniform distribution of grain size (coefficient of uniformity Cu = 1.5),
which avoids the effects due to soil gradation.
3. High rigidity of solid grains, which reduces possible disintegration of soil particles under loading.
4. Its high permeability, which allows fast drainage and therefore reduces water pressure behind the wall.
To establish the relationship between unit weight of backfill γ and its internal
friction angle φ , direct shear tests have been conducted. The shear box used has a
square (60 mm × 60 mm) cross-section, and its testing arrangement is shown in Fig. 4.2. Before shearing, Ottawa sand was air-pluviated into the shear box and
Chang (2000) established the relationship between the internal friction angle φ
and unit weight γ of Ottawa sand as shown in Fig. 4.3. It is obvious in the figure
that soil strength increases with increasing soil density. For the air-pluviated
backfill, the empirical relationship between soil unit weight γ and φ angle can be
formulated as follows
φ = 6.43γ- 68.99 (4.1)
where
φ = angle of internal friction of soil (degree)
γ = unit weight of soil (kN/m3)
Eq. (4.1) is applicable for γ= 15.45 ~ 17.4 kN/m3 only.
For compacted backfill, the following relationship can be formulated.
φ = 7.25γ- 79.51 (4.2)
Eq. (4.2) is applicable for γ= 15.8 ~ 17.05 kN/m3 only.
4.2 Side wall Friction
To constitute a plane strain condition for model wall tests, the shear stress between the backfill and the side walls should be minimized to nearly frictionless. To reduce the friction between side wall and backfill, a lubrication layer fabricated with plastic sheets was furnished for all experiments. Two types of plastic sheeting, one thick and two thin plastic sheets, were adopted to reduce the interface friction. All plastic sheets were hung vertically on the side walls before the backfill was
deposited as shown in Fig. 4.4.
Multiple layers of thin plastic sheets (without any lubricant) were used by McElroy (1997) for shaking table tests of geosynthetic reinforced soil (GRS) slopes. Burgess (1999) used three thin plastic sheets to reduce side wall friction in full-scale GRS wall tests. The wall friction angle was approximately 15° as
determined by the shear box tests. In this study, two thin (0.009 mm-thick) and one thick (0.152 mm-thick) plastic sheets were adopted for the earth pressure experiments. The friction angle developed between the plastic sheets and steel sidewall could be determined by the sliding block test. A schematic diagram and a photograph of the sliding block test proposed by Fang et al. (2004) are illustrated in Fig. 4.5. and Fig. 4.6. The side wall friction angle δsw for the sliding block test was
determined using the basic principles of physics.
As the inclination of the plate is increased, based on the equilibrium of forces, the sliding resistance T also increases until the driving force overcomes the resistance and the soil box starts to move. At this moment, the inclination angle of the plate to the horizontal is the interface friction angle δ that represents the
characteristics of the lubrication layers. Fig. 4.7. shows the variation of side-wall
friction angle δsw as a function of the normal stress σn for the plastic sheet method
(1 thick + 2 thin sheeting) used in this study. The measured side-wall friction angle
with this method is about 7.5°. It is clear in Fig.4.8. that the wall friction angle δsw
is nearly independent of the applied normal stress σn. This constancy is an
important advantage in establishing the input soil properties for analytical models that might be used to analyze the experimental results. For all experiments in this
paper, the lubrication layers were wall applied o two side walls as indicated in Fig.
4.4. The plastic sheets not only can help to reduce the friction force between the
side walls and the backfill, but also can help to reduce the reflection of elastic waves transmitted to the soil-wall boundaries during compaction.
4.3 Control of Soil Density
To achieve a uniform soil density in the backfill, Ottawa sand was deposited by air-pluviation method into the soil bin. The air-pluviation method had been widely used for a long period of time to reconstitute laboratory sand specimens. Rad and Tumay (1987) reported that pluviation is the method that provides reasonably homogeneous specimens with desired relative density. Lo Presti et al. (1992) reported that the pluviation method could be performed for greater specimens in less time.
Das (1994) suggested that relative densities of 15~50%, and 70~85% are defined as loose and dense condition, respectively. Ho (1999) established the relationship
among slot opening, drop height, and density as shown in Fig. 4.8.To achieve a
loose backfill (Dr = 32%), Chen (2003) adopted the drop height of 1 m and hopper
slot opening of 15 mm. In this study, to reduce the disturbance due to soil drooping, the drop height of 0.5 m and the hopper slot-opening of 10 mm were selected to
achieve the loose backfill. In Fig. 4.9 shows,the soil hopper that let the sand flow
through a calibrated slot opening at the lower end. A picture of the soil pluviating
processes is shown in Fig. 4.10.
4.3.2 Compacted Dense Sand
To simulate the backfill compacted in the field, the loose backfill was placed in five lifts. Each lift was pluviated into the soil bin, carefully leveled, then
compacted with a vibratory compactor shown in Fig.3.7. As indicated in Fig. 4.11,
the soil surface was divided into six lanes parallel to the face of the model wall, and each lane was compacted with the vibratory compactor with a pass of 70 seconds. Each compacted lift has a thickness of 0.3 m.
To observe the distribution of soil density in the soil bin, the soil density cups
were made. The soil density control cup made of acrylic is illustrated in Fig. 4.12.
and Fig. 4.13. During the preparation of soil specimen, density cups were buried in the soil mass at different elevations and different locations in the backfill as shown in Fig. 4.14 and Fig. 4.15. After the soil had been filled up to 1.5 m from the bottom of the soil bin, soil density cups were dug out from the soil mass carefully. Fig. 4.16(a) shows the density cup was placed in the soil bin at desired locationand Fig. 4.16(b) shows the mass of the cup and soil in the cap was measured with an
electrical scale. The distribution of soil density with depth for sand is shown in Fig.
4.17. For the air-pluviated loose sand, the mean unit weight γ is 15.6 kN/m2, the
mean relative density is Dr = 34.2 % with the standard deviation of 2.3%. For the
compacted dense sand, the mean unit weight γ is 16.6 kN/m2, the mean relative
density is about 73.8 % with the standard deviation of 2.68 %. Das (1994)
suggested that for the relative density 15 % ≤ Dr ≤ 50 % is defined as loose sand,
Chapter 5
Test Results and Discussion
This chapter reported experimental results regarding the vertical and horizontal earth pressures in air-pluviated loose sand and vibratory compacted dense sand. The stress path during compaction was carefully investigated. Based on the experimental evidence, a rational mechanism of vibratory compaction on cohesionless soil is proposed. For all experiments, the surface of backfill was finally horizontal and the backfill was filled up to 1.5 m above the base of the model wall.
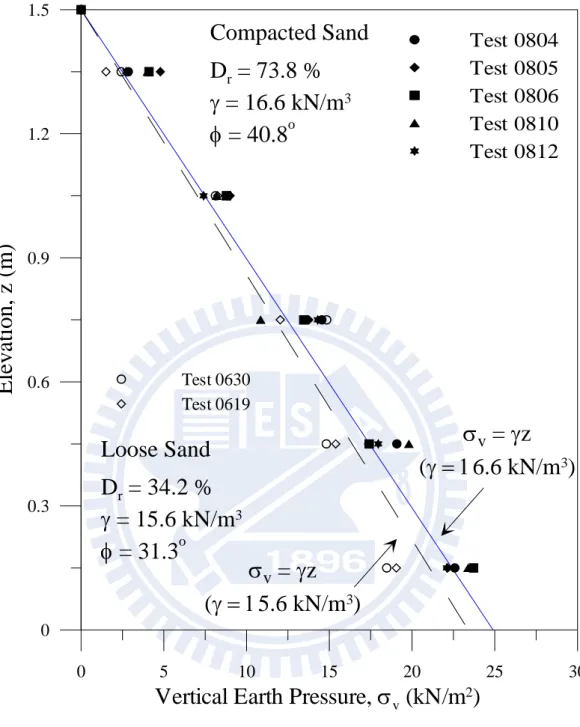
5.1 Stresses in loose sand
For comparison purposes, at the beginning of this study, experiments were conducted to investigate the stresses in an uncompacted loose backfill. The method of air-pluviation was adopted to prepare the backfill and the
relative density Dr achieved for the loose sand was 34.2 %. Fig. 5.1
illustrated stress σv showed the location of soil pressure transducers to
measure the distribution of vertical and horizontal earth pressure σh with
depth. SPT102, SPT105, SPT108, SPT111, and SPT114 were buried in the
soil mass to measure σv. The vertical earth pressure σv measured in the soil
mass was illustrated in Fig. 5.2 (a). In this figure, the vertical pressure σv
increased linearly with increasing depth z and the test data were in fairly
good agreement with the traditional equation σv = γz. In this study, unit
weight γ was 15.6 kN/m3 for the loose sand. The distribution of horizontal
earth pressure σh with depth was illustrated in Fig. 5.2(b). In the figure, the
approximately linear and was in good agreement with the Jaky’s equation. Mayne and Kulhawy (1982), Mesri and Hayat (1993) reported that Jaky’s equation was suitable for backfill in its loosest state. From a practical point of view, it was concluded that for a loose backfill, the vertical and horizontal earth pressure in the soil mass can be properly estimated with the
equation σv = γz and Jaky’s equation, respectively.
5.2 Dynamic Behavior of the Soil compactor
The vibratory compactor was made by attaching an electric motor (Mikasa Sangyo, KJ75-2P) to a steel plate as shown in Fig. 5.4. For investigating the variation of earth pressure in the compacted sand, it was necessary to measure the
forces applied to the sand by vibratory compactor. Fig. 3.8 showed the definition of
x-y-z axes for this study. The photograph of the accelerometer is shown in Fig. 5.3.
In the Fig. 5.4, the accelerometer was attached to the compactor to measure its
acceleration in x-direction ax. The measured acceleration in x-direction with time is
illustrated in Fig. 5.5(a). In the figure, the maximum acceleration ax was about ±
23.1 m/s2. The mass of the compactor was 12.1 kg. Since F = ma, the maximum
force in the x-direction shown if Fig. 5.5(b) Fx was ± 280 N.
In the Fig. 5.6, the accelerometer was attached to the compactor to measure its
acceleration in the y-direction. Fig. 5.7(a) showed the maximum acceleration in
y-direction ay was about ± 100.3 m/s2. Fig. 5.7(b) showed the maximum force in
y-direction Fy was ± 1320 N.
In the Fig. 5.8, the accelerometer was attached to the compactor to measure the
acceleration in z-direction. Fig. 5.9 showed the maximum acceleration in
z-direction az was about ± 140.37 m/s2. Fig. 5.9(b) showed the maximum dynamic
force was ± 1690 N. In Fig. 5.5, 5.7 and 5.9, the acceleration az (± 140.37 m/s) and
was generated mainly in y and z (vertical)direction.
Fz is the vertical force the vibratory compactor applied on the soil surface. The
Fz included the static dead load of the compactor W and the dynamic vertical force
Fz,dynamic.
Fz = W ± Fz,dynamic (5.1)
Where W = mg = 12.1 kg × 9.81 m/s2 = 119 N. It should be mentioned that only
positive force (compression) can be applied at the soil-compactor interface as
shown in Fig 5.9(b). As a result, in Fig. 5.10, the total force (static + dynamic) Fz
was about 1819 N. Assuming the distribution of contact pressure between the base
plate (0.225 m × 0.225 m) and soil is uniform, the peak cyclic vertical stress σz
applied on the surface of soil would be about 35750 N/m2.
5.3 Vertical and Horizontal Stresses in Sand during
Compaction
To obtain the expected dense condition, the loose backfill was placed and compacted in five lifts as shown in Fig. 5.1. Each lift in Fig. 4.11 was divided into
six lanes, and each 1.5 m long lane was compacted with the vibratory compactor
for 70 seconds. Fig. 5.11 showed the vertical pressure σv profile after the vibratory
compaction. In the figure, the measured vertical stresses increased with increasing
depth. It is clear in the figure that the vertical overburden pressure σv can be
properly estimated with the equation σv = γz. As compared with the σv for loose
sand, σv measured in dense sand was slightly greater because the compacted
backfill had a slightly higher unit weight. It is clear in the figure that the compaction process did not result in significant residual stress in the vertical direction. It may be concluded that the effect of vibratory compaction on the
The distributions of horizontal earth pressure against the nonyielding wall
after the compaction of soil from lift 1 to lift 5 were shown in Fig. 5.12 (a) to (e).
The test results reported by Chen and Fang (2008) were also plotted in Fig. 5.12. Each compacted lift is 0.3 m-thick after compaction. The variation of lateral earth pressure was monitored by the soil pressure transducer mounted on the wall. Before compaction, the earth pressure at-rest can be properly estimated with Jaky’s
equation. However, after vibratory compaction, it is clear in Fig. 5.12 (d) that an
extra horizontal stress Δσh,ci was induced by compaction. The
compaction-influenced zone indicated in Fig. 5.12 (d) extended from the
compacted surface to the depth of approximately 0.7 m. In Fig. 5.12 (c) to (e), the
compaction-influenced zone rose with rising compaction surface. It was interesting
to note in Fig. 5.12 (e) that, below the compaction-influenced zone the horizontal
stresses converged to the earth pressure at-rest based on Jaky’s equation. The lateral stress measured near the top of backfill was almost identical to the passive earth pressure estimated with Rankine theory. It should be emphasized that the
influence of vibratory compaction on the horizontal earth pressure σh in the soil
mass was quite significant.
5.4 Stress Paths for Filling and Compaction of Backfill
The stress path (σv versus σh) for a soil element under the filling and compaction
of the backfill for Test 0812 was shown in Fig. 5.13. Chen and Fang (2008) reported that the compaction process would not result in residual stress in the vertical direction. On the other hand, horizontal earth pressure near the top of the wall increased significantly due to compaction. The test data shown in Fig. 5.13 (a) to (e) were measured by SPT2, SPT5, SPT8, SPT11, and SPT14 respectively. In Fig. 5.13, the stress path F represented the stress variation due to the filling of the 0.3 m-thick Ottawa sand. Stress path C represents the stress variation due to the
Fig. 5.13(a) that at SPT2, compaction of lift1 caused theσh to increase as shown in
stress path C1. The compaction of lift 3 to lift 5 gradually brought the σh back to an
at-rest stress condition indicated by the K0-line. The Rankine passive pressure
(Kp-line) was apparently the upper bound of the induced lateral earth pressure. The
path C2 in Fig. 5.13(b), path C3 in Fig. 5.13(c), path C4 in Fig. 5.13(d), and path C5 in Fig. 5.13(e) indicated that the variation of lateral stress was mainly caused by the compaction of backfill near the pressure-transducer, not soil filling. Based on the test results of Test 0804. 0805, 0806, 0810, similar stress variation of stress path could be shown in Fig. 5.14. It appeared the test results were quite reproducible.
5.5 Dynamic Stress Paths during Compaction
The dynamic stress paths (σh vs. σv) due to vibratory compaction were
investigated in this study based on soil pressure transducer measurements. In Fig. 5.13(a) the stress path F1 represented the stress path due to the Filling of Lift 1.
The F1 stress path basically followed the K0-line as expected. The stress path C1
represented the Compacting of Lift 1. It should be mentioned that the loose backfill was placed and compacted in five Lifts, from Lift 1 to Lift 5 as shown in Fig. 5.15(d). Each compacted lift had a thickness of 0.3 m.
In Fig. 5.15(a) showed the soil surface of each lift was divided into six lanes parallel to the face of the model wall. Lane f compacted first and Lane a was compacted last. Each lane was densified with a pass having duration of 70 seconds.
In Fig. 5.13(a), the stress path C1 was approximated with a straight lone. However the dynamic stress path from point A to point B was much more complicated than a straight line. As illustrated in Fig. 5.15, the dynamic stress paths in the sandy backfills were discussed in three conditions: (1) compaction approaching SPT in x-direction; (2) compaction passing SPT in y-direction; and (3) compaction rising in z-direction.
5.5.1 Compaction Approaching SPT in x-direction
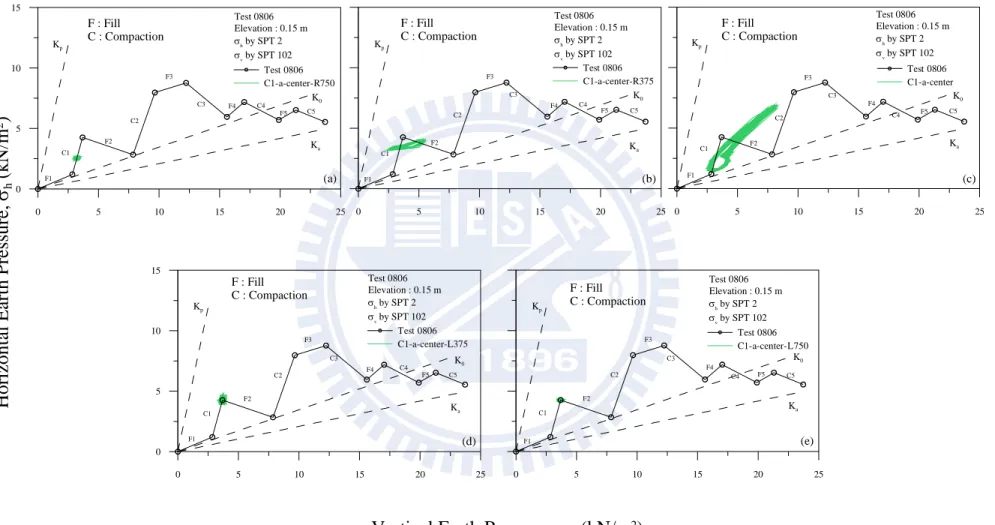
Fig. 5.16 showed the dynamic stress paths due to compaction of Lift 1 from lane f to lane a. Each lane was compacted with a pass of 70 seconds. To avoid confusion due the large amount of test data obtained, only the dynamic stress path measured from t = 34.5 to 35.5 s (duration = 1 second) was plotted in Fig. 5.16. In Fig. 5.16(a) the legend C1-f-center represented the Compaction of Lift 1 , on Lane f, at the center part of the lane. In this
figure, the horizontal stress σh and vertical stress σv were measure by SPT2
and SPT102, respectively, as illustrated in Fig. 5.1. Since Lane f was about horizontally 1.25 m away from the SPT, the dynamic stress path illustrated in Fig. 5.16(a) was insignificant. As the vibratory compactor moved from Lane f towed Lane a, the compaction-induced stresses increased.
In Fig. 5.16(f), the dynamic stress path due to the 1-second compaction on Lift 1 at the center part of Lane a was quite apparent. The stress paths
were bounded by the at-rest k0-line and passive kp-line. The shape of the
stress path was quite different from the stress paths proposed by Broms(1971), and Duncan and Seed(1986).
The dynamic stress path due to the compaction on Lift 2, 3, 4, and 5 were illustrated in Fig/ 5.17, 5.18, 5.19 and 5.20, respectively. In three figures, with the approaching of compaction toward the earth pressure transducers ,
the stress paths became more significant. No stress beyond the kp-line had
been observed in the experiments.
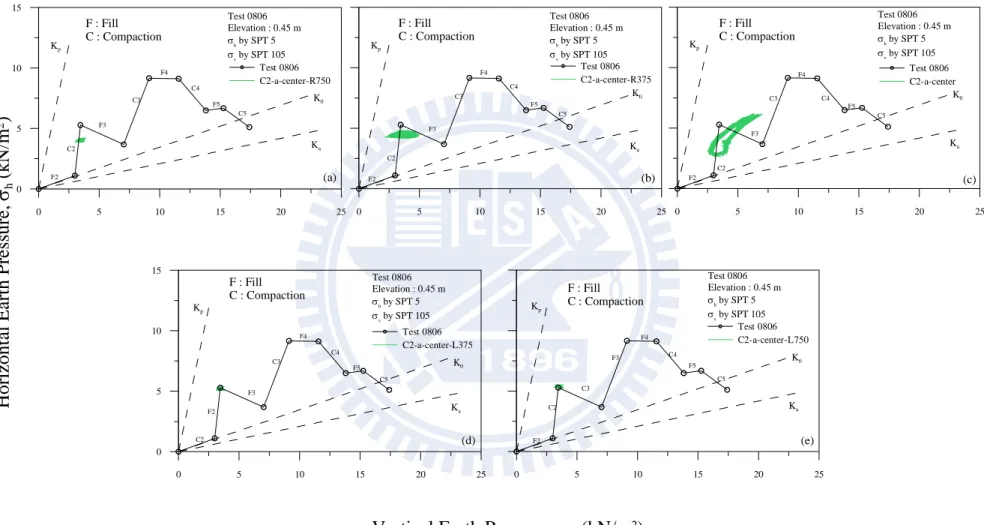
5.5.2 Compaction Passing SPT in y-direction
The stress paths due to the compaction on Lane a of Lift 1 were shown in Fig. 5.21. As illustrated in Fig. 5.15(b), only the stress path due to the
Center-L375; and (5) Center-L750 were reported. Center-R750 represented a location 750 mm to the right of the centerline of the model wall.
In Fig. 5.21(a), the measured stress path was not obvious, because the point of compaction was 750 mm to the right of SPT2 and SPT102. As the compaction moved toward the SPT in y-direction, the stress path became move apparent in Fig. 5.21(b). In Fig. 5.21(c), the compaction-induced stresses were most significant. The stress path was definitely not a straight line. As the point of compaction passed and moved away from the SPT, the effects compaction became less obvious.
The dynamic stress path due to the passing of compactor on Lane a of Lift 2, 3, 4 and 5 were indicated in Fig. 5.22, 5.23, 5.24 and 5.25, respectively. In three figures, as the compactor moved toward the SPT in y-direction, the stress paths became more apparent. No stress below the K0-line had been observed.
5.5.3 Compaction Rising in z-direction
Fig. 5.26 showed the dynamic stress paths measured at SPT2 and SPT102 due to compaction on the center part of Lane a of Lift 1 to Lift 5. In Fig. 5.26(a), since the vibratory compaction was only about 0.15 m right above the pressure transducers, the compaction-induced stress path was quite obvious. In Fig. 5.26(b), (c) and (d), the thickness of the overburden soil increased, and the compaction induced stress path became less significant. In Fig. 5.26(d), the compaction of Lift 5 draged the stress path to a point
below the K0-line. The stress paths due to compaction measured with SPT5
and SPT105, SPT8 and SPT108, SPT11 and SPT111, and SPT14 and SPT114 were shown in Fig. 5.27, 5.28, 5.29 and 5.30 respectively In Fig. 5.28(b), the 1-second dynamic stress path due to the compaction on the center part of Lane of Lift 4 was beyond the C4 stress path. It is possible
that the dynamic stress path may not be restrained and described by the simplified straight-line stress path
5.6 Comparison among Lifts and Tests
Fig. 5.31(a) to (e) showed the stress paths due to the 1-second compaction at the center of Lane a for Lift 1 to Lift 5. It was observed in these figures that the shape and the size of the dynamic stress paths obtained at five different lifts were quite similar. The dynamic stress path
had the shape of a comet. The comet moved between the K0-line and Kf-line.
Fig. 5.32 showed similar experimental results were obtained from Test 0805.
5.7 Comparison of Theoretical and Experimental Stress
Paths
Fig. 5.33 showed the theoretical stress path of hysteretic model proposed by Broms (1971). For a soil element existed at some depth of backfill, the initial
vertical stress due to the overburden soil was σvi. The initial horizontal stress was
σhi = K0σvi, which was represented by the point A in Fig. 5.33. When a heavy
compactor was positioned immediately above the soil element, following the
K0-line, an increase of the vertical stress resulted in an horizontal stress increase
based on the assumption of no lateral yield. The stress state can be expressed as
σhm = K0 σvm (point B). As the heavy compactor moved off the fill, a subsequent
decrease in σv (unloading) resulted in no σh decrease until a limitation (Kr-line)
was reached (point C). the assumption was made that the maximum horizontal
stress induced by compaction σhm sustained until the vertical stress is reduced
vertical stress σvi was reached. Broms (1971) assumed that Kr = 1/K0.
The experiment stress paths due to the filling of backfill of Lift 2 (F2) and the compaction of Lift 2 (C2) were shown in Fig. 5.33. It is interesting to note that the starting point A and ending point D lased on Brown’s theory, was similar to the starting point A and ending point E of the stress path C2. It was indicated that compaction would result in an increase of stress only in the horizontal direction, but not in the vertical direction.
The dynamic stress path due to on-cycle of compaction at the center part of Lane A was also illustrated in Fig. 5.33. It was obvious that the comet-shaped dynamic stress path was quite different from the stress path proposed by Broms. It should be mentioned that the stress path AB in Fig. 5.33 indicated the heavy compactor
generally 5~15 ton applied a large static vertical pressure σv on the surface of fill.
However, stress path BC represented the removal of the heavy compactor. The mass of hand-operated square-plate compactor used in this study was only 12.1 kg (W= 119 N). Fig. 5.9 showed the peak dynamic force applied on the surface of fill
was Fx = ± 280 N, Fy = ± 1320 N , and FZ = 1690 N. The vibratory compaction was
3-dimentional and was controlled by the cyclic loading instead of the dead-load of the compactor. This was probably the main reason why the dynamic stress path due to vibratory compaction was so different from Broms’ finding.
Chapter 6
CONCLUSIONS
This paper studied variation of earth pressure and dynamic stress path in compacted sand. Based on the experiment results, the following conclusions were drawn.
1. For a loose backfill, the horizontal earth pressure in the soil mass was in good
agreement with Jaky’s solutions. The vertical earth pressure in soil was near to the
equation σv = γz.
2. After compaction, the lateral stress measured near the top was almost identical to
the passive earth pressure estimated with Rankine theory. The effect of vibratory compactiom on the vertical pressure was insignificant.
3. After compaction, the thickness of the compaction-influenced zone rose with the
elevation of the compaction surface. Below the compaction-influenced zone, the horizontal stresses converged to the earth pressure at-rest based on Jaky’s equation.
4. As the area of the compaction approached the soil pressure transducer ( SPT ) in
x-direction ( perpendicular to the wall face), the dynamic stress path became more obvious when the compactor moved to the lane near the wall.
5. As the area of compaction passed the SPT in y-direction (parallel to the wall
surface), the maximum dynamic stress path was obvious when the compactor was right in front of the SPT.