Modeling and Optimization
of Wafer-level Spatial Uniformity
with the Use of Rational Subgrouping
Exp. no
Ruey-Shan Cuo Argon Chen
Department of Industrial National Taiwan University
Graduate Institute of Management Industrial Engineering
National Taiwan University
Time Temp NU, NU2 NU, (min) ("C) (%) (%) ("YO) Abstract
-
The goal of this paper is to present the rationalsubgrouping methodology f o r wodeling and optimization of the wafer-level spatial unformiry. In particular, o single- wafer rapid thermal oxidation of silicon process is used as the experimental platform. Response surface methodologv consisting of design of experiments and regression techniques was used to construct the models. Results show that spatial uniformity metric with rational data subgrouping is needed to provide a more complete picture on the thickness unformity. With different subgroupings of the oxide thickness data, we can ofer better strategies for process optimization.
INTRODUCTION
Spatial uniformity is an important issue in semiconductor manufacturing processes, especially when the feature size is getting smaller and the wafer size is getting larger. It generally presents challenges in modeling, optimization, and control. In the literature, Taguchi has treated variation reduction as a pure robustness problem and minimized its value through parameter dcsign [I]. Others have modeled the variation more specifically using the regression techniques. In particular, thc Single Response Surface and Multiple Response Surfaces mcthods are discussed and compared [2][3]. In this paper, we use Response Surface Method (RSM), which consists of statistical design of experiments and regression techniques. Although RSM is a well-known methodology in the statistical literature, in practice it is the rational subgrouping of data and the choice of response metric that make the applications and interpretations ineffective and difficult.
The goal of this paper is thcn to prcsent the rational subgrouping methodology for the modeling and optimization of the wafer-level spatial uniformity. A single-wafer rapid
thermal oxidation of silicon process is used as the experimental platform.
RAPID THERMAL OXIDATION
For the growth of gate dielectrics in ULSI, rapid thermal oxidation (RTO) of silicon is an alternative to the conventional furnace processing. When compared with the conventional furnace processing, RTO has the advantages of single-wafer processing, low thermal budget, shorter processing time, and easy integration into cluster tools. However, it also contains some potential disadvantages, such
Cheewee Liu A. Lin and M. Lan
Department of Electrical Graduate Institute of Engineering Industrial Engineering National Taiwan University National Taiwan University
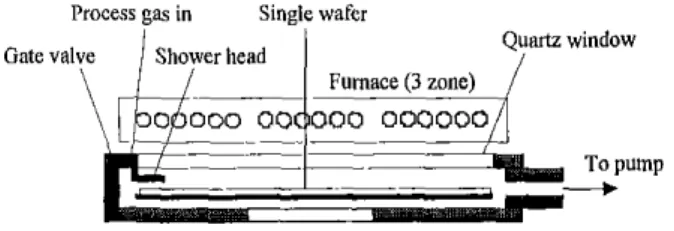
as inconsistent temperature measurement, lack of thorough knowledge of the process, process nonuniformity and control. To increase the manufacturability of the RTO process, we need to optimize the process through process modeling techniques and reduce the nonuniformity problem. The single-wafer RTO machine used in this research is illustrated in Figure 1,
Process gas in Single wafer
Gate Val\ &head
j
window0 000 00 000 OQOQQQ
Furnace (3 zone)
.___
\ L i i _ . - . l _ _ i l
Figure 1: Single-wafer rapid thermal chamber EXPERIMENTAL DESIGN FOR TWO FACTORS In the RTO experiments, two process factors, processing time and temperature, were first used as the experimental factors in modeling the wafer-level spatial uniformity. An experimental (3 by 3) design with nine puns was performed. In each run more than 200 oxide thickness data were collected. Tablc I illustrates the experimental design.
I I I I I
2 1 950 8.15 5.53 6.49
I
1000I
7.48I
4.75I
6.20 1Table 1 : Experimental design and nonuniformity values In the traditional modeling approach, we would calculate the wafer-level nonuniformity using the mekic in (I), in which Xis the mean of all the thickness data on each wafer. and s is
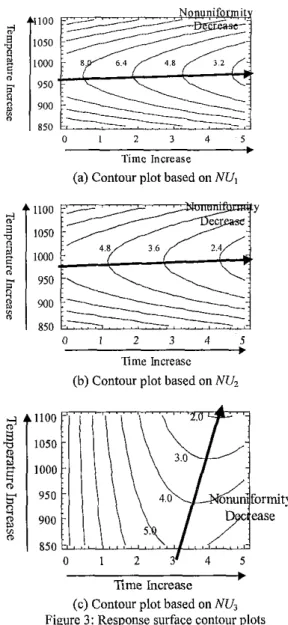
the estimated standard deviation (Figure 2a). With the nine nonuniformity values (Table I), a second-order modcl that correlates the wafer-level nonuniformity to the two factors are constructed using the stepwise regression technique. Equation (2) shows the constructed model. For optimization purpose, we can perfoim canonical and ridge analysis on the response equation. It is usually useful to plot the contour plot to help identify the optimal point. Figure 3a illustrates the plot.
N U , = 393.2355 -0.7929(Temp)
( 2 )
+
0.0004(Temp)2 - O.O012(Temp*
Time)With the same set of data, there is a second way to define the nonuniformity metric. As shown in Figure 2b, we divide the wafer into nine zones and calculate each zone's nonunifonnity. The wafer-level nonuniformity is then calculated by using Equation (3). Again we can consmct a second-order model as shown in (4). The contour plot is
shown in Figure 3b.
(3)
N U , = 25 1.7507
-
0.4999(Tenip)(4)
+
0.0003(Temp)2 - O.OOOS(Temp *Time)With the same set of data, there is a third way to define the nonuniformity metric. As shown in Figure Zc, we divide the wafer into nine zones and calculate each zone's average thickness. The wafer-level nonuniformity is then obtained by calculating the nonuniformity of these nine average thicknesses (Table 1). Equation ( 5 ) defmes the metric. Again we can construct a second-order model as shown in ( 6 ) , The contour plot is shown in Figure 3c.
1 9 - 1 "
9 ,=I n,=I
X = -
CX,
= -C
x, (if the same no. of points in all zones)N U , =s'/X ( 5 )
( 6 )
N U , = 9.1553 +0.3836(Time)' -0.0030(Temp*Time)
(c) N U , = s ' / X
Figure 2: Three ways to define the nonuniformity metrics Our goal is to optimize the process by minimizing the nonuniformity. However, with three different metrics and their corresponding response surface plots (Figures 3a
-
3c), we are led to very different optimization strategies. In fact, under certain assumptions it can be proved that the relationship between NUl, NU2 and NU, can be approximated by the following equation:(NU,),
=(NU,)'+(NU,)'
(7) The total nonuniformity of the surface (NUJ actuallyconsists ofhvo parts. The fust term (NU,) on the right hand side of (7) measures the surface roughness while the second term (NU,) is a measure of the surface unevenness. For an
even surface
(Z,
= 2, = ...
= X), the second tenn becomes zero. Then,NU,
*
NU,. For a surface with a slope (e.g.n,
5X,
5X3),
NU,
2NU,,
Time Increase
(a) Contour plot based on NUl
1100 Y 1050 1000 950 900 850 a 1 2 3 4 5 lime Increase (b) Contour plot based on NU,
t 950 onun formity 900 850 0 1 2 3 ' 4 5 Time Increase
(c) Contour plot based on
NU,
Figure 3: Response surface contour plotsFigure 3b reveals that a longer processing time can reduce the surface roughness while temperature should be set around 975OC to minimize the roughness. It can be also observed from Figure 3c that temperature does not have a significant effect on the surface evenness when processing time is less than three minutes. For processing time around three to four minutes, the higher the temperature the better the surface
k
evenness. Since processing time has significant effects on both the roughness and the evenness, it results in a steeper ridge and a governing direction on the response surface of the total nonuniformity ( N U l ) as shown in Figure 3a. In summary, when we optimize the process to minimize the thickness nonuniformity, the usual metric in (1) is not sufficient. Better strategies will be to minimize the roughness and the evenness separately. In general, the evenncss is usually optimized through a better process OS
equipment design while the roughness can be minimized by refming the process recipe.
EXPERIMENTAL DESIGN FOR FOUR FACTORS To ftnther study the effect of rational subgrouping on modeling wafer-level nonuniformity, four-factor design of experiments were performed. Taguchi L9 experimental design [I] was used to study four factors: processing time, temperature, pressure and flow rate. In each run more than 200 oxide thickness data were collected. Table 2 illustrates the experimental design.
Table 2: L9 design for four factors and nonuniformity values Using the same metrics as defined in Equations (I), (3), and
(9,
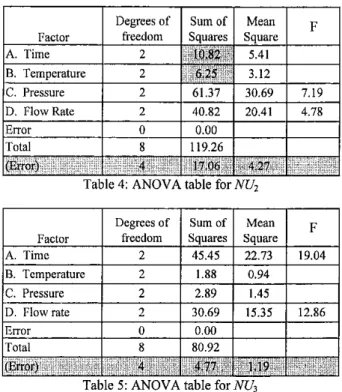
nonuniformity values are calculated and summarized in Table 2. We then calculate the main effects of each factor and plot the effect plots [ l ] in Figure 4. Here in Figure 4, processing time is indicated by A, temperature by B, pressure by C and flow rate by D. The corresponding ANOVA tables are also listed in Tables 3, 4, and 5 . Values in the graded areas represent the pooled errors.In this experiment, we confirm the following observations from the first experiment:
For processing time less than three minutes, temperature does not have a significant effect on the surface evenness (Figure 4 c, effect of B).
To minimize the roughness, temperature should be set around 950'-975' (Figure 4b, effect of B).
For processing time lasting for less than three minutes, its effect is especially strong on the evenness and is also significant on the roughness.
The effect on the total nonuniformity appears to be the sum of the effects on the roughness and unevenness.
Additional observations can be summarized as follows: For the total nonuniformity, processing time, pressure, and flow rate are all significant factors.
To minimize the nonuniformity, pressure should be set around 375 mbar.
Flow rate seems to have negative effects on both the evenness and the roughness.
Factor
A. Timc B. Temperature C. Pressure (a) Effect plot based on N U ,
freedom Squares Square 2 45.45 22.73 19.04 2 1.88 0.94 2 2.89 1.45 Q l . . ~ ~ , _._-_- ~ ~ LA
I
A 1 A 2 A 3 8 1 8 2 8 3 CL C 2 C 3 1 ~ _ ~ ~ . . _ _ _ ~.(b) Effect plot based on NU,
0 >--,-...----
“ I , , , , ,
,A 1 A 2 A 3 B L 8 2 8 3 Cl C Z C 3 D 1 D 2 0 3
(c) Effect plot based o%U3 Figure 4: Effect plots for the Lg experiment
Factor A. Time B. Temperature C. Pressure D. Flow rate
I
I
DegreesofI
SumofI
MeanI
I
FactorI
freedomI
SquaresI
SquareI
A. Time C. Pressure 2
I
61.37I
30.69I
7.19 D. Flow Rate 2 40.82 20.41 4.78 ErrorI
0I
Total-
-
8 ([:nor) 4I
17.06I
4 2 7I
I able 1 ANOVA [able ior A’(’?
I
I
Degreesof1
SumofI
MeanI
I
CONCLUSIONS
In conclusion, rational subgrouping will allow us to understand the wafer-level nonuniformity with two distinct features. One is the surface roughness and the other is the surface unevenness. Very different actions may be needed to improve the two different features. We also find in our study that it is dangerous to use the usual nonuniformity metric alone. Nonuniformity metrics with rational data subgrouping will be needed to provide a more complete picture on the wafer-level nonuniformity and better strategies to optimize the process.
REFERENCES [I].
[2].
M. Phadke, Quality Engineering Using Robust Design,
Prentice-Hall, 1989.
R. Guo and E. Sachs, “Modeling, Optimiztaion and Control of Spatial Uniformaity in Manufacturing Processes,” IEEE Transactions on Semiconductor Manufacturing, vo1.6, no.1, 1993.
[3]. T. Smith, B. Goodlin, and D. Boning, “Bias and Variance in Single and Multiple Response Surface Modeling,” 31d International Workshop on Statistical Metrology, Hawaii, 1996.
Table 3: ANOVA table for NU,