R E S E A R C H A R T I C L E
Open Access
Personal and behavioral correlates of total
and domain-specific sedentary behaviors
in older Taiwanese adults
Shao-Hsi Chang
1, Ming-Chun Hsueh
1*and Yung Liao
2Abstract
Background: Evidence of the harmful health effects of sedentary behavior is emerging; however, little is known about domain-specific sedentary behavior correlates. Thus, in this study, the personal and behavioral correlates of total and domain-specific sedentary behavior in older Taiwanese adults were identified.
Method: The sample comprised 1046 older adults (aged≥65 years). Cross-sectional data on self-administered personal behavioral variables and time spent engaging in domain-specific sedentary behavior were obtained using computer-assisted telephone-based interviews. Binary logistic regression analyses were performed.
Results: Those aged older than 75 years were less likely to have longer total sedentary, computer use, and transportation times. Compared to women, older men were more likely to have longer total sedentary and transportation times. Older adults with low educational levels were less likely to have longer total sedentary and computer use times but were more likely to have an excessive television (TV) viewing time (≥2 h/day). Older adults who lived alone and were overweight had a longer TV viewing time. Furthermore, unemployment was associated with an excessive TV viewing time and shorter transportation time. Older adults residing in nonmetropolitan areas had lower total sedentary, TV viewing, and computer use times. Older adults who engaged in insufficient leisure time physical activity were more likely to have longer total sedentary and transportation times.
Conclusions: Both common and distinct personal and behavioral factors were associated with total and domain-specific sedentary behavior. Interventions for reducing total and domain-specific sedentary behavior should focus on both common and distinct subgroups of the Taiwanese older population.
Keywords: Computer use, Transportation, Leisure time physical activity, Sitting, Sociodemographic, Taiwan, Older adults Background
Because the proportion of older adults is growing world-wide, health policymakers face substantial challenges in
promoting health among older adults [1]. The health
benefits of physical activity in older adults has been doc-umented broadly and consistently [2]. Recently, seden-tary behaviors (i.e., too much sitting, which is distinct from too little exercise) were revealed to be crucial for the cardio-metabolic health of older adults [3]. Further-more, research has indicated that older adults who regu-larly sit for prolonged durations have a higher risk of
obesity, metabolic syndrome, and all-cause mortality, in-dependent of moderate-to-vigorous and leisure time physical activity (LTPA) [4,5]. Sedentary behavior, a new research topic in public health, is distinct from insuffi-cient physical activity, and involves prolonged periods of sitting during activities that entail low levels of energy
expenditure (1.0–1.5 metabolic equivalents, METs) such
as television (TV) viewing, computer use, and the use of motorized transport [6]. Notably, previous studies have
evidenced that older populations (≥65 years) engage in
higher levels of sedentary time than younger populations [7]. Therefore, tailored and effective strategies to reduce sedentary behavior are required for disease prevention and health promotion among older adults.
* Correspondence:[email protected]
1Department of Physical Education, National Taiwan Normal University, 162, Heping East Road Section 1, Taipei, Taiwan
Full list of author information is available at the end of the article
© The Author(s). 2018 Open Access This article is distributed under the terms of the Creative Commons Attribution 4.0 International License (http://creativecommons.org/licenses/by/4.0/), which permits unrestricted use, distribution, and reproduction in any medium, provided you give appropriate credit to the original author(s) and the source, provide a link to the Creative Commons license, and indicate if changes were made. The Creative Commons Public Domain Dedication waiver (http://creativecommons.org/publicdomain/zero/1.0/) applies to the data made available in this article, unless otherwise stated.
According to a behavioral epidemiology framework, an in-depth understanding of the personal factors associated with sedentary behavior is critical for designing relevant policies and tailored interventions for at-risk populations [6]. A recent systematic review summarized evidence from numerous countries regarding the determinants of seden-tary behavior in older adults, and indicated that personal characteristics (e.g., age, gender, educational attainment, and living status) were associated with sedentary behavior [8]. However, previous studies have mainly focused on TV viewing time or total sedentary time [9–11]. Although the significance of domain-specific sedentary behavior was previously emphasized for the development of effective in-terventions [12], few studies have examined the associa-tions between personal factors and other domain-specific sedentary behaviors (e.g., computer use and use of motor-ized transport) [13]. Moreover, to the best of our know-ledge, only one study on older adults, which was conducted in Belgium, reported the existence of relation-ships between personal factors and different domain-spe-cific sedentary behaviors (i.e., TV viewing, computer use, and the use of motorized transport) [13]. At the time of writing, no study has investigated the personal factors re-lated to different domain-specific sedentary behaviors in older adults in Asia. Therefore, studies on sedentary be-havior among older adults living in different countries are warranted, because the relationship between personal at-tributes and sedentary behavior might vary according to culture and environment [7].
Older adults might have more time to allocate to physic-ally engaging leisure activities, and hence have many op-portunities to achieve and maintain the recommended levels of physical activity [14]. Moreover, LTPA is a critical behavioral factor in improving health in older adults [1]. Although LTPA was previously emphasized as playing a role in replacing sedentary behavior, and thus leading to superior physical functioning [15], the associations of LTPA with different sedentary behaviors in older adults re-main unclear [8]. In previous studies, several measures of LTPA have been revealed to have significant associations with sedentary behavior [9–11,15]; however, in one study, no association was observed between objectively-measured physical activity and sedentary behavior in older adults [16]. Therefore, considering the need to identify correla-tions between LTPA and different domain-specific seden-tary behaviors in older adults, the purpose of this study was to determine the associations of personal and behav-ioral factors with total and domain-specific sedentary be-haviors in older Taiwanese adults.
Methods
Participants
In May 2015, a cross-sectional survey was conducted by a telephone-based research service company in Taiwan
using a computer-assisted telephone interview system. Samples were randomly stratified by gender and munici-pality (i.e., Taipei City and Chiayi County). Sampling was performed using a random-digit-dialing telephone-based survey. With a sampling error of 3% and a confidence interval (CI) of 95%, 1068 older adults were required to achieve a sufficient sample size and statistical power. A total of 1714 older adults were interviewed, and 1095 of the interviewees completed the survey (response rate: 63.9%). The older adults were provided with a research statement that fully explained the purpose and content of the research, and verbal informed consent was ob-tained at the start of the telephone interviews. No incen-tive was offered to the respondents. This study protocol was approved by the Ethics Committee of the National Taiwan Normal University (201504HM004).
Sedentary behavior variables
The outcome variable was self-reported sedentary time, evaluated using the Measure of Older Adults’ Sedentary
Time questionnaire [17]. Respondents were asked seven
items in a 1-week recall questionnaire, in which they re-ported the total time spent performing each named ac-tivity in a sitting or reclining position over the prior week, excluding time spent sleeping. The activities were watching TV; using a computer; reading; socializing; traveling in a motor vehicle or on public transport; en-gaging in hobbies; and other sedentary activities. The
item “other sedentary activity time (open-ended
ques-tion)” was combined with the item regarding hobbies
be-cause participants often reported other sedentary
activities as hobbies in this study.
Personal variables
The personal variables included age (“65–74 years” or “≥75 years”), gender (“woman” or “man”), educational level (“college degree or higher” or “up to high school”), living status (“with family” or “alone”), job status
(“employed” or “unemployed”), residential area
(“metropolitan” or “nonmetropolitan”), and body mass index (BMI) status (“nonoverweight” or “overweight”). BMI, calculated according to self-reported height and weight, was measured as weight (kg) divided by squared
height (m2). BMI scores were based on self-reported
weight and height data and grouped into two categories: “nonoverweight” (< 24 kg/m2
) and“overweight” (≥24 kg/m2) using Taiwan-specific cutoff points for older adults [18].
Behavioral variables
LTPA was measured using the long version of the Taiwan International Physical Activity Questionnaire [19]. The participants were asked to recall the frequency and aver-age duration of leisure time vigorous-intensity activity, moderate-intensity activity, and walking performed within
the 7 days prior to the questionnaire. Questions included: “During the last 7 days, on how many days did you engage in the activities (vigorous/moderate/walking) in your leisure time?” and “How much time did you usually spend on one of those days engaging in such activities?” The total LTPA duration was classified as either sufficient (≥150 min/week) or insufficient (< 150 min/week) according to the physical activity guidelines for health benefits [20].
Statistical analysis
Data collected from the 1046 older Taiwanese adults who completed the entire survey were included in the analysis. Binary logistic regression analyses were per-formed to examine the relationships of each personal and behavioral variable with total and domain-specific sedentary behaviors. Both personal and behavioral corlates were entered simultaneously into the logistic re-gression model. Because the distribution of sedentary behavior was skewed, the total and domain-specific sed-entary behavior was dichotomized into two categories on the basis of the median values: total sedentary behav-ior (time spent watching TV, using the computer, read-ing, socializread-ing, using motorized transport, and engaging in hobbies) was categorized into durations of either < 4.1
or≥ 4.1 h/day. Specific domains, such as TV viewing was categorized into durations of either < 2 or≥ 2 h/day. Time spent using a computer was categorized into dura-tions of either 0 or > 0 h/day, whereas motorized trans-port time was categorized into durations of either < 0.3 or≥ 0.3 h/day. According to a review article [5], the asso-ciations of reading, socializing, and engaging in hobbies with health outcomes remain unexplored; therefore, these three domain-specific sedentary behaviors were ex-cluded from the analyses. AP value of <.05 was consid-ered statistically significant. All statistical analyses were performed using SPSS Version 24.0 for Windows. Results
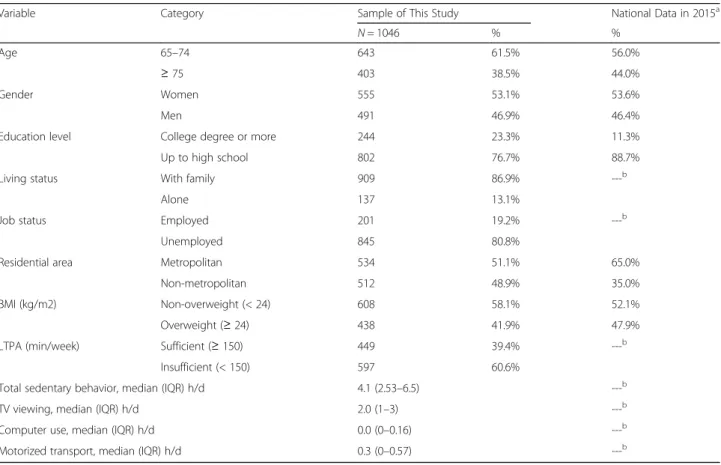
Table 1 lists the personal variables of the study partici-pants. In this study, 38.5% of the participants were older than 75 years, 46.9% were men, 76.7% received only a high school education, 13.1% lived alone, 80.8% were un-employed, 48.9% lived in nonmetropolitan areas, 41.9% were overweight, and 60.6% engaged in insufficient LTPA. Compared to national population data, the partic-ipants in this study had a similar proportion in terms of age (≥75 years: 38.5% vs. 44.0%) and gender (men: 46.9% vs. 46.4%). Other personal variables such as education
Table 1 Participant characteristics
Variable Category Sample of This Study National Data in 2015a
N = 1046 % %
Age 65–74 643 61.5% 56.0%
≥ 75 403 38.5% 44.0%
Gender Women 555 53.1% 53.6%
Men 491 46.9% 46.4%
Education level College degree or more 244 23.3% 11.3%
Up to high school 802 76.7% 88.7%
Living status With family 909 86.9% ---b
Alone 137 13.1%
Job status Employed 201 19.2% ---b
Unemployed 845 80.8%
Residential area Metropolitan 534 51.1% 65.0%
Non-metropolitan 512 48.9% 35.0%
BMI (kg/m2) Non-overweight (< 24) 608 58.1% 52.1%
Overweight (≥ 24) 438 41.9% 47.9%
LTPA (min/week) Sufficient (≥ 150) 449 39.4% ---b
Insufficient (< 150) 597 60.6%
Total sedentary behavior, median (IQR) h/d 4.1 (2.53–6.5) ---b
TV viewing, median (IQR) h/d 2.0 (1–3) ---b
Computer use, median (IQR) h/d 0.0 (0–0.16) ---b
Motorized transport, median (IQR) h/d 0.3 (0–0.57) ---b
a
Data source: [21,22]; b: National data could not be obtained for comparison with our data
BMI: body mass index; LTPA: leisure time physical activity; IQR: interquartile range. Total sedentary behaviors comprised time spent engaging in TV viewing, computer use, reading, socializing, use of motorized transport, and hobbies
level (college degree or more: 23.3% vs. 11.3%), residen-tial area (nonmetropolitan: 48.9% vs. 35.0%), and BMI status (overweight: 41.9% vs. 47.9%) were not similar to national population data.
The median total sedentary time was 4.10 (interquartile range [IQR]: 2.53–6.50) hours/day. The median duration of domain-specific behaviors of TV viewing, computer use, and the use of motorized transport were 2.00 (IQR: 1.00–3.00) hours/day, 0 (IQR: 0.00–0.16) hours/day, and 0.30 (IQR: 0.00–0.57) hours/day, respectively.
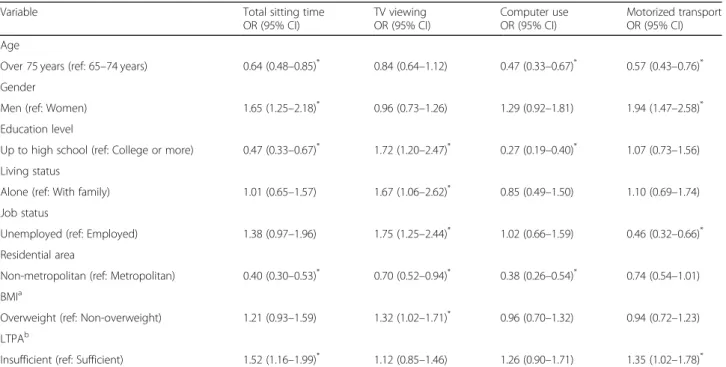
Table2 lists the associations of personal and behavioral variables with total and domain-specific sedentary behav-ior time, which was determined according to an adjusted logistic regression analysis. Participants aged older than 75 years were less likely to have longer total sedentary times (odds ratio [OR] = 0.64; 95% CI: 0.48–0.85), com-puter usage times (OR = 0.47; 95% CI: 0.33–0.67), and mo-torized transport usage times (OR = 0.57; 95% CI: 0.43– 0.76) compared with the participants aged between 65 and 74 years. Older men were more likely to have longer total sedentary (OR = 1.65; 95% CI: 1.25–2.18) and motorized transport usage times (OR = 1.94; 95% CI: 1.47–2.58) than older women. Older adults with a lower educational level (up to high school) were less likely to have longer total sedentary (OR = 0.47; 95% CI: 0.33–0.67) and computer usage times (OR = 0.27; 95% CI: 0.19–0.40) and were more likely to have longer TV viewing times (OR = 1.72; 95% CI: 1.20–2.47) than were those who received a college education or higher. Older adults who lived alone were more likely to have longer TV viewing times (OR = 1.67;
95% CI: 1.06–2.62) than those who lived with family. Older unemployed adults were more likely to have longer TV viewing times (OR = 1.75; 95% CI: 1.25–2.44) and were less likely to have higher motorized transport usage times (OR = 0.46; 95% CI: 0.32–0.66) than were those who were employed. Nonmetropolitan residents were less likely to have longer total sedentary times (OR = 0.40; 95% CI: 0.30–0.53), TV viewing times (OR = 0.70; 95% CI: 0.52–0.94), and computer use times (OR = 0.38; 95% CI: 0.26–0.54) than metropolitan area residents. Overweight older adults were more likely to have longer TV viewing times (OR = 1.32; 95% CI: 1.02–1.71) than nonoverweight older adults. Older adults with insufficient LTPA were more likely to have longer total sedentary (OR = 1.52; 95% CI: 1.16–1.99) and motorized transport times (OR = 1.35; 95% CI: 1.02–1.78) than were those with sufficient LTPA.
Discussion
This is one of the few studies in Asian countries examin-ing the associations of personal and behavioral variables with total and domain-specific sedentary behaviors in older adults. The results of this study support the results of previous studies of regarding the risks for of excessive total sedentary and TV viewing time in older adults [9–
11]. Furthermore, this study adds to the literature on
older populations at risk of poor health outcomes related to excessive computer and motorized transport usage times. The main finding of this study is that both com-mon and distinct personal and behavioral factors were
Table 2 Logistic regression analyses of personal and behavioral correlates of total and three domain-specific sedentary behaviors
Variable Total sitting time
OR (95% CI) TV viewing OR (95% CI) Computer use OR (95% CI) Motorized transport OR (95% CI) Age
Over 75 years (ref: 65–74 years) 0.64 (0.48–0.85)* 0.84 (0.64–1.12) 0.47 (0.33–0.67)* 0.57 (0.43–0.76)* Gender
Men (ref: Women) 1.65 (1.25–2.18)* 0.96 (0.73–1.26) 1.29 (0.92–1.81) 1.94 (1.47–2.58)* Education level
Up to high school (ref: College or more) 0.47 (0.33–0.67)* 1.72 (1.20–2.47)* 0.27 (0.19–0.40)* 1.07 (0.73–1.56) Living status
Alone (ref: With family) 1.01 (0.65–1.57) 1.67 (1.06–2.62)* 0.85 (0.49–1.50) 1.10 (0.69–1.74) Job status
Unemployed (ref: Employed) 1.38 (0.97–1.96) 1.75 (1.25–2.44)* 1.02 (0.66–1.59) 0.46 (0.32–0.66)* Residential area
Non-metropolitan (ref: Metropolitan) 0.40 (0.30–0.53)* 0.70 (0.52–0.94)* 0.38 (0.26–0.54)* 0.74 (0.54–1.01) BMIa
Overweight (ref: Non-overweight) 1.21 (0.93–1.59) 1.32 (1.02–1.71)* 0.96 (0.70–1.32) 0.94 (0.72–1.23) LTPAb
Insufficient (ref: Sufficient) 1.52 (1.16–1.99)* 1.12 (0.85–1.46) 1.26 (0.90–1.71) 1.35 (1.02–1.78)*
BMI, body mass index; LTPA, leisure time physical activity; OR, odds ratio, CI, confidence interval; ref., reference group.a
nonoverweight: BMI < 24 kg/m2
, overweight: BMI≥ 24 kg/m2;bInsufficient LTPA: < 150 min/week, sufficient LTPA:≥150 min/week;*statistical significance was set atP < .05
related to total and domain-specific sedentary behaviors (i.e., TV viewing, computer use, and use of motorized transport). These findings may have critical implications for policymakers and intervention designers by revealing that both common and distinct at-risk populations should be targeted when designing effective interventions to re-duce total and domain-specific sedentary behaviors.
The findings of this study regarding the association be-tween age and total sitting time are inconsistent with those of previous studies [11,13,14]. The present study demonstrated that adults aged 75 years or older had shorter total sitting times than did those aged 65–74 years. A possible reason for this inconsistency could be that, in the present study, the time spent on total seden-tary behavior was measured using a domain-specific
sed-entary behavior questionnaire [17], which may have
been less clear for older adults who may have difficulty remembering time spent engaging in each sedentary be-havior in daily life [23]. In addition, previous studies have indicated that computer and motorized transport usage times were higher for relatively younger older adults than for relatively older adults [13,24,25]. There-fore, for a more effective evaluation, future studies should measure domain-specific sedentary behavior ra-ther than total sedentary behavior. For the development of intervention methods, these results suggest that those targeting reductions in sedentary behavior should devote special attention to older adults aged 65–74 years, with a key focus on computer and internet usage and motor-ized transport usage times.
Regarding educational attainment, the results revealed that older adults with a lower educational level were more likely to have excessive TV viewing times and shorter computer use times than those educated to de-gree level or above. This was consistent with the results of previous studies on Japanese and Belgian older adults [9, 13]. One explanation is that lower education may be associated with limited knowledge (e.g., knowledge of computers and technology) and low income; thus, older adults with lower educational qualifications may have fewer leisure time options and a longer TV viewing time [9]. This suggests that for older adults with a lower edu-cation level, lower computer use times might have been
compensated by higher levels of TV viewing [13].
However, compared with older adults with higher educa-tion levels, older adults with lower educaeduca-tional levels were associated with a shorter total sedentary time in the present study. Older adults with a lower educational attainment might be at an increased risk of certain ad-verse health outcomes due to their higher levels of TV viewing time. Previous studies have linked higher levels of TV viewing to higher metabolic risks and being over-weight [3,4], whereas higher levels of computer use had a protective relationship with mental health and muscle
strength [5,26]. Based on these findings and our results, to reduce excessive TV viewing time, older adults with low educational levels should be prioritized for targeting in interventions. In addition, the findings of the present study indicate that lower educational levels are associ-ated with shorter total sedentary time. This finding is in-consistent with the study conducted by van Cauwenberg et al. [13], which indicated no association between edu-cational level and objective total sedentary time. There-fore, this finding cannot be completely explained, because evidence regarding the associations between educational levels and total sedentary time in older adult populations is limited. Intervention strategies to reduce total sitting time among older adults with higher educa-tional level remain difficult to identify. Future studies should further examine the sedentary behavior of older adults with higher educational levels.
Regarding job and living statuses, the current results in-dicated that unemployed older adults had longer TV view-ing times and a shorter motorized transport usage times. Additionally, we also revealed that that the older adults who lived alone had longer TV viewing times. These re-sults were similar to those previous studies [8, 9]. Taken together, these results indicated that older adults who are unemployed and live alone may be more likely to have limited social interactions (e.g., participation in volunteer activities), which may have caused prolonged sitting at home, resulting in a shorter motorized transport usage time; however, watching TV may have compensated for low levels of social interaction [9, 10]. This further sup-ports the idea that TV viewing may act as a replacement for intimate social interactions [27]. Therefore, social en-vironment concerns (i.e. social enen-vironment, community networks, and social support) should be considered in the development of intervention techniques for the preven-tion of excessive TV viewing for older adults who were unemployed and live alone. However, future studies should also examine the social environmental factors related to different domain-specific sedentary behaviors in older adults.
Regarding area of residence, older adults living in non-metropolitan areas exhibited less total sedentary behav-ior as well as less TV viewing and computer use than those living in metropolitan areas. The present results support those of previous studies in Western countries [10,24,28]. This may also explain the finding that non-metropolitan older adults were more likely to spend less
time performing indoor activities [29]. For example,
many older Taiwanese adults who live in rural areas are self-employed as farmers or aquaculture workers; these occupations might encourage older adults who live in rural areas to perform more work-related activities in their daily life than urban older adults. Therefore, for older adults living in metropolitan areas who engage in
excessive TV viewing, interventions could focus on the substitution of light activities for sitting, which has been associated with superior physical health.
Regarding BMI, older overweight adults had a higher likelihood of watching TV for 2 h/day than did the nono-verweight older adults. This was consistent with the results of previous studies [4,9]. In addition, no consider-able association was observed between BMI and total sit-ting time during computer and motorized transport usage. These results contribute to the literature concerning the contexts and subdomains of sedentary behaviors [8]. Inter-estingly, the relationship between BMI and other seden-tary behaviors (i.e., computer use and use of motorized transport) appears to be weak. However, being overweight is a risk factor for type 2 diabetes, cardiovascular disease, metabolic syndrome, cancer, and all-cause mortality [30]. These results also have implications for policy makers or intervention designers to develop effective strategies to minimize TV viewing for older overweight adults. Reverse causality should be considered in the context of the present study, because the association between TV view-ing and overweight may be bidirectional (i.e. excessive TV viewing my cause higher BMI, and higher BMI may cause more TV viewing).
Regarding LTPA status, older adults with insufficient LTPA times had higher total sedentary times. Consistent with previous Japanese and Canadian studies, lower physical activity was correlated with prolonged sitting time in older adults [9.11]. Finally, the results evidenced that older adults who lacked engagement in LTPA had a higher likelihood of spending more time using motor-ized transport. This result was similar to that of a previ-ous study, which determined that adults with insufficient activity levels (< 150 min/week) may spend more time driving a car [31]. Therefore, promoting LTPA and phys-ically demanding transport may be acceptable and ap-propriate approaches to replacing motorized transport and maintaining active living in older adults. Future studies should devise a favorable strategy for encour-aging older adults to use physically demanding trans-port, such as walking or cycling, to reduce motorized transport time.
Several limitations should be considered when interpret-ing the current findinterpret-ings. First, because the distribution of dependent variables was skewed, this dichotomization in-evitably resulted in a loss of information, and the median split implies that the findings are specific to the range of sitting times observed in the current study. Second, the cross-sectional study design limited the conclusions re-garding the causality of the observed relationships of per-sonal and behavioral factors with sedentary time. Third, to estimate domain-specific sedentary behavior, this study re-lied on self-reported measures that are susceptible to er-rors resulting from different interpretations of the
questions [17, 23]. These measurement errors may have caused bias among the associations observed, leading to an underestimation of the true associations. Fourth, the study data did not constitute a nationally representative sample, because the responses were limited to two local-ities and the study relied on a telephone-based survey. Fifth, other personal variables, such as household income [7, 9] and health status [11], were not measured, which may have affected the results because limited socioeco-nomic resources and poor health status may result in re-duced physical activity and outdoor activity. Sixth, including segments of the population that did not have a household telephone (approximately 7.1% in 2015) was impossible [32]. Moreover, compared with national data, the respondents of this study had higher educational levels, a higher proportion of participants lived in nonmet-ropolitan areas, and there was a lower prevalence of being overweight. Thus, the results in the present study may not be applicable to the general population.
Conclusions
Both common and different personal and behavioral fac-tors were associated with total and domain-specific seden-tary behavior (TV viewing, computer use, and motorized transport usage). Our findings highlight the potential for tailored interventions to reduce total and domain-specific sedentary time according to the needs of different per-sonal and behavior subgroups of the older adult popula-tion. To reduce total sedentary time, older adults aged 65–74 years, male, older adults with higher education levels, older adults in metropolitan areas, and older adults with insufficient LTPA are crucial target groups. To re-duce TV viewing time, older adults who had lower educa-tion levels, lived alone, were unemployed, resided in metropolitan area, or were overweight could be consid-ered as crucial target groups when developing interven-tions. To address higher volumes of computer use, particular attention should be given to older adults aged 65–74 years, those with higher education levels, and those who residing in metropolitan areas. When developing in-terventions targeting reductions in sitting when driving a car or taking public transport, special attention should be devoted to older adults aged 65–74 years, those who are male, those without employment, and those with insuffi-cient LTPA. Our findings provide valuable starting points for determining the most appropriate programs and pol-icies to address total and domain-specific sedentary behav-iors as a health risk among older adults. Future studies should examine which approaches are the most accept-able, feasible, and effective for reducing total and domain-specific sedentary time among older adults.
Abbreviations
BMI:Body mass index; CI: Confidence interval; Ref: referent group; IQR: Interquartile range; LTPA: Leisure time physical activity; OR: Odds ratio
Acknowledgements
This work is supported by“Higher Education Sprout Project” of the National Taiwan Normal University and the Ministry of Education, Taiwan, R.O.C.
Funding
MCH had a personal grant from the Ministry of Science and Technology of Taiwan (MOST 106–2410-H-003-144-MY2). The Ministry of Science and Technology of Taiwan was not involved in the study design, data collection, analysis, interpretation and writing the manuscript.
Availability of data and materials
The dataset used and analyzed during the current study are available from the corresponding author on reasonable request.
Authors’ contributions
SHC performed all analyses and wrote most parts of the manuscript. MCH and YL participated in the study development and data collection. SHC, MCH, and YL co-wrote, edited, and rewrote the manuscript sections on multiple occasions. MCH and YL critically revised the manuscript. All authors read and approved the final manuscript.
Ethics approval and consent to participate
This study protocol was approved by the Ethics Committee of the National Taiwan Normal University (201504HM004). Because of no sensitive questions or personal information, this telephone-based survey has been evaluated as minimal risk that qualify for a verbal consent process by Research Ethics Committee of National Taiwan Normal University. The process of verbal consent was documented including logging the date, time, and name of a caller, a note that the prescribed script was used, and a record of the participant’s response.
Consent for publication Not applicable.
Competing interests
The authors declare that they have no competing interests.
Publisher’s Note
Springer Nature remains neutral with regard to jurisdictional claims in published maps and institutional affiliations.
Author details
1Department of Physical Education, National Taiwan Normal University, 162, Heping East Road Section 1, Taipei, Taiwan.2Department of Health Promotion and Health Education, National Taiwan Normal University, Taipei, Taiwan.
Received: 22 February 2018 Accepted: 20 November 2018
References
1. World Health Organization. Global age-friendly cities: a guide. Geneva: World Health Organization; 2007.
2. American College of Sports Medicine, Chodzko-Zajko WJ, Proctor DN, Fiatarone Singh MA, Minson CT, Nigg CR, et al. American College of Sports Medicine position stand: exercise and physical activity for older adults. Med Sci Sports Exerc. 2009;41(7):1510–30.
3. Gardiner PA, Healy GN, Eakin EG, Clark BK, Dunstan DW, Shaw JE, et al. Associations between television viewing time and overall sitting time with the metabolic syndrome in older men and women: the Australian diabetes, obesity and lifestyle study. J Am Geriatr Soc. 2011;59(5):788–96.
4. Inoue S, Sugiyama T, Takamiya T, Oka K, Owen N, Shimomitsu T. Television viewing time is associated with overweight/obesity among older adults, independent of meeting physical activity and health guidelines. J Epidemiol. 2012;22:50–6. 5. de Rezende LF, Rey-López JP, Matsudo VK, do Luiz O. Sedentary behavior
and health outcomes among older adults: a systematic review. BMC Public Health. 2014;14:333.
6. Owen N, Healy GN, Matthews CE, Dunstan DW. Too much sitting: the population health science of sedentary behavior. Exerc Sport Sci Rev. 2010;38(3):105–13. 7. Rhodes RE, Mark RS, Temmel CP. Adult sedentary behavior a systematic
review. Am J Prev Med. 2012;42(3):e3–e28.
8. Chastin SF, Buck C, Freiberger E, Murphy M, Brug J, Cardon G, et al. Systematic literature review of determinants of sedentary behaviour in older adults: a DEDIPAC study. Int J Behav Nutr Phys Act. 2015;12:127.
9. Kikuchi H, Inoue S, Sugiyama T. Correlates of prolonged television viewing time in older Japanese men and women. BMC Public Health. 2013;13:213. 10. Van Cauwenberg J, De Donder L, Clarys P. Relationships of individual, social,
and physical environmental factors with older adults’ television viewing time. J Aging Phys Act. 2014;22(4):508–17.
11. Dogra S, Stathokostas L. Correlates of extended sitting time in older adults: an exploratory cross-sectional analysis of the Canadian community health. Int J Public Health. 2014;59:983–91.
12. Owen N, Sugiyama T, Eakin EE. Adults’ sedentary behavior determinants and interventions. Am J Prev Med. 2011;41(2):189–96.
13. Van Cauwenberg J, Van Holle V, De Bourdeaudhuij I, Owen N, Deforche B. Diurnal patterns and correlates of older Adults’ sedentary behavior. PLoS One. 2015;10(8):e0133175.
14. Godfrey A, Lord S, Mathers J, Burn D, Rochester L. The association between retirement and age on physical activity in older adults. Age Ageing. 2014; 43(3):386–93.
15. Balboa-Castillo T, León-Muñoz LM, Graciani A, Rodríguez-Artalejo F, Guallar-Castillón P. Longitudinal association of physical activity and sedentary behavior during leisure time with health-related quality of life in community-dwelling older adults. Health Qual Life Outcomes. 2011;9:47. 16. Lord S, Chastin SFM, McInnes L, Little L, Briggs P, Rochester L. Exploring
patterns of daily physical and sedentary behaviour in community-dwelling older adults. Age Ageing. 2011;40:205–10.
17. Gardiner PA, Clark BK, Healy GN. Measuring older adults’ sedentary time: reliability, validity, and responsiveness. Med Sci Sports Exerc. 2011;43(11):2127–33. 18. Health Promotion Administration, Ministry of Health and Welfare. Body Mass
Index. Available online:http://health99.hpa.gov.tw/OnlinkHealth/Onlink_BMI. aspx. (accessed on 31 January 2018).
19. Liou YM, Jwo CJ, Yao KG, Chiang LC, Huang LH. Selection of appropriate Chinese terms to represent intensity and types of physical activity terms for use in the Taiwan version of IPAQ. J Nurs Res. 2008;16:252–63.
20. World Health Organization. Global recommendations on physical activity for health. Geneva: World Health Organization; 2010.
21. Department of Household Registration, Ministry of the Interior. Population Aged 15 and Over by Age, Sex and Educational Attainment. Available online:https://www.ris.gov.tw/346(accessed on 31 January 2018). 22. Health Promotion Administration, Ministry of Health and Welfare. Percentage
distribution of Body Mass Index(BMI). Available online:https://olap.hpa.gov.tw/ en_US/Index.aspx?menu=-1&vid=1(accessed on 31 January 2018). 23. Wijndaele K, DE Bourdeaudhuij I, Godino JG. Reliability and validity of a
domain-specific last 7-d sedentary time questionnaire. Med Sci Sports Exerc. 2014;46(6):1248–60.
24. Banks E, Jorm L, Rogers K, Clements M, Bauman A. Screen-time, obesity, ageing and disability: Fındings from 91,266 participants in the 45 and up study. Public Health Nutr. 2011;14(1):34–43.
25. Harvey JA, Chastin SF, Skelton DA. Prevalence of sedentary behavior in older adults: a systematic review. Int J Environ Res Public Health. 2013;12:6645–61. 26. Hamer M, Stamatakis E. Screen-based sedentary behavior, physical activity,
and muscle strength in the English longitudinal study of ageing. PLoS One. 2013;8(6):e66222.https://doi.org/10.1371/journal.pone.0066222.
27. van der Goot M, Beentjes JWJ, Van Selm M. Meanings of television in older adults’ lives: an analysis of change and continuity in television viewing. Ageing Soc. 2012;32:147–68.https://doi.org/10.1017/S0144686X1100016X. 28. van Uffelen JG, Heesch KC, van Gellecum YR, Burton NW, Brown WJ. Which
older women could benefit from interventions to decrease sitting time and increase physical activity? J Am Geriatr Soc. 2012;60(2):393–6.https://doi. org/10.1111/j.1532-5415.2011.03792.x.
29. Arnadottir SA, Gunnarsdottir ED, Lundin-Olsson L. Are rural older Icelanders less physically active than those living in urban areas? A population-based study. Scand J Public Health. 2009;37(4):409–17.
30. Visscher TL, Seidell JC. The public health impact of obesity. Annu Rev Public Health. 2001;22:355–75.
31. Ding D, Gebel K, Phongsavan P, Bauman AE, Merom D. Driving: a road to unhealthy lifestyles and poor health outcomes. PLoS One. 2014;9(6):e94602. 32. Report on the Survey of Family Income and Expendture. Directorate
General of Budget, Accounting and Statistics: Taipei, Taiwan. 2015.