基於腦波之駕駛員認知反應估測及其在安全駕駛的應用
140
0
0
全文
(2) 基於腦波之駕駛員認知反應估測 及其在安全駕駛的應用 EEG-Based Assessment of Driver Cognitive Responses and Its Application to Driving Safety Student: Ruei-Cheng Wu Advisor: Dr. Chin-Teng Lin. 研 究 生:吳瑞成 指導教授:林進燈 博士. 國 立 交 通 大 學 電 機 與 控 制 工 程 學 系 博 士 論 文 A Dissertation Submitted to Department of Electrical and Control Engineering College of Electrical Engineering and Computer Science National Chiao Tung University in partial Fulfillment of the Requirements for the Degree of Doctor of Philosophy in Electrical and Control Engineering July 2005 Hsinchu, Taiwan, Republic of China. 中華民國九十四年七月.
(3) 博碩士論文授權書 本授權書所授權之論文為本人在 國立交通大學 大學(學院) 電機與控制工程 系所 _______組_九十四__學年度第_二_學期取得_博_士學位之論文。 論文名稱:_基於腦波之駕駛員認知反應估測及其在安全駕駛的應用_____ 指導教授:_林進燈 博士________________________ 1.■同意. □不同意. 本人具有著作財產權之上列論文全文(含摘要)資料,授予行政院國家科學委員會科學技 術資料中心(或改制後之機構),得不限地域、時間與次數以微縮、光碟或數位化等各種 方式重製後散布發行或上載網路。 本論文為本人向經濟部智慧財產局申請專利(未申請者本條款請不予理會)的附件之 一,申請文號為:______________,註明文號者請將全文資料延後半年再公開。 2.■同意. □不同意. 本人具有著作財產權之上列論文全文(含摘要)資料,授予教育部指定送繳之圖書館及國 立交通大學圖書館,基於推動讀者間「資源共享、互惠合作」之理念,與回饋社會及學 術研究之目的,教育部指定送繳之圖書館及國立交通大學圖書館得以紙本收錄、重製與 利用;於著作權法合理使用範圍內,不限地域與時間,讀者得進行閱覽或列印。 本論文為本人向經濟部智慧財產局申請專利(未申請者本條款請不予理會)的附件之 一,申請文號為:______________,註明文號者請將全文資料延後半年再公開。 3.■同意. □不同意. 本人具有著作財產權之上列論文全文(含摘要),授予國立交通大學與台灣聯合大學系統 圖書館,基於推動讀者間「資源共享、互惠合作」之理念,與回饋社會及學術研究之目 的,國立交通大學圖書館及台灣聯合大學系統圖書館得不限地域、時間與次數,以微縮、 光碟或其他各種數位化方式將上列論文重製,並得將數位化之上列論文及論文電子檔以 上載網路方式,於著作權法合理使用範圍內,讀者得進行線上檢索、閱覽、下載或列印。 論文全文上載網路公開之範圍及時間 – 本校及台灣聯合大學系統區域網路:94 年 07 月 22 日公開 校外網際網路:94 年 07 月 22 日公開 上述授權內容均無須訂立讓與及授權契約書。依本授權之發行權為非專屬性發行權利。依本 授權所為之收錄、重製、發行及學術研發利用均為無償。上述同意與不同意之欄位若未鉤選, 本人同意視同授權。 研究生簽名:. 吳瑞成. 學號:8612812. (親筆正楷) 日期:民國九十四年 1.. (務必填寫) 七. 月二十二日. 本授權書請以黑筆撰寫並影印裝訂於書名頁之次頁。.
(4) 國家圖書館博碩士論文電子檔案上網授權書 本授權書所授權之論文為本人在 國立交通大學 大學(學院) 電機與控制工程 系所 ________組_九十四__學年度第_二_學期取得_博_士學位之論文。 論文名稱:_基於腦波之駕駛員認知反應估測及其在安全駕駛的應用_____ 指導教授:_林進燈 博士________________________ ■同意. □不同意. 本人具有著作財產權之上列論文全文(含摘要),以非專屬、無償授權國家圖書館,不限地域、 時間與次數,以微縮、光碟或其他各種數位化方式將上列論文重製,並得將數位化之上列論 文及論文電子檔以上載網路方式,提供讀者基於個人非營利性質之線上檢索、閱覽、下載或 列印。 上述授權內容均無須訂立讓與及授權契約書。依本授權之發行權為非專屬性發行權利。依本 授權所為之收錄、重製、發行及學術研發利用均為無償。上述同意與不同意之欄位若未鉤選, 本人同意視同授權。 研究生簽名:. 吳瑞成. 學號:8612812. (親筆正楷) 日期:民國九十四年. (務必填寫) 七. 月二十二日. 1.本授權書請以黑筆撰寫,並列印二份,其中一份影印裝訂於附錄三之一(博碩士論 文授權書)之次頁﹔另一份於辦理離校時繳交給系所助理,由圖書館彙總寄交國家 圖書館。.
(5) 推薦函 一、 事由:推薦電機與控制工程系博士班研究生吳瑞成提出論文以參加國立交通大學 博士論文口試。 二、 說明:本校電機與控制工程系博士班研究生吳瑞成已完成博士班規定之學科及論 文研究訓練。 有關學科部分,吳君已修畢應修學分(請查學籍資料),通過資格考試;有關論文方 面,吳君已完成“基於腦波之駕駛員認知反應估測及其在安全駕駛的應用”研究初稿。論 文 “EEG-based Drowsiness Estimation for Safety Driving Using Independent Component Analysis”, ”Estimating Driving Performance Based on EEG Spectrum Analysis”, “A Novel Prosodic-information Synthesizer Based on Recurrent Fuzzy Neural Network for the Chinese TTS System” 及 ”Noisy Speech Segmentation/Enhancement with Multiband Analysis and Neural Fuzzy Networks”等四 篇已經被 IEEE Transactions on Circuit and System Part I, EURASIP Journal on Applied Signal Processing, IEEE Transactions on Systems, Man, and Cybernetics Part B, 及 International Journal of Pattern Recognition and Artificial Intelligence 等期刊所 接受,另有論文 “EEG-based Assessment of Driver Cognitive Responses in a Dynamic Virtual-Reality Driving Environment”, “Automatic EEG-based Alertness Estimation System Using Fuzzy Neural Networks”, 及“Monitoring Alertness Level with Changes in Driving Performance Based on the EEG Power Spectrum Analysis”已投稿至 IEEE 相關期刊並審查中(請參閱博士論文著作目錄)。 總言之,吳君已具備國立交通大學電機與控制工程系博士班研究生應有之教育及 訓練水準,因此推薦吳君參加國立交通大學電機與控制工程系博士論文口試。 此致 國立交通大學電機與控制工程系 電機與控制工程系教授 林 進 燈. 中華民國九十四年七月.
(6) 基於腦波之駕駛員認知反應估測 及其在安全駕駛的應用 研究生:吳瑞成. 指導教授:林進燈 博士. 國立交通大學電機與控制工程學系(研究所)博士班. 摘. 要. 在這篇論文裡,我們發展先進的生醫訊號處理技術,結合獨立成份分析演算法、腦 波頻譜分析、相關係數分析及模糊類神經網路,在虛擬實境技術所建構的認知駕駛實驗 環境中,透過非侵入式記錄的腦波電位分析,來辨識人腦對事件刺激的暫態反應以及估 測駕駛者的精神警覺程度。並且應用此分析技術去動態量測駕駛員的精神認知狀態變 化,與相對應的認知、辨識、車輛控制能力及駕駛行為的改變,以維持駕駛員的高效能 表現,並防止駕駛員在開車時,因過失及失誤所造成的意外事故。 我們首先提出一個新的基於獨立成份分析之時態匹配濾波器,去分析單次事件相關 腦電位,過濾人為雜訊的干擾,並改進傳統時域疊加方法的缺點,最後利用模糊類神經 網路模型去識別駕駛員看到紅綠燈號誌所產生的相對應腦波暫態反應。實驗結果驗證利 用多維腦電位訊號去辨識人的精神認知狀態與對事件刺激所造成的腦波暫態反應是可 行的,我們所提出的方法可以提高所量測之腦波暫態反應的訊號品質,以達到較高的辨 識率。 我們也提出一個新的基於獨立成份分析之適應性特徵值選擇機制,可以從腦波頻譜 中選取最有效的獨立成份及具代表性的頻段作為特徵值,對每一個駕駛員建立個別的模 糊類神經網路模型,去探索在疲勞或失神時,腦波的活動特性以及所伴隨的駕駛行為變 化。實驗結果顯示,人的腦波頻譜變化與開車行為表現之間的關係非常密切,我們所提 出的方法不但可以去除大部分人為雜訊的干擾,並且能夠估測最佳的頭皮位置來放置腦 波偵測器,以精確的估測駕駛者的精神警覺程度與實際的開車行為變化。此腦波訊號分 析技術未來可以利用可攜式嵌入式系統來實現一個線上精神狀態監控系統,以應用到日 常生活中。 i.
(7) EEG-Based Assessment of Driver Cognitive Responses and Its Application to Driving Safety Student:Ruei-Cheng Wu. Advisor:Dr. Chin-Teng Lin. Department (Institute) of Electrical and Control Engineering National Chiao Tung University. Abstract In this thesis, we develop advanced biomedical signal-processing technologies that combine independent component analysis (ICA), power spectrum analysis, correlation analysis, and fuzzy neural network (FNN) models to assess the event-related transient brain dynamics and the level of alertness of drivers by investigating the neurobiological mechanisms underlying non-invasively recorded electroencephalographic (EEG) signals in the virtual-reality-based cognitive driving tasks. The developed techniques are then applied for dynamically quantifying driver’s cognitive responses related to perception, recognition, and vehicle control abilities with concurrent changes in the driving performance to maintain their maximum performance in order to prevent accidents caused by errors and failures for driving safety. We first propose a novel ICA-based temporal matching filter for analyzing the single-trial event-related brain potentials (ERP) without using conventional trial-averaging results as input features of the FNN classifiers and apply this method to recognize the different transient brain responses stimulated by red/green/amber traffic-light events. Experimental results demonstrate the feasibility for identifying multiple streams of EEG signals related to human cognitive states and responses to task events. Our proposed methods can dramatically increase the quantity and quality of momentary cognitive information and achieve high recognition rates. We also develop a new ICA-based adaptive feature-selecting mechanism to extract most effective bandpower from EEG power spectrum and build an individual FNN model for each subject to further examine the neural activities correlated with fluctuations in human alertness level accompanying changes in the driving performance in the lane-keeping driving tasks. ii.
(8) Experimental results show a closed relationship between changes in EEG power spectrum and the subject’s driving performance. Our proposed models also can effectively remove most non-brain artifacts and locate optimal positions to wire EEG electrodes such that it is possible to accurately estimate/predict the continuous fluctuations in human alertness level indexed by measuring the driving performance quantitatively. The computational methods are well within the capabilities of modern digital signal processing hardware to perform in real time and thus might be used to construct and test on a portable embedded system for an online alertness monitoring system in the future.. iii.
(9) 致. 謝. 『未經一番寒徹骨、焉得梅花撲鼻香』 本篇論文之得以完成,首先要感謝我的指導教授. 林進燈博士在研究及生活各方. 面的照顧,教授勤勉不倦的研究態度、實事求是的研究精神以及前瞻精準的研究眼光、 給我在研究道路上許多啟發、使我獲益良多。其次、我要感謝. 鍾子平博士的熱心協. 助及幫忙,解決了許多研究上遇到的疑惑。另外我要感謝段正仁博士、勝富學長、以及 交通大學腦科學中心的學弟妹們:文鴻、玉潔、騰毅與士政、俞傑、欣泓、行偉、弘義、 力碩、宗哲在實驗操作上的大力幫忙以及謝謝資訊媒體實驗室的所有研究成員、助理們 在日常生活上的照顧,謝謝大家。 最後、我要特別感謝我的父母親、家人及思研小姐在背後的支持及鼓勵,讓我能無 憂無慮的順利完成學業。. iv.
(10) Contents 摘. 要 ..................................................................................................................................... i. Abstract.......................................................................................................................................ii 致. 謝 ................................................................................................................................... iv. Contents ...................................................................................................................................... v Lists of Figures ........................................................................................................................viii Lists of Tables.......................................................................................................................... xvi 1.. Introduction ........................................................................................................................ 1 1.1. Assessment of Brain Activities to Human Cognitive States ...................................... 2 1.1.1. Study of the Transient Brain Dynamics............................................................ 2 1.1.2. Monitoring of Human Cognitive State ............................................................. 4 1.2. Statement of the Problem........................................................................................... 5 1.2.1. Spatial Resolution and Source Localization..................................................... 5 1.2.2. Single-Trial Analysis ........................................................................................ 6 1.2.3. Inter-trial Time-alignment Problem.................................................................. 6 1.2.4. Artifact Removal .............................................................................................. 7 1.2.5. Cross-Subject’s Individual Variability.............................................................. 7 1.2.6. Objective Performance Evaluation................................................................... 8 1.2.7. Online Application............................................................................................ 8 1.3. Preventions of Road Traffic Accidents ...................................................................... 8 1.3.1. Accidents Related to Driver’s Transient Response .......................................... 9 1.3.2. Accidents Caused by Driver’s Loss of Alertness ........................................... 10 1.4. Object and Overview of the Thesis.......................................................................... 11. 2.. Methodology..................................................................................................................... 13 v.
(11) 2.1. Virtual-Reality-based Driving Environment............................................................ 15 2.2. EEG Measurement System ...................................................................................... 19 2.3. Independent Component Analysis (ICA)................................................................. 22 2.4. Power Spectral Analysis........................................................................................... 28 2.5. Correlation Analysis................................................................................................. 30 2.6. Self-cOnstructing Neuro-Fuzzy Inference Network (SONFIN).............................. 33 3.. Classifications of the Transient Brain Dynamics in Single Trials .................................... 37 3.1. Virtual-Reality-Based Traffic-Light Experiment ..................................................... 39 3.2. Subject’s Protocols................................................................................................... 40 3.3. EEG Data Collection................................................................................................ 41 3.4. Data Analysis ........................................................................................................... 46 3.4.1. ICA Decompositions of the ERP Data............................................................ 47 3.4.2. Temporal Matching Filter............................................................................... 48 3.4.3. Principle Component Analysis (PCA)............................................................ 50 3.4.4. Learning Vector Quantization (LVQ) ............................................................. 51 3.4.5. Back-propagation Neural Network Model (BPNN)....................................... 52 3.5. Results and Discussions ........................................................................................... 52 3.5.1. Artifact Removal Using ICA.......................................................................... 53 3.5.2. Effects With/Without Temporal Matching Filter............................................ 58 3.5.3. Performance Comparisons of LVQ, BP, and SONFIN Classifiers................. 59 3.6. Conclusion Remarks ................................................................................................ 60. 4.. Estimating Driving Performance Based on EEG/ICA Power Spectrum .......................... 62 4.1. Virtual-Reality (VR)-based Lane-Keeping Driving Experiment ............................. 64 4.2. Subject’s Protocol .................................................................................................... 65 4.3. Data Acquisition....................................................................................................... 66 vi.
(12) 4.4. Drowsiness Measurement ........................................................................................ 67 4.5. Data Analysis ........................................................................................................... 68 4.5.1. Estimating Driving Performance Using 2-Channel EEG Power Spectrum ... 68 4.5.2. Driving Performance Estimation Using Critical Bandpower of Optimal 2-channel EEG Signals based on Independent Component Analysis ............ 71 4.5.3. Estimating Driving Performance Using 2 Optimal ICA Components ........... 72 4.5.4. ICA-based Automatic Feature Extraction for Driving Performance Estimation....................................................................................................... 73 4.6. Results and Discussions ........................................................................................... 76 4.6.1. Relationship between the EEG Spectrum and Subject Alertness ................... 76 4.6.2. EEG-based Driving Performance Estimation/Prediction ............................... 80 4.6.3. Relationship between the ICA Spectrum and Driving Performance .............. 83 4.6.4. Noise Segmentation and Selection of Optimal Frequency Bands.................. 87 4.6.5. Drowsiness Estimation Based on Log Bandpower of ICA Components ....... 93 4.6.6. Drowsiness Estimation Based on EEG Log Bandpower................................ 96 4.6.7. AFSM-based Driving Performance Estimation/Prediction ............................ 98 4.7. Conclusion Remarks .............................................................................................. 102 5.. Conclusions .................................................................................................................... 104. Bibliography ........................................................................................................................... 107. vii.
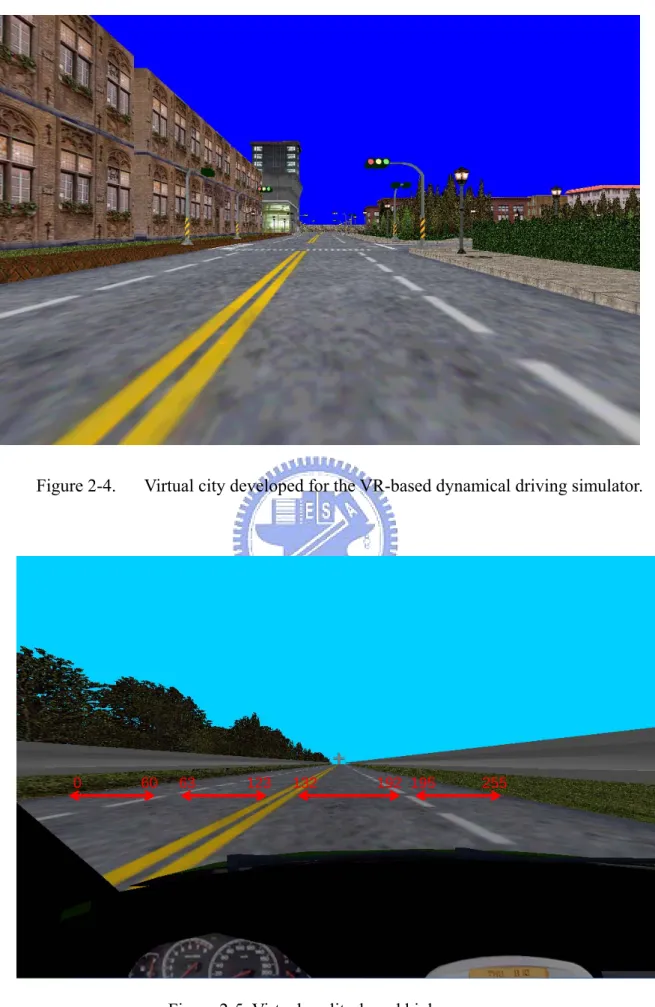
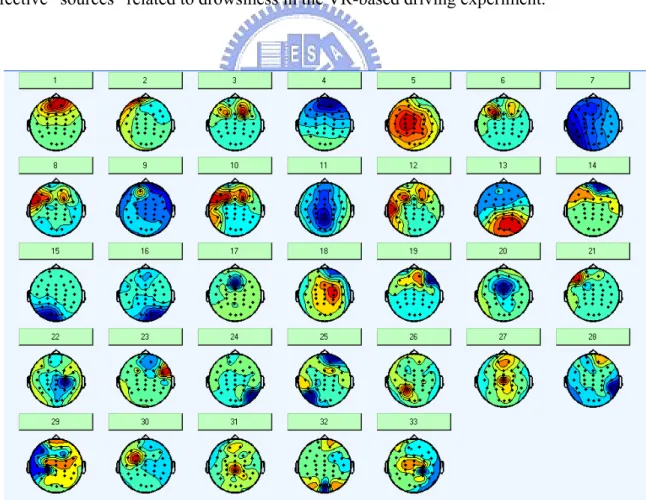
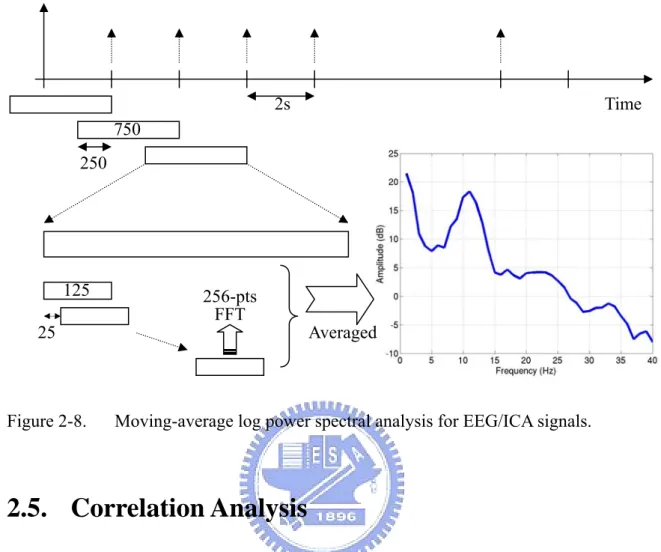
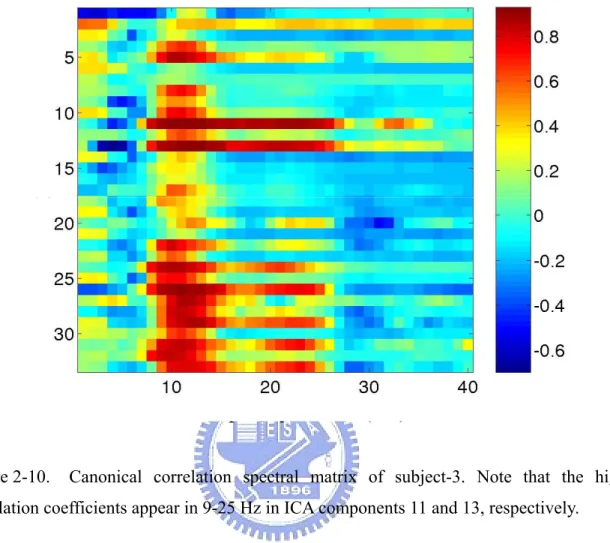
(13) Lists of Figures Figure 2-1. The system architecture of the EEG-based driver’s cognitive-state monitoring system. It consists of four major parts: (1) Virtual-reality-based driving simulator. (2) The NeuroScan EEG measurement system. (3) Advanced signal-processing unit. (4) Fuzzy-neural-network classifier or estimator. ............................................................................................................. 14 Figure 2-2. The virtual-reality-based dynamic driving simulation laboratory....................... 17 Figure 2-3. Flowchart of the VR-based highway scene development environment. The dynamic models and shapes of the 3D objects in the VR scene are created and linked to the WTK library to form a complete interactive VR simulated scene. 17 Figure 2-4. Virtual city developed for the VR-based dynamical driving simulator............... 18 Figure 2-5. Virtual-reality-based highway scene...................................................................... 18 Figure 2-6. The Scan NuAmp Express System consists of (a) 40-channel NuAmp monopolar digital amplifier, (b) a Scan recording/analyzing software, (c) sintered Ag/AgCl electrodes forming a multidimensional array on the scalp based on (d) international 10-20 system. ............................................................ 21 Figure 2-7. Scalp topography of ICA mixing matrix W-1 of 33 ICA components trained by EEG data. ....................................................................................................... 27 Figure 2-8. Moving-averaged log power spectral analysis for EEG/ICA signals.................. 30 Figure 2-9. Fluctuations in the driving error index and concurrent changes in power spectrum of ICA components and their corresponding correlation spectrum. (a) and (b) shows the changes of power spectrum in 10 Hz with time of the ICA components 11 and 13 of subject 3 after 90-s moving-average spectral viii.
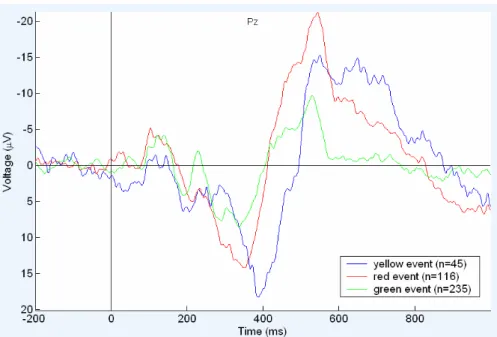
(14) analysis. (c) The smoothed 90-s driving error index. (d) Correlation coefficients from 1-40 Hz forming a correlation spectrum of the ICA components 11 and 13. ........................................................................................ 32 Figure 2-10. Canonical correlation spectral matrix of subject-3. Note that the higher correlation coefficients appear in 9-25 Hz in ICA components 11 and 13, respectively.......................................................................................................... 33 Figure 2-11. The network structure of SONFIN...................................................................... 36 Figure 3-1. Traffic-light stimulus sequences, where G, R, Y representing the Green-light, Red-light, and Amber-light events, respectively, and R_B is the subject’s response to the Red-light (e.g., braking the car), and L_B is the subject’s response to the Amber-light (e.g., speeding up the car). ..................................... 40 Figure 3-2. An example of the recorded raw data of EEG signals with synchronous onset times of three kinds of the traffic-light stimuli and two kinds of subject’s responses. The onset time of the red/green/amber traffic lights are presented as red, green, and yellow lines, and the subject’s responses, pressing a right button for a red light and a left button for an amber light, are presented as blue and cyan lines, respectively. ................................................... 43 Figure 3-3. Extracted epochs (dashed intervals) for one stimulus (red right) and subject’s response (right button). ........................................................................ 43 Figure 3-4. (a) Observed epochs (trials) for the red light stimuli at Pz channels and their time-domain overlap-added average (black line). Note that the ERPs, P300, was clearly observed. (b) Single-trial ERP-image plots of correctly responded target response data at Pz channel (occipital site) from a red-light visual stimulus. The subject’s response time (black line) is very time-locked to the P300 ERP corresponding to Red-light stimulus........................................ 44 ix.
(15) Figure 3-5. Time-domain overlap-added averaged ERP signals for three kinds of traffic-light stimuli in Pz channel........................................................................ 45 Figure 3-6. Scalp topography of the time series of an averaged epoch for one stimulus (red light). These results show that active brain responses to significant events or external stimuli involve synchronized oscillations in local field potentials in a number of brain regions [28-29]. These brain dynamic events appear to begin in the frontal cortex, implying they carry or channel top-down information about intention, including attentional focus, to sensorimotor brain areas triggering other dynamic events that carry or channel bottom-up information from sensory to response-selection areas. ........ 45 Figure 3-7. Flowchart of ERP data analysis in the visual traffic-light detection experiment........................................................................................................... 46 Figure 3-8. Schematic depiction of ICA decomposition of EEG signals............................... 48 Figure 3-9. The use of Matching Filter for temporal alignment of the single-trial ERP. ......... 50 Figure 3-10. (a) The absolute values of the averaged ERP signals for 31 channels, where each line presents one-channel averaged ERP signal (from -200 ms to 1000ms, with stimulus given at 0 ms). The amplitude of artifacts (EOG, etc.) is larger than ERP (P300) and its position is apparently observed at frontal sites on scalp. (b) The ERP image in single trials observed in Pz channel. Note that the eye-blinking artifact is propagated to the occipital site (Pz) and seriously influenced the collected ERP signals related to visual stimuli. ........... 55 Figure 3-11. The scalp topography of the ICA mixing matrix W-1, where the orders of the ICA components were sorted by the variances of the activations of ICA components. The major artifact, i.e., eye-blinking, is separated in ICA components 1 and 7, visual evoked ERPs are separated into component 4........ 56 x.
(16) Figure 3-12. Diagram of artifact removal based on ICA algorithm. The left block shows the “polluted” ERPs at Pz channels. The visual evoked ERPs (P300) and the eye-blinking artifacts can successfully be separated into two major parts, P300 at middle-down block and artifacts at middle-top block, which were re-projected back from ICA components 4 and 1. .............................................. 57 Figure 3-13. Comparisons of classification results with/without (NF) temporal matching filter using (a) LVQ and (b) SONFIN classifiers, respectively. .......................... 58 Figure 3-14. Classification results of traffic-light-stimulated ERP with/without(NF) temporal matching filter using LVQ, BP, and SONFIN classifiers, respectively.......................................................................................................... 60 Figure 4-1. The. dynamic. driving. simulation. laboratory. consists. of. the. virtual-reality-based 360o-surrounding screen and a six-degree-of-freedom motion platform................................................................................................... 65 Figure 4-2. (a) The VR-based freeway scene. (b) Example of the driving performance index. Note that the red dashed line means the “dangerous” boundary. When the driving performance is larger than 32 (red line), the target car entirely crossed the lane line to other traffic lane and will easily lead to accidents......... 68 Figure 4-3. Flowchart of the training process for estimating subject’s driving errors. (1). A low-pass filter was used to remove the line noise and higher frequency (>50Hz) noise. (2). Moving-averaged spectral analysis was used to calculate the EEG log power spectrum of each channel advancing at 2-sec steps. (3). Two EEG channels with higher correlation coefficients between subject’s driving performance and EEG log power spectrum were further selected. (4). Principal Component Analysis was trained and used to decompose selected features and extract the representative PCA-components as the input vectors xi.
(17) for the linear regression models. (5). The linear regression models were trained in one training session and used to continuously estimate and predict the individual subject’s driving performance in the testing session.................... 70 Figure 4-4. Signal Flowchart of the drowsiness estimation system based on the bandpower of the 2-channel EEG signal centered in the effective ICA components.......................................................................................................... 72 Figure 4-5. Signal Flowchart of drowsiness estimation system based on the bandpower of optimal 2-ICA components with highest correlation coefficients between time series of subject’s driving error index and the power spectra of the ICA components.......................................................................................................... 73 Figure 4-6. Signal flowchart of the adaptive alertness estimation system............................. 74 Figure 4-7. Example of the adaptive feature selection mechanism for subject-3. Note that the band power of ICA components 11 and 14 in frequency bands 10-14 Hz are selected as input feature of the estimators. .............................................. 75 Figure 4-8. Correlation spectra. Correlations between EEG power and driving performance, computed separately for 40 EEG frequencies between 1 and 40 Hz. (A) Grand mean correlation spectra for 10 sessions on 5 subjects. (B) Scalp topographies of the correlations at dominant frequencies at 7, 12, 16 and 20 Hz. ........................................................................................................... 78 Figure 4-9. Correlation spectra between the EEG power spectrum and the driving performance at Fz, Cz, Pz, and Oz channels in two separate driving sessions from Subject A (best case). Note that the relationship between EEG power spectrum and driving performance is stable within this subject. ........................ 79 Figure 4-10. Correlation spectra between the EEG power spectrum and the driving performance at Fz, Cz, Pz, and Oz channels in two separate driving sessions xii.
(18) from Subject B (worst case). Note that the relationship between EEG power spectrum and driving performance is stable within this subject, especially below 20 Hz. However, the relationship is variable from subject to subject (contrast Fig. 4-9 and 4-10)................................................................................. 79 Figure 4-11. Driving performance estimates for a training session from Subject 3, based on a linear regression (red line) of PCA-reduced EEG log spectra at two scalp sites, overplotted against actual driving performance time series for the session (solid line). The correlation coefficient between the two time series is r = 0.88. ................................................................................................. 82 Figure 4-12. Driving performance estimates for a testing session of Subject 3, based on a linear regression (red line) of PCA-reduced EEG log spectra from a separate training session from the same subject, overplotted against actual driving performance time series of the test session (solid line). The correlation coefficient between the two time series is r = 0.7. Note that the training and testing data in this study were completely disjoined........................................... 82 Figure 4-13. Correlation spectra between smoothed driving performance and log subband power spectra of (a) 33 EEG channels and (b) 33 ICA components for frequencies between 1 and 40 Hz of Subject-3. It is observed that the subband power spectra between frequency bands 10~14Hz have high positive correlation with driving performance in most EEG channels and both 11th and 13th ICA components. Figs. 4-13 (c) and (d) show the scalp topographies of weighting matrices for dominant ICA component 11 that was centered on Pz (28th) channel and ICA component 13 that was centered on P4 (29th) /O4 channels. ................................................................................... 85 Figure 4-14. Correlation spectra between smoothed driving performance and log subband xiii.
(19) power spectra of (a) 33 EEG channels and (b) 33 ICA components for frequencies between 1 and 40 Hz of Subject-2. It is observed that the subband power spectra between frequency bands 8~13Hz have high positive correlation with driving performance in most EEG channels and both 8th and 17th ICA components. Figs. 4-14 (c) and (d) show the scalp topographies of weighting matrices for dominant ICA component 8 that was centered on CPz (22th)/Fz channels and ICA component 17 that was centered on Pz (28th) /Oz channels. ....................................................................................................... 86 Figure 4-15. Scalp topography of ICA weighting matrix wi,j by spreading each wi,j into the plane of the scalp corresponding to the jth ICA components based on International 10-20 system. ................................................................................. 89 Figure 4-16. Correlation spectra between smoothed driving performance and log power spectra of 33 ICA components of Subject-2. It is observed that the bandpower spectra between frequency bands 8~12Hz have highest positive correlation with driving performance in both 8th and 17th ICA components....... 89 Figure 4-17. Scalp topographies of ICA weighting matrices for dominant components 8 and 17. Note that the CPz channel and Pz channels are at the center position of these two ICA components, respectively. ....................................................... 90 Figure 4-18. Driving performance estimates for training/testing sessions of subject 3, based on a linear regression model (red line) with subband log power spectra at frequency bands 10~14 Hz of ICA components 11 and 13 selected according to Table 4-4, overplotted against actual driving performance time series for the session (blue line). The correlation coefficient between the two time series is r=0.93 in the training session and r=0.92 in the testing session.... 95 Figure 4-19. Driving performance estimates for training/testing sessions of subject 2, xiv.
(20) based on a linear regression model (red line) with subband log power spectra at frequency bands 8~12 Hz of ICA components 8 and 17 selected according to Table 4-4, overplotted against actual driving performance time series for the session (blue line). The correlation coefficient between the two time series is r=0.91 in the training session and r=0.89 in the testing session.... 95 Figure 4-20. Driving error estimates for training/testing sessions of subject 3, based on a linear regression model (red line) with subband log power spectra at frequency bands 10~14 Hz of EEG channels Pz and P4 (selected according to Table 4-6), overplotted against actual driving error time series for the session (blue line). The correlation coefficient between the two time series is r=0.91 in the training session and r=0.87 in the testing session.......................... 98 Figure 4-21. Driving performance estimation for training/testing sessions of subject 3, based on SOFNIN models (red line) with input features selected by AFSM method according to Table 4-11, overplotted against actual driving performance time series for the session (blue line). The correlation coefficient between the two time series is r=0.96 in the training session and r=0.94 in the testing session. ............................................................................. 101. xv.
(21) Lists of Tables Table 3-1.. Classification rates of three linear/nonlinear classifiers with/without temporal matching filters for 8 subjects in the VR-based traffic-light motion simulation experiments. ...................................................................................... 59. Table 4-1.. Comparisons of driving performance estimation using one single linear regression model for all five subjects and using individual model for each subject. Note that the input features are PCA-reduced EEG power spectrum from 1-40Hz in Cz and Pz channels.................................................................... 81. Table 4-2.. The correlation coefficients between the log subband power spectra and the driving error of subject 3 corresponding to different frequency bands from 8 to 15 Hz of ICA component 11 and 13 in the training and testing sessions using the same ICA weighting matrices obtained from the training session. ..... 92. Table 4-3.. The correlation coefficients between log subband power spectra and the driving error of subject 3 using five best frequency bands (from 10 to14 Hz) corresponding to different single ICA component. The same ICA weighting matrices obtained from the training session were used for testing session performed in the other day................................................................................... 92. Table 4-4.. The optimal 2 ICA components and frequency band ranges corresponding to different subjects according to the higher correlation coefficients between log subband power spectra and the driving performance.................................... 93. Table 4-5.. Driving performance estimation using total 10 frequency bands in 2 dominant ICA components (5 frequency bands for each ICA component) as input features of the linear regression model for five subjects. .......................... 94. Table 4-6.. The correlation coefficients between log subband power spectra and driving xvi.
(22) error of subject 3 using bandpower in frequency bands from 10 to14 Hz corresponding to different single EEG channel in the training/testing session. 97 Table 4-7.. The optimal 2 EEG channels and the associated frequency band ranges corresponding to different subjects based on central electrode positions of 2 ICA components which have the better correlation coefficients between the log subband power spectra and the driving performance.................................... 97. Table 4-8.. Driving error estimation using total 10 frequency bands (5 for each EEG channel) as input features of the linear regression model for five subjects. ....... 98. Table 4-9.. The optimal 2 ICA components and frequency bands selected manually and by AFSM corresponding to different subjects according to the higher correlation coefficients between log bandpower spectra and the driving performance....................................................................................................... 100. Table 4-10. Driving performance estimation using total 10 frequency bands in 2 dominant ICA components selected manually and by AFSM methods shown in Table 4-9, as input features of the linear regression models for five subjects. ............................................................................................................. 100 Table 4-11. Driving performance estimation using total 10 frequency bands in 2 dominant ICA components selected by AFSM methods shown in Table 4-9, as input features of the linear regression models and SONFIN for five subjects. ............................................................................................................. 100. xvii.
(23) 1.. Introduction Many disasters and near-disasters have resulted from loss of alertness, lack of attention,. or poor decision-making on the part of ship navigators, airplane pilots, railroad engineers, truck and auto drivers, and plant monitors. Catastrophic errors can be caused by momentary lapses in alertness and attention during periods of relative inactivity. Unfortunately, as sixty years of research in human vigilance and attention has shown, humans are not well-suited to maintaining alertness and attention under monotonous conditions, particularly during the normal sleep phase of their circadian cycle. Yet most operative interfaces today simply assume that an alert and attending operator is always present and available to solve unexpected problems and can make decision and perform essential tasks that cannot be automated. Our society thus becomes more and more vulnerable to circadian alertness issues. This motivates us to develop the advanced biomedical signal-processing techniques and to build a human cognitive-state monitoring system to assist operators working in an interactive monitoring or control environment in maintaining a high sustained cognitive capacity while minimizing performance lapses and errors of interpretation, and to demonstrate the feasibility of detecting and modeling, in near real time via multiple streams of psychophysiological information such as electroencephalogram (EEG) and event-related potential (ERP) that organize operators’ cognitive states and responses to task events. In this chapter, a brief overview of methods to assess brain activities related to human cognitive states is presented, including the study of the transient brain dynamics, the relations of brain dynamics to the changes in the cognitive states of human operators, and problems of monitoring driver’s cognitive states related to driving errors, which suggested us the direction of developing advanced biomedical signal processing methodologies and application for diving safety issues. 1.
(24) 1.1. Assessment of Brain Activities to Human Cognitive States The human electroencephalogram (EEG), first studied by Berger in the 1920’s, represents macroscopic oscillatory and non-oscillatory brain potentials thought to be generated mostly by synchronous post-synaptic currents in large populations of neurons in the cortex. It is a completely non-invasive measurement of brain function by analyzing the scalp electrical activity generated by brain networks that can be applied repeatedly in patients, normal adults, and children with no risks or limitations. For three generations it has been known that abundant information regarding cognitive states such as alertness and arousal is available in EEG recordings. However, relatively little has been done to capture this information in near-real time until the advent of computers fast enough to adequately process the data and signal processing methods capable of extracting the relevant information. For the past thirty years, the dominant analysis method for human cognitive studies has been the averaged evoked response or event-related potential (ERP). Measures of the EEG spectrum have been widely used only to identify stages of sleep. Now that adequate computing power and signal processing algorithms are available, it is of both practical and theoretical interest to know what information about changes in waking human cognitive capacity and behavior is available in complex EEG signals.. 1.1.1. Study of the Transient Brain Dynamics Several groups have attempted to relate brain potentials recorded non-invasively from the human scalp to speculate a cause and effect relationship between EEG and certain stimuli or tasks. These studies have used the EEG spectrogram or the Event-Related brain Potential (ERP)-liked measuring techniques for comparing the complex EEG data to independent task, 2.
(25) performance or subjective rating measures [1-19]. An early effort in this direction, Pfurtscheller and Araniber first reported a method for quantifying the average transient suppression of alpha band (circa 10-Hz) activity following stimulation [3]. In the last decade, researchers studying Pfurtscheller's event-related desynchronization (ERD, spectral amplitude decreases), and event-related synchronization (ERS, spectral amplitude increases) in a variety of narrow frequency bands (4-40 Hz) have reported on their systematic dependencies on task and cognitive state variables as well as on stimulus parameters [4]. For example, Williamson et al. reported that, given a visually presented arithmetic problem to compute mentally, the resulting subject alpha-band ERD resolved only when the calculation was complete [5]. Typically, psychologists calculated averaged Event-Related Potential (ERP) methods by applying simple measures of peak amplitudes and latencies in ERP averages at single scalp channels and focused on the feasibility studies of brain computer interface (BCI) and biofeedback methods in order to choose characters or move a cursor on a computer screen [6-14]. These response averaging, reducing EEG data sets to one or more averaged ERPs, has been the dominant mode of EEG data analysis in cognitive studies for nearly 40 years. The ERP is accomplished by computing averaging epochs (recording periods) of EEG time-locked to repeated occurrences of sensory, cognitive, or motor events [15-18]. Averaged ERPs evoked by brief unattended visual stimuli consist of a sequence of positive and negative peaks that are generally assumed to reflect activity in individual visual cortical processing regions [19]. In this view, response averaging attempts to remove background EEG activity or unrelated noises, whose time course is presumed to be independent of experimental events, as well as artifactual potentials produced by eye and muscle activity, and reflect only activities which are consistently associated with the stimulus processing in a time-locked way.. 3.
(26) 1.1.2. Monitoring of Human Cognitive State During the past 10 years, several scientific researches in electrophysiological analysis had been reported to investigate the feasibility of accurately estimating shifts in an operator’s global level of alertness by monitoring the changes in the physiological signals. These methods can be further categorized into two main fields. One focuses on detecting physical changes during drowsiness by image processing techniques, such as average of eye-closure speed, percentage of eye-closure over time, eye tracking as quantization of drowsiness level, driver’s head movements, and steering wheel angle [20-28]. These methods can be further classified as being either direct contact by attaching sensors to the driver’s body or non-contact types by using optical sensors or video cameras to detect vigilance changes and achieve a satisfactory recognition rate. However, these parameters vary in different environmental situations and driving conditions, it would be necessary to devise different detection logic for different types of vehicles. Recently, Van Ordan and et al. further compared these eye-activity based methods to EEG-based methods for alertness estimates in a compensatory visual tracking task [29]. It showed that although these eye-activity variables are well correlated with the subject performance, those eye-activity based methods require a relatively long moving averaged window aiming to track slow changes in vigilance, whereas the EEG-based method can use a shorter moving averaged window to track second-to-second fluctuations in the subject error in a visual compensatory task [40, 49-52]. The other field focuses on measuring physiological changes of drivers, such as heart rate variability (HRV) and electroencephalogram (EEG), as a means of detecting the human cognitive. states. [30-34].. It. has. been. known. that. abundant. information. in. electroencephalogram (EEG) recording can relate with drowsiness, arousal, sleep, and attention [35]. Previous psychophysiological studies show that typical sleep rhythm regulated by the circadian process can be divided into non-rapid-eye-movement (NREM) sleep and 4.
(27) rapid-eye-movement (REM) sleep [36-37]. NREM sleep is further subdivided into stages 1-4. In the first part of falling into sleep (micro-sleep at NREM), increasing amplitudes of slow alpha waves of the EEG signals were observed with positive correlation at occipital sites (O1 and O2) and negative correlation at central sites (C3 or C4) [38-39]. While approaches based on EEG signals have the advantages for making accurate and quantitative judgments of alertness levels, relatively little information has been captured in real time until signal processing methods and computer power are fast enough to extract the relevant information from the EEG [40]. Thus, it is practicable and appealing to know what information about human cognitive state and behavior are available through analyzing complex EEG signals.. 1.2. Statement of the Problem Although EEG-based technologies had been studied and applied in cognitive analysis by many psychologists and brain researchers for nearly 40 years. There are still many problems and limitations existing in analyzing the EEG signals and in practical applications. To achieve a reliable and applicable assessment of human cognitive states by investigating the neurobiological mechanisms underlying non-invasively recorded electroencephalographic (EEG) brain dynamics in the cognitive driving tasks, the following issues should be investigated.. 1.2.1. Spatial Resolution and Source Localization Comparing with other physiological signals, such as heart rate variability (HRV), galvanic skin response (GSR), and functional magnetic resonance imaging (fMRI), the EEG has the advantage of high temporal resolution (up to several KHz) and easy implementation to the subjects. However, previous studies used simple measures of peak amplitudes and latencies in ERP averages at single or fewer scalp channels, the spatial resolution of the EEG 5.
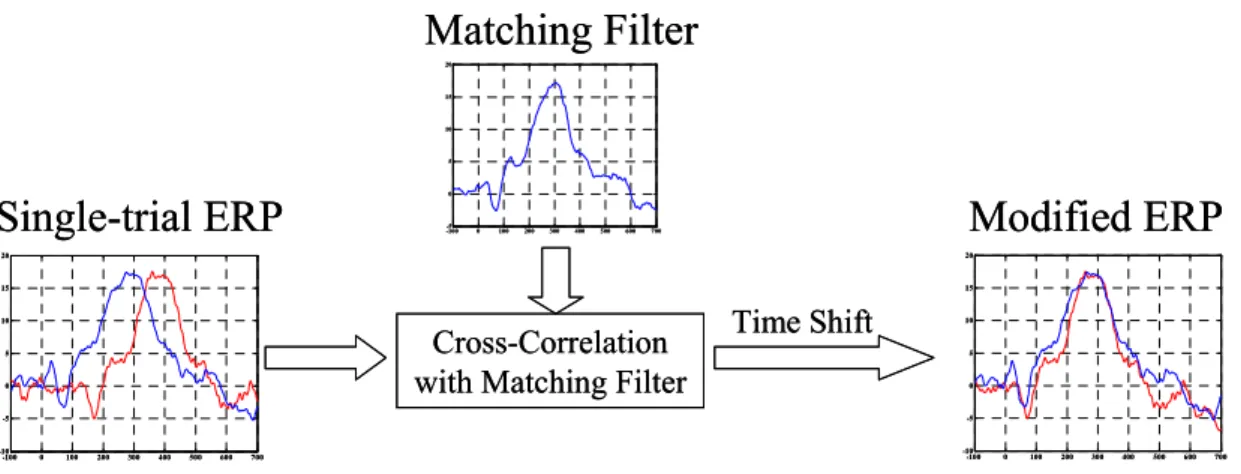
(28) signals distributed on the scalp is difficult to be obtained and is incapable of extracting the relevant information. Thus, the possible source localization, which can be used to wire as few as electrodes, related to the external stimulus or the nidus can not be determined, either.. 1.2.2. Single-Trial Analysis Current ERP-based studies attempt to use response overlap-added averaging method in time domain to reducing EEG data sets to one or more averaged ERPs in order to remove the background EEG activity or unrelated noises. However, previous studies had showed evidences from humans and animals experiments, suggesting that averaging ERPs data from a number of experimental trials only conceals rather than reveals the essential nature of event-related brain dynamics [41-44]. Because of the physics of volume conduction, potentials arising through partial synchronization of neural activity, or from artifacts produced by muscle activity or eye movements, all contribute to the signal recorded from nearly any scalp electrodes. Another disadvantage of the trial-averaging method is that it needs to collect many trials first in order to increase the signal-to-noise ratio and thus, is hard to be used in real-time application.. 1.2.3. Inter-trial Time-alignment Problem For single-trial analysis of ERP signals in time domain, the amplitude and latency of the ERP is an important factor for the classification of ERPs. The time-alignment problem is defined as estimating the time lag of ERP latency due to the time-varying and non-stationary properties of the ERPs in single trials related the same stimulus. There are many psychophysiological factors leading to the time-alignment phenomenon of the single-trial ERP signals for one subject, such as the cognitive state of the subject at that moment, and the different response behavior for each trial of the subject, etc. The time-alignment problem 6.
(29) caused by the different time lags of subject’s response in different epoch for the same stimulus will lead to serious problems for identifying the ERPs and decrease the recognition rate.. 1.2.4. Artifact Removal One of the important problem of applying EEG-based method to driving task or other applications is artifact handling due to the non-invasively measuring manner of EEG signals. During the period of collecting the EEG signals, subjects move their hands, torso, head, and eyes, which will create huge muscle movement, eye-blinking artifacts, heart rate, and other line noise. Using low pass filtering method or the trial-averaging method will not remove them but mask them only. The other method uses regressions in the time or frequency domain to derive effective parameters characterizing the spread of EOG noises in the EEG channels [45-46]. However, regressing out EOG activity, which also contains brain signals [47], inevitably involves subtracting a portion of the relevant EEG signals and tends to overcompensate for blink artifacts and may introduce new artifacts into EEG records due to the difference between the spatial EOG-to-EEG transfer functions for blinks and saccades. Regression also cannot be used to remove muscle noise or line noise, either, since these have no reference channels [48].. 1.2.5. Cross-Subject’s Individual Variability Details of brain dynamics may be as variable between subjects as details of brain shape and orientation. Thus, measures defined a priori and applied uniformly to data from groups of subjects cannot have the statistical power of measures customized to the relevant features of individual subject brain signals such that it is difficult to build a single model to accurately estimate or predict individual changes in alertness and performance of all the subjects [40, 49-52]. 7.
(30) 1.2.6. Objective Performance Evaluation Current brain research uses subjective reports, questionnaires, and the judgments based on the expert’s knowledge to determine the subject’s cognitive states, such as level of drowsiness, and level of motion sickness, etc. An objective statistic measure is needed to quantify the human performance improvement related to subject’s cognitive states and to study the objective criterion for evaluating the overall task performance of system operator(s).. 1.2.7. Online Application In order to apply the developed EEG-based methods for online applications outside the psychophysiology laboratory, the proposed signal processing technologies will have the limitations of less computational cost and use as few as EEG electrodes to be easily implemented on a portable real-time embedded system. Therefore, there is a compromise between computational cost and system accuracy.. 1.3. Preventions of Road Traffic Accidents During the past years, driving safety has received increasing attention in public security. The road traffic injuries constitute a major public health and are predicted to increase if it is not addressed adequately and requires more concerted efforts for effective and sustainable preventions. The major risk factors for road driving safety can be roughly classified in two catalogs. One is the environmental influences, such as the enforcement of traffic rules; defects in road design, layout, and maintenance; inadequate visibility to difficultly detect vehicles and other road users; vehicle factors including braking, handling, and maintenance; insufficient vehicle crash protection for occupants and for those hit by vehicles; and the use of seat-belts and child restraints. Another factors related to driver’s behaviors including the violation of 8.
(31) traffic regulations; the detection of targets in the periphery of the eye; the estimation of speed and distance; presence of alcohol, medicinal or recreational drugs; the processing of information by the brain; fatigue/micro-sleep; delay in detecting crash; and other physiological factors associated with age and sex that have a bearing on crash risk. Although many governments and vehicle manufacturers try to make the use of information and publicity on their own to prevent road traffic accidents including strategies to address rates of speed, alcohol consumption; promotion of using helmets and seat belts, or improvement of design and layout of the road, enhancements of vehicle structures and etc. Yet the knowledge currently exists to take action on a number of fronts to prevent these needless deaths, disabilities, immense loss, and suffering they cause. It is still wide held that the major responsibility of the road crashes still rely on driver’s errors. Therefore, preventing such accidents is highly desirable but requires techniques to reduce the number of traffic conditions causing death or injury or to prevent accidents before they happen such as eliminating situations that the driver is in insecure essentials. The key points of preventing accidents caused by driver’s errors and failures behind the steering wheel related to the driving safety can be roughly recognized into two aspects: the identification of transient brain dynamic responses and the continuous estimation of driver’s alertness level, which support information seeking and attention, decision-making, response selection, and anticipation of expected consequences.. 1.3.1. Accidents Related to Driver’s Transient Response The human cognitive states accompanying incorrect/absent motor responses or slow responses in driving tasks on the roads may easily triggers an accident and lead to disastrous consequences as an underlying cause. An impaired driver will not take evasive action prior to a collision, where almost 30% of accidents could be avoided by means of reducing the driver 9.
(32) related reaction time by just 0.5 sec, and thus the reductions in traffic crash losses from reducing crashes attributable to driver impairment far exceed reductions from any other potential countermeasure [53].. 1.3.2. Accidents Caused by Driver’s Loss of Alertness Previous studies have showed that drivers’ fatigue has been implicated as a causal factor in many accidents because of the marked decline in the drivers’ abilities of perception, recognition and vehicle control abilities while sleepy [54-56]. The National Highway Traffic Safety Administration (NHTSA) conservatively estimates that 100,000 police-reported crashes are the direct result of driver fatigue each year [57]. This results in an estimated 1,550 deaths, 71,000 injuries and $12.5 billion in monetary losses. The National Sleep Foundation (NSF) also reported in 2002 [58] that 51% of adult drivers had driven a vehicle while feeling drowsy and 17% had actually fallen asleep. The National Transportation Safety Board found that 58 percent of 107 single-vehicle roadway departure crashes were fatigue-related in 1995, where the truck driver survived and no other vehicle was involved. Driving under the influences of drowsiness will cause (a) longer reaction time, which will produce effects on crash risk, particularly at high speeds; (b) vigilance reduction including non-responses or delaying responding where performance on attention-demanding tasks declines with drowsiness; (c) deficits in information processing, which will reduce the accuracy and correctness in decision-making tasks. Therefore, the leading response should be to persuade road users to adopt “error-free” behavior and maintain the human high performance in the context of road traffic safety certainly. Developing accurate and continuous techniques for both identifying driver’s transient cognitive responses related to environmental stimuli and continuously detecting, estimating, and predicting driver’s alertness level would be highly desirable, particularly if 10.
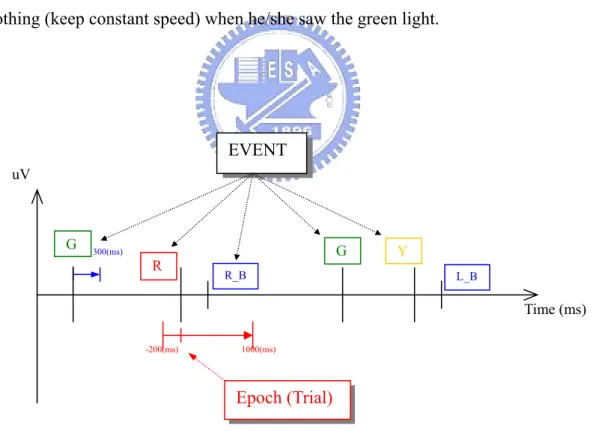
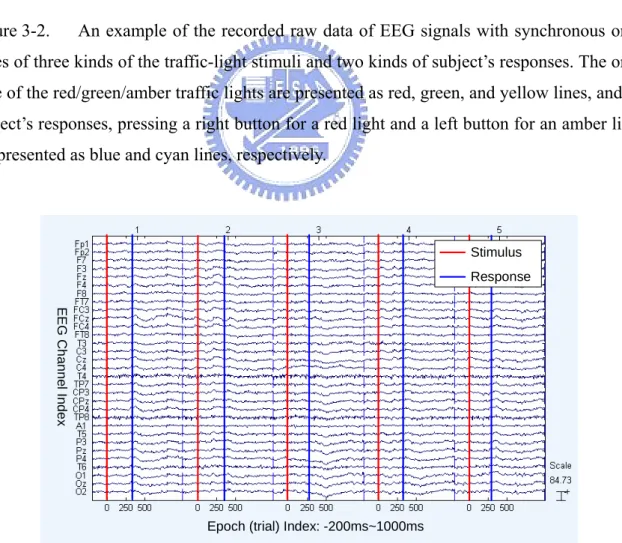
(33) this measure could be further used to predict changes in driver's performance capacity in order to deliver effective feedbacks to maintain their maximum performance.. 1.4. Object and Overview of the Thesis The objects of this thesis are to develop advanced biomedical signal processing methodologies to quantify the level of the human cognitive state with concurrent changes in the driving performance. To achieve these goals, we develop methodologies that combine independent component analysis (ICA), power spectrum analysis, correlation analysis, and fuzzy neural network (FNN) models for ongoing assessment of the transient event-related brain dynamics and the level of alertness of drivers by investigating the neurobiological mechanisms underlying non-invasively recorded multidimensional electroencephalographic (EEG) brain dynamics in the cognitive driving tasks. We then apply these methods to the field of the driving safety, and focus on two major applications, the visual traffic-light detection task and the continuous lane-keeping task on the highway, since they are most frequently happened events on the road in daily life and will easily lead to huge losses in both health injuries and economics. Three important parts compose this dissertation. The first part describes the research-oriented methodologies for the analysis of human cognitive responses based on EEG signals to support further applications. The second part describes methods for identification of transient brain cognitive responses of drivers related to Red/Yellow/Amber traffic-light events. The last part focuses on developing methods to monitor alertness level of drivers accompanying changes in driving performances and to explore the relationship between brain activities, and human cognitive states. Each of these parts is described in a separate chapter. In this chapter, the necessity of developing technologies for driving safety has been described, including statistical reports of road traffic injuries, preventions of traffic accidents 11.
(34) by governments and vehicle-manufactories, and problems of monitoring driver’s cognitive states related to driving errors, which suggested the direction of the thesis. In Chapter 2, we proposed advanced signal processing methodologies for the analysis of brain activities related to cognitive states, including virtual reality technology, EEG measurement system, independent component analysis, temporal matching filter, moving averaged power spectral analysis, correlation analysis, and fuzzy neural network model. In Chapter 3, we describe the system architectures focusing on identification of event-related brain potentials related to driver’s transient cognitive responses on traffic-light stimuli, including details of the traffic-light experimental setup, analysis of EEG data using ICA and temporal matching filter, and classification of EEG pattern related to Red/Yellow/Amber stimuli using fuzzy neural networks. Some discussions and conclusion remarks are also included. In Chapter 4, we propose models for accurately and continuously monitoring level of driver's alertness accompanying changes in driver's performance in a lane-keeping driving task on the virtual-reality-based highway scene. The EEG-based estimation system combines EEG power spectrum, independent component analysis, correlation analysis for adaptive feature selection, and linear regression models and fuzzy neural network estimators. The relationship among EEG power spectrum, driver’s alertness level and driving performance are discussed in detail. In Chapter 5, contributions of this thesis are summarized with final conclusions. Some further applications using the proposed methodologies are also illustrated.. 12.
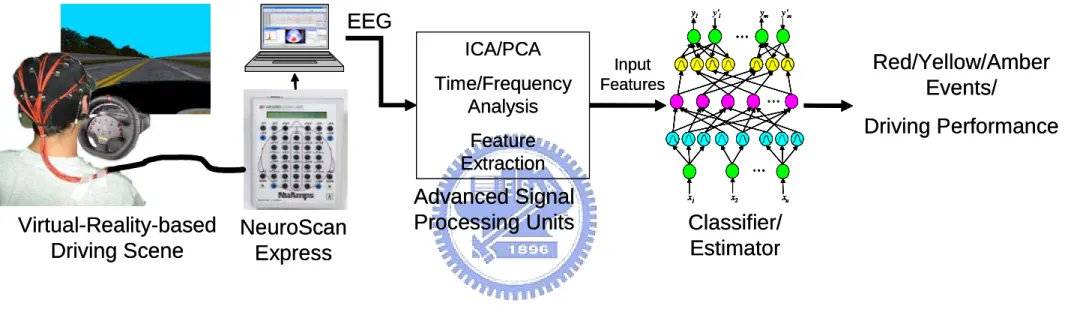
(35) 2.. Methodology In this chapter, a brief overview of the advanced EEG-based biomedical signal. processing methodologies for identifying/monitoring driver’s cognitive states is presented. We propose quantitative techniques for ongoing assessment of both the transient event-related brain dynamics and the level of alertness of drivers by investigating the non-invasively recorded EEG brain dynamics in two cognitive driving tasks. Fig. 2-1 shows the whole system architecture consisted of four major parts. (1) The virtual reality technology is used to construct an interactive driving environment for performing two cognitive driving tasks, the visual traffic-light stimulated experiment and the driver’s alertness estimating experiment on highway. (2) The NeuroScan 40-channel EEG measurement system is used to non-invasively collect multidimensional high-fidelity EEG signals. (3) The advanced signal processing technologies are proposed to remove non-brain artifacts, locate optimal positions to wire EEG electrodes, and extract effective features, including independent component analysis, power spectral analysis, correlation analysis, and adaptive feature selecting mechanism. (4) An individual fuzzy neural network model for each subject is used to classify the transient cognitive responses or to monitor the driving performance related to driver’s cognitive states.. 13.
(36) y1. EEG ICA/PCA Time/Frequency Analysis. y'1. ym. y'm. Red/Yellow/Amber Events/. Input Features. Driving Performance. Feature Extraction. Virtual-Reality-based Driving Scene. Figure 2-1.. NeuroScan Express. Advanced Signal Processing Units. x1. x2. xn. Classifier/ Estimator. The system architecture of the EEG-based driver’s cognitive-state monitoring system. It consists of four major parts: (1). Virtual-reality-based driving simulator. (2) The NeuroScan EEG measurement system. (3) Advanced signal-processing unit. (4) Fuzzy-neural-network classifier or estimator.. 14.
(37) 2.1. Virtual-Reality-based Driving Environment Public security has become an important issue, especially, the safe manipulation and control of various machines and vehicles such that the authorities can keep emphasizing the strict training of human operators. Currently, such a training process usually relies on the actual machines or vehicles in real sites. This not only has high demands in space, time, and money to perform such a training job, but also leads to another phase of the public security problem. To tackle the above dilemma, the worldwide trend is to use the virtual-reality (VR) technology [59-63] to meet the requirements of public security in training and censoring of human operators. In this way, the operator can feel that he/she is controlling a real machine or vehicle to achieve the goal of real training and censoring. The VR technology provides a realistic safety environment, which allows subjects to make on-line decisions by directly interacting with a virtual object rather than monotonic auditory and visual stimuli. The VR is also an excellent candidate for brain research on real-time tasks because of its low cost, saving time, less space, and condition control to avoid the risk of operating on the actual machines, and thus extends the applications of possible brain computer interfaces to general populations, not limited to lock-in patients. In this thesis, we apply the dynamic VR technology to design a well-controlled, virtual driving environment for the cognitive tasks experiments as shown in Fig. 2-2 [61-63]. The high-fidelity interactive 3D scene was developed by the VR development software, WorldToolKit (WTK) library and application programmer’s interface (API) [64]. The detailed development diagram of the VR-based scene is shown in Fig. 2-3. It consists of four major components: (1) The textures of the created objects; (2) the corresponding parameters between created objects; (3) the objective dynamic equations of the 3D models; and (4) the control unit to link all the sub-models with the help of WTK library and APIs. To build a realistic driving environment as the test bed for the cognitive tasks, we first create models of 15.
(38) various objects (such as cars, roads, and trees, etc.) for the scene and setup the corresponding positions, attitudes, and other relative parameters between objects. Then, we calculate the parameters of the dynamic equations among these virtual objects and build a complete scene of full functionality with the aid of the high-level C-based API program. Finally, we link the virtual-reality-based driving scene to the EEG measurement/recording system to synchronously provide necessary stimuli and triggering signals for the driving task. Fig. 2-4 and 2-5 show the virtual-city scene for the traffic-light experiment and the highway scene for the lane-keeping experiment, respectively.. 16.
(39) Figure 2-2.. Figure 2-3.. The virtual-reality-based dynamic driving simulation laboratory.. Flowchart of the VR-based highway scene development environment. The. dynamic models and shapes of the 3D objects in the VR scene are created and linked to the WTK library to form a complete interactive VR simulated scene.. 17.
(40) Figure 2-4.. 0. Virtual city developed for the VR-based dynamical driving simulator.. 60. 63. 123. 132. 192 195. 255. Figure 2-5. Virtual-reality-based highway scene. 18.
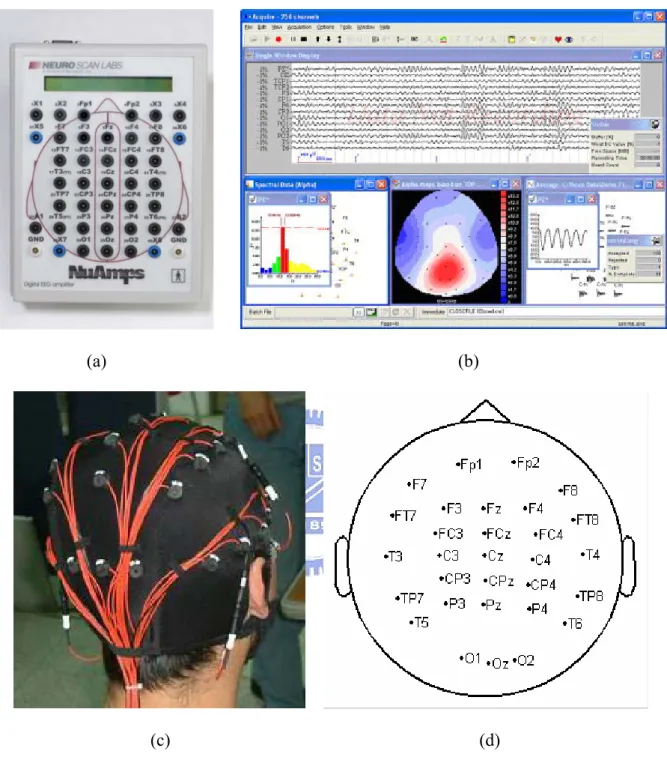
(41) 2.2. EEG Measurement System In this thesis, the EEG/EOG/ECG physiological signals were detected and recorded using the NeuroScan (Scan NuAmps Express System) made by Compumedics Ltd., VIC, Australia. The SCAN NuAmps Express is a fully functional research grade 40-channel digital EEG and ERP recording system. This system allows user to record EEG and conduct spectral analysis, coherence and topographic mapping, where evoked potentials (EP) and event related potentials (ERP) can be recorded, averaged and processed in real-time. Event related spectral analysis, coherence and time frequency measures can be computed. Amplitude and latency measures, peak detection and comparative statistics are provided. Additionally, it also provides a full research grade data processing tool to remove noise and artifacts or decompose complex signals. The whole Scan NuAmps Express System consists of three major components: a NuAmp digital amplifier, a SCAN acquisition and analyzing software, and a multidimensional array of physiological sensors on the scalp based on international 10-20 system as shown in Fig. 2-6. NuAmps: The NuAmps is a 40-channel monopolar digital amplifier for recording high quality physiological signals. These can be accessed via the high density cap connector or the individual Touch Proof connectors on the face of the amplifier. It was designed as a portable system that obtains power from a laptop computer via USB interface. The power supply of the computer uses the isolation transformer to meet FDA patient safety guidelines for leakage current. The NuAmps is designed to record from Sintered Ag/AgCl electrodes which provide the highest quality and most durable electrical interface. Either individual or cap based electrode systems can be used. NuAmps is a DC amplifier with a maximum sampling rate of 1000 Hz and has an 8 bit stimulus and a 4 bit response input that allows integration of the trigging signals for recording ERPs. The NuAmps also has the facility to support TTL iunput signals from external devices. 19.
(42) SCAN: The SCAN software allows for automation of acquisition and data processing. Real time scalp impedance measurement is included, ensuring fast and simple set up times. All acquired data can be exported for subsequent analysis and a direct import to Matlab software is provided. The SCAN software is capable of computing bipolar derivations and different referencing schemes. Reference and ground channels are included in the count of the 40 channels of NuAmp. In additional to EEG and ERP, other physiological measure can be recorded such as ECG, EMG and EOG. The SCAN NuAmps Express system requires two computers to be fully operational, one for SCAN and the NuAmps and the other for the virtual reality (VR) system. The connections to the equipment are as follows: The laptop running SCAN connects to the NuAmps via a USB connection. The VR computer connects to the NuAmps via a DB25 pin connector and pigtail converter cable. All of the above cables have an isolation to meet the FDA requirements for leakage current of patient connected devices.. 20.
(43) (a). (b). (c) Figure 2-6.. (d). The Scan NuAmp Express System consists of (a) 40-channel NuAmp. monopolar digital amplifier, (b) a Scan recording/analyzing software, (c) sintered Ag/AgCl electrodes forming a multidimensional array on the scalp based on (d) international 10-20 system.. 21.
(44) 2.3. Independent Component Analysis (ICA) The problem of blind source separation of recorded multi-channel signals into sums of temporally independent sources had been posed some years earlier. In 1994, Comon proposed the first approaches to blind source separation by minimizing the third and fourth-order correlations among the observed variables and achieved limited success in simulations [65]. In 1996, Cardoso, Bell, and Sejnowski generalized this approach, demonstrating a simple neural network algorithm that used joint information maximization or “infomax” as a training criterion [66-67]. By using a compressive nonlinearity to transform the data and then following the entropy gradient of the resulting mixtures, they were able to demonstrate unmixing of ten recorded voice and music sound sources that had been mixed with different weights in ten simulated microphone channels. Their algorithm used only minimal assumptions about the nature of the sources to be separated. Mixing weights (and thus scalp projections) of individual components were assumed to be fixed, and the time courses of the sources mutually independent. In 1996, Makeig and et al further extended the applications of blind decomposition to biomedical time series analysis by applying the infomax ICA algorithm to decomposition of EEG and event-related potential (ERP) data and reported the use of ICA to monitor alertness [49]. This first report demonstrated segregation of eye movements from brain EEG phenomena, and separation of EEG data into constituent components defined by spatial stability and temporal independence. Subsequent technical reports by Ghahremani et al. [68] and Makeig et al. [69] demonstrated successful separation of six simulated EEG sources mixed into six simulated EEG channels using a realistic three-shell head model. Unmixing performance of the ICA algorithm was shown to degrade gracefully in the presence of noise added to simulate sensor noise or additional small EEG sources. Use of temporal independence as a separation criterion is a novel approach. In contrast, 22.
(45) other EEG decompositions are based on physically modeling the supposed sources [70-71] or on PCA [72]. Makeig et al. evaluated the relative strengths and limitations of the statistical independence criterion using simulations [69]. ICA was successful in separating behaviorally related ERP components in an auditory detection task [73] and several complex visual evoked ERP data sets [43-44, 74-76]. Jung et al. also demonstrated that ICA can also be used to remove artifacts from continuous or event-related (single-trial) EEG data prior to averaging [48, 77-78]. Vigario et al. used a somewhat different ICA algorithm, supported the use of ICA for identifying artifacts in MEG data [79]. Meanwhile, widespread interest in ICA has led to multiple applications to biomedical data as well as to other fields [49, 80]. Most relevant to EEG analysis, McKeown et al. demonstrated the effectiveness of ICA in separating functionally independent components of functional magnetic resonance imaging (fMRI) data [81]. Four main assumptions underlie ICA decomposition of EEG data: (1) Signal conduction times are equal, and summation of currents at the scalp electrodes is linear, both reasonable assumptions for currents carried to the scalp electrodes by volume conduction at EEG frequencies [82]. (2) Spatial projections of components are fixed across time and conditions. (3) Source activations are temporally independent of one another across the input data. (4) Statistical distributions of the component activation values are not Gaussian. (In contrast, PCA assumes that the sources have a Gaussian distribution). The spatial stationarity of the component scalp maps, assumed in ICA, is compatible with the observation made in large numbers of functional imaging reports that performance of particular tasks increases blood flow within small (≈cm3) discrete brain regions [83]. Since functional hemodynamic imaging experiments typically show metabolic brain increases in defined tasks occur in relatively small cortical areas, EEG sources reflecting task-related information processing may generally assumed to sum activity from compact and spatially stationary generators. However, 23.
數據
+7
Outline
Assessment of Brain Activities to Human Cognitive States
Accidents Related to Driver’s Transient Response
Independent Component Analysis (ICA)
EEG Data Collection
Data Analysis
Noise Segmentation and Selection of Optimal Frequency Bands
AFSM-based Driving Performance Estimation/Prediction
Conclusions
相關文件
近年科技業工程師、客運業駕駛、保全人員及醫療機構醫師等接連發
煞停距離:駕駛者從黃燈始亮 到決定煞車,且安全緩和的停
plotyy 2-D line plots with y-axes on both left and right side loglog Log-log scale plot.. semilogx Semilogarithmic plot semilogy Semilogarithmic plot errorbar Plot error bars
We have investigated, designed, and completed the testing of the novel auto leveling, multiple-directing, high refined laser light line red and green laser cross line indictor..
The first stage is to accuse five illegal driving behaviors that include driving on freeway shoulder, without keeping safety spacing, illegal lane change, slowing vehicle driving
Measures of driver behavior and cognitive workload in a driving simulator and in real traffic environment - Experiences from two experimental studies in sweden, Poster
整合 faceLAB 並結合大客車駕駛模擬器,建立大客車駕駛者實驗場景 之情境。利用 faceLAB
Shi, “Worst case tolerance analysis of linear analog circuits using sensitivity bands,” IEEE Trans. Shi, “Worst-case analysis of linear analog circuits using sensitivity bands,”
