國 立 交 通 大 學
資訊管理研究所
碩 士 論 文
使用數位智權管理對資訊商品進行區隔化之分析研究
A Study of Using Digital Rights Management to
Differentiate Information Goods
研 究 生:許 堯 欽
指導教授:羅 濟 群 博士
使用數位智權管理對資訊商品進行區隔化之分析研究
A Study of Using Digital Rights Management to Differentiate
Information Goods
研 究 生:許 堯 欽 Student: Yao-Chin Hsu
指導教授:羅 濟 群 Advisor: Chi-Chun Lo
國立交通大學 資訊管理研究所
碩士論文
A Thesis
Submitted to Institute of Information Management College of Management
National Chiao Tung University in Partial Fulfillment of the Requirements
for the Degree of
Master of Business Administration in
Information Management June 2006
Hsinchu, Taiwan, the Republic of China
利用數位智權管理對資訊商品進行區隔化之分析研究
研究生:許堯欽
指導教授:羅濟群 老師
國立交通大學資訊管理研究所
摘要
數位智慧財產權管理(Digital Rights Management, DRM)是一種用來控制資 訊商產品(像是軟體、音樂或是其他數位內容)所能夠被自由運用的程度的技術。
例如,在Apple’s iTune Store 所購買的音樂只能在他們授權的裝置數量以內同時
播放。這項技術所賦予資訊商品的屬性,稱之為彈性(flexibility)。而這項新的 屬性可以對使用者所認定的價值造成差異。可以想見的是,相同的產品之下,具 有越高的彈性,可以讓使用者願意付出更高的價格購買,因此我們提出了利用彈 性來對市場進行區隔化的定價策略。本篇論文中,我們修改了原本在獨占的市場
底下採用統一定價方式的模型(Uniform Pricing Model),提出了一個區隔化模型
(Two-market-segmentation Based Model);由數學推導證明了進行區隔化之後的 區隔化模型在特定範圍的流通率(permeability)之下,確實可以為廠商帶來更多 的利潤。
A Study of Using Digital Rights Management to Differentiate
Information Goods
Student:
Yao-Chin
Hsu
Advisor:
Dr.
Chi-Chun
Lo
Institute of Information Management
National Chiao Tung University
Abstract
The Digital Rights Management (DRM) technology used to restrict the access to the software, music, or other digital content, (For example, the music purchased from Apple’s iTunes Store, have some DRM schemes built in to limit the number of devices they may be played on. ) brings the information goods with an extra attribute which could make the difference to consumers. Such an attribute was called “flexibility”. Intuitively, we may think the higher flexibility, the higher price that a consumer prefers to pay. We suggest that the firm could use flexibility to differentiate for more profit. In this paper, we adapted the original model with a price to a corresponding flexibility for the differentiation pricing version, a two-market-segmentation based model. There are two pairs of pricing strategies in the new model, and then the result is that the firm can make more profit from differentiating in a monopoly market and a specific range of permeability.
Acknowledgements
說真的,誌謝還真不好寫,有多難寫呢?大概就跟提筆寫論文的第一個字一樣 難。不能免俗的,我也要開始感謝一堆人,不管他們是不是真的有幫到。事實上, 不管我們要做任何事,都必須依賴許多人的幫忙才可能成功;可能會有人知道阿 龍索是去年一級方程式的世界冠軍,但是多數的人都不會知道他們車隊的技師、 研發人員、車隊經理為他的世界冠軍所做的貢獻。這篇論文也只會掛上我跟羅老 師的名字,雖然我不能說沒有你們就沒有這篇論文,沒有你們我還是要畢業的 麻,不過該謝的還是謝一下好了。以下是感謝名單: 學長全體:歐文、龍哥、俊傑、鼎元、宇澤及緒杰…等人 碩二全體:定居實驗室的 PSCC、陪我打電動的仁哥、holy、不時幫大家添購設 備的超哥、坐在實驗室角落的上尉、功夫小子-琮哥、螢光黃的香蕉、跟我友誼 接接的嘉兒、健身教練-鼎爺…等人。 碩一全體:理由王-馬法達、不常來實驗室的aking、返鄉專車司機-老驢、中正 學弟二人組-小郭、宏爺、最近世足賽的焦點之一-pinky…等人 最後我要感謝財法美少女在我寫論文的時候陪我聊天、閒暇時間讓我回去陪她散 散心;有了她的關心,讓我論文的頁數可以在穩定中求成長。每個成功的男人背 後都會有一個偉大的女人,雖然我還不成功,但是我相信只要有妳在,我就可以 更靠近成功。 最後的最後,感謝大家! 2006/6/26Table of Contents
Acknowledgement ...III Table of Contents ...IV Figures...V
Chapter 1 Introduction ...1
1.1 Background and Motivation ...1
1.2 Research Goal ...2
1.3 Chapter Review...3
Chapter 2 Related Literature...4
2.1 Digital Rights Management ...4
2.2 Versioning (Quality Discrimination)...5
2.3 Price Discrimination ...5
2.4 Empirical Evidence...7
Chapter 3 The Proposed Model ...10
3.1 Uniform Pricing Model...10
3.2 Two-market-segmentation Based Model ...14
3.3 Discussion...19
Chapter 4 Analysis of the Proposed Model...20
4.1 The Extra Profit in Area 1...21
4.2 The Extra Profit in Area 2 and Area 3...22
4.3 The Extra Profit in Area 4...24
4.4 Summary ...25
Chapter 5 Conclusion...26
5.1 Conclusion ...26
5.2 Future Works...26
Reference ...27
A1 2005 Year-End Statistics, RIAA...29
Figures
Figure 1: DRM Information Architecture...4
Figure 2: Consumer surplus with uniform pricing Figure 3: First degree price discrimination ...6
Figure 4: Third degree price discrimination ...7
Figure 5: Profit mode due to constraint of α and θ (lnλc is normalized to 1)...21
Figure 6: Extra profit function in area 2 ...22
Figure 7: Extra profit function in area 3 ...23
Figure 8: Extra profit curve in area 2 and area 3 ...24
Chapter 1 Introduction
1.1 Background and Motivation
In recent years, the record industry has always claimed their profit declining was due
to file sharing1. According to the RIAA’s 2005 Yearend Market Report on U.S.
Recorded Music Shipments [A1] total retail units shipped is -7.0% changed from 2000 to 2001, -7.8% changed from 2001 to 2002, -2.6% changed from 2002 to 2003, 4.4% changed from 2003 to 2004 and -7.6% changed from 2004 to 2005. However, even they took action to against illegal file sharing service, the result seems insignificant. Felix Oberholzer and Koleman Strumpf find that the file sharing is not statistically significant enough to the declining record sales. They claimed that perhaps albums are broadly exposed due to file sharing. Although file sharing indeed affects consumers’ willingness to pay for albums, there are more potential customers being announced [5]. There might be so many reasons to cause the record sales decline, to find them out will be difficult but clearly the ultimate goal for the record industry will be making more money.
__________________________
1These quotes are summarized from RIAA’s 2001 year-end shipment:
WASHINGTON—The Recording Industry Association of America (RIAA) announced today that the number of units shipped domestically from record companies to retail outlets and special markets (music clubs and mail order) fell 10.3 percent in 2001.
Specifically, total U.S. shipments dropped from 1.08 billion units shipped in 2000 to 968.58 million in 2001—a 10.3 percent decrease. The dollar value of all music product shipments decreased from $14.3 billion in 2000 to $13.7 billion in 2001—a 4.1 percent decrease, according to figures released today by the RIAA.
“This past year was a difficult year in the recording industry, and there is no simple explanation for the decrease in sales. The economy was slow and 9/11 interrupted the fourth quarter plans, but, a large factor contributing to the decrease in overall shipments last year is online piracy and CD-burning,” said Hilary Rosen, President and CEO of the RIAA. “When 23 percent of surveyed music consumers say they are not buying more music because they are downloading or copying their music for free, we cannot ignore the impact on the marketplace.”
1.2 Research Goal
The emergence of selling music in digital way is inevitable [4]. The obvious problem of selling information goods is homogeneity although it could be also found in the old fashion CDs. For example, the difference between buying a song from the online music store and downloading unlicensed version would probably be insignificant since the digital content can be perfectly duplicated. However, the emergence technology, DRM, is used to enforce pre-defined policies controlling access to software, music, movies, or other digital data [12]. People who get the digital content protected by DRM couldn’t access it without being licensed. In other words, high flexibility could make customers feel the goods more valuable. Carl Shapiro and Hal
R. Varian said in the book, “Price information according to its value, not its cost.” [7] The production of an information good involves high fixed cost but low marginal cost. Hence, the firm should price it according to consumer value, not according to its cost. Moreover, people have different values for a piece of information individually. In this paper, I will differentiate in the monopoly market and prove that it’s better than single price to a corresponding flexibility. Finally, further analyses will be done.
1.3 Chapter Review
After the introduction, some related keywords are explained, like DRM, versioning, and price discrimination in chapter 2. These terms are related with this paper, and the empirical evidence is also mentioned in chapter 2. In the first section of chapter 3, the uniform pricing model proposed by Dirk Bergeman, et al. 2005 is introduced briefly. In the next section, our extended version from the original one, differentiation pricing model is introduced. The result is analyzed in chapter 4. Finally, conclusion is drawn in chapter 5.
Chapter 2 Related Literature
2.1 Digital Rights Management
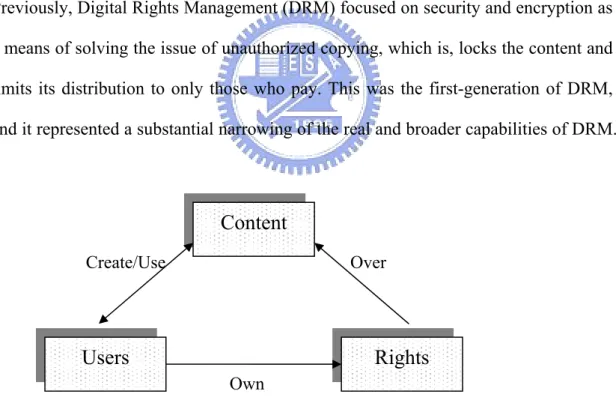
Digital Rights Management poses one of the greatest challenges for content communities in this digital age. Traditional rights management of physical materials benefited from the materials' physicality as this provided some barrier to unauthorized exploitation of content. However, today we already see serious breaches of copyright law because of the ease with which digital files can be copied and transmitted.
Previously, Digital Rights Management (DRM) focused on security and encryption as a means of solving the issue of unauthorized copying, which is, locks the content and limits its distribution to only those who pay. This was the first-generation of DRM, and it represented a substantial narrowing of the real and broader capabilities of DRM.
Content
Users
Rights
Own
Create/Use Over
Figure 1: DRM Information Architecture
e description, identification, trading, The second-generation of DRM covers th
protection, monitoring, and tracking of all forms of rights usages over both tangible and intangible assets including management of rights holders’ relationships.
Additionally, it is important to note that DRM is the "digital management of rights" and not the "management of digital rights." That is, DRM manages all rights, not only the rights applicable to permissions over digital content. [10]
2.2 Versioning (Quality Discrimination)
This term describes situations where the producer provides different qualities/versions
2.3 Price Discrimination
Using DRM to do differentiation is not a novel strategy. In traditional economics, of a good which sell at different prices. [9] It can be achieved in many ways. For example, delay is frequently used. Information is just like an oyster, it usually has the greatest value when it is fresh. [7] If customers want the latest information means they will pay more for fresh information. In our case, flexibility can form the basis for profitable versioning because customers differ significantly in their willingness to pay for storing, copying, or transferring information to other media. Versioning is a form of second-degree price discrimination based on product quality, and is especially useful if degrading one's information good to create one or other lower quality versions not expensive. It seems like to be the same to our setup, whereas in our model, the changing flexibility will increase the probability to get an unlicensed copy for free.
there are some terms about doing things like that, for example, “price discrimination.” It is hard to come up with a satisfactory definition of price discrimination. Roughly, it can be said that the producer price-discriminates when two units of the same physical good are sold at different price, either to the same consumer or to different consumers.
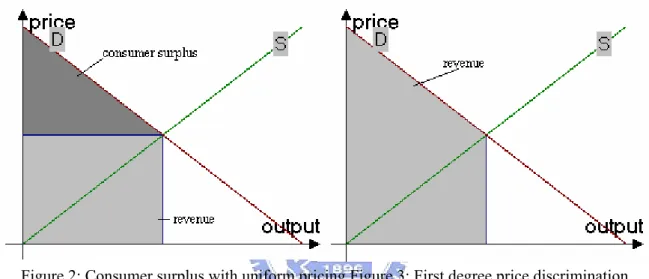
[8] Following Pigou (1932) [2], it is customary to distinguish three types of price discrimination. First-degree price discrimination is perfect price discrimination – the producer succeeds in capturing the entire consumer surplus.
This occurs, for instance, when consumers have unit demands and the producer knows
price discrimination is unlikely in practice, either because of arbitrage or ecause of incomplete information about individual preferences. In the case of exactly each consumer’s reservation price and (if these reservation price differ) can prevent arbitrage between consumers. It then suffices for the consumer’s reservation price.
Perfect
Figure 2: Consumer surplus with uniform pricing Figure 3: First degree price discrimination
b
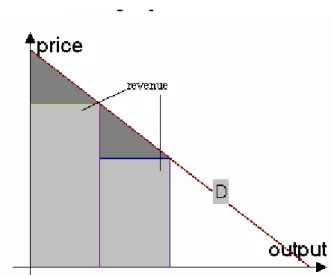
incomplete information about individual preferences, the producer may still be able to extract consumer surplus imperfectly by using the self-selecting devices. This is called second-degree price discrimination. Also the producer may observe some signal that is related to the consumer’s preferences (e.g. age, occupation, location, and etc.) and use this signal to price-discriminate; this is termed third-degree price discrimination.
Figure 4: Third degree price discrimination
The important difference between second-degree and third-degree price discrimination is that third-degree discrimination uses a direct signal about demand, whereas second-degree discrimination selects indirectly between consumers through their choice between packages. In our model, the problem of arbitrage can be ignored
because of DRM. DRM is used to protect information goods from being accessed without licensed so the problem of arbitrage could be transformed into a
tradeoff between flexibility and consumers’ valuation.
2.4 Empirical Evidence
Eric K. Clemons et al. (1999) find that different Online Travel Agents (OTAs) offer tickets with substantially different prices and characteristics when given the same customer request. [1] Some of this variation appears to be due to product differentiation - different OTAs specialize by systematically offering different tradeoffs between ticket price and ticket quality (minimizing connections, depart or return when requested). They conclude that this market is not characterized by perfect
competition, but find that OTAs engage in both horizontal product differentiation and price discrimination in addition to simply having some degree of random inefficiency. Their results further suggest that product differentiation is an important component of strategy for electronic markets, even in goods with relatively simple and unambiguous product descriptions.
The reason to use this research is that travel agents are middlemen between the airlines and the consumer; there is no difference in cost to the OTA for providing a flight of greater convenience. It is the same to the assumption of zero cost to develop DRM in our model.
They test their hypotheses using regression analysis and non-parametric statistics. First, they investigate a baseline case where the prices of the various OTAs’ quotes are compared. This enables them to test the first hypothesis, that there should be no price differences across OTAs. They then use non-parametric tests to examine whether or not OTAs select tickets with different characteristics. Next, they construct a hedonic model of ticket prices as a function of convenience characteristics, and then use this model to repeat the comparison of different OTAs controlling for differences in ticket quality.
Overall, they find that different OTAs offer different types of tickets at substantially different prices. In addition, the variation in prices across OTAs is reduced substantially, but not entirely, when we control for variations in ticket characteristics. These results collectively suggest that product differentiation is indeed occurring.
They also conclude that these results may apply to other settings, which involve the distribution of differentiated goods in electronic markets or information products, which are easily differentiated at low cost. In this paper, we use analytical method to evaluate the effect of this strategy and prove that it’s more profitable for the firm.
Chapter 3 The Proposed Model
3.1 Uniform Pricing Model
This model is part of Dirk Bergeman et al. 2005. [3] We will make a brief introduction in the following paragraphs. The gross utility of consumer i for a digital good is given by
ν
iln(λ).
The valuation νi represents the willingness to pay for the digital good, whereasλ∈[1,λ] represents the flexibility with which the digital good can be used by the consumer. The seller of the digital good determines the price p and the level of flexibility λ at which it sells the digital goods to the consumers. The level of flexibility λ is the key choice variable in the seller’s DRM design. For simplicity, they assume that the marginal cost of increasing flexibility is constant and equal to zero2. The revenue of
the seller is given by the product of the price p and the sold quantity . With
zero marginal cost, the revenue is equal to the net profit, i.e.,
] 1 , 0 [ ∈ q
.
)
,
(
p
q
=
pq
π
Each consumer i can purchase the digital good at the offered price p and flexibility λ. The net utility of a purchase for consumer i is then
.
ln
)
,
(
p
p
u
iλ
=
ν
iλ
−
They refer to the digital good that is purchased from the seller as a licensed product. Alternatively, consumer i can attempt to receive an unlicensed copy of the digital good. They assume that unlicensed copies can only be made from licensed ones, but our results easily extend to the case where they can also be obtained from unlicensed
ones. However, consumer i cannot be certain of receiving an unlicensed copy. Let the probability that he receives an unlicensed copy be given by
].
1
,
0
[
∈
q
αλ
They assume that unlicensed copies can only be retrieved from licensed ones due to the protection of DRM. The parameterαrepresents the exogenous access rate to digital goods and characterizes the permeability of the content-distribution environment, not the good itself. They considerαto be influenced by both technical and non-technical factors, so increased permeability can result, e.g., from more lenient copyright law or less vigilant enforcement of existing copyright law, from more lenient or more easily cracked DRM.
The expected utility of a copy of the digital good with respect to unlicensed access is given by
).
ln
(
)
(
c i c cq
u
λ
=
αλ
ν
λ
The level λc of flexibility of an unlicensed copy may or may not be equal to the flexibility of a licensed copy. In one scenario, a consumer receives a music file from a friend after the friend authorizes him as a listener. In this case, the consumer lacks the
___________________________
2In the case of digital goods, the assumption of low marginal costs appears to be rather innocuous. We should point out, however, that, in the presence of DRM technology, there is a sense in which the cost of providing flexibility may not be constant or even monotone increasing. It might be most difficult technically to support intermediate levels of flexibility; very lenient or very strict DRM rules may be easier to implement. To evaluate the cost of DRM may be another topic.
flexibility of authorizing additional devices, which he would have if he owned an original. In other scenarios, the loss in utility could be attributable to monetary costs of sharing or expected costs, such as the risk of fines for copyright infringement. In still other scenarios, an unlicensed copy of the digital good may have very few constraints attached to it and this may lead to λc = λ.
The value of the digital good is identical for each consumer and vi = v for all i. Since they would like to denote the effect of flexibility, they assume that all consumers have the same evaluation about this product. The fraction of consumers who buy the digital
good can be denoted by The indifference between buying and copying is
characterized by: ]. 1 , 0 [ ∈ q vlnλ− p=αλq(vlnλc) (1) After they normalize the basic valuation to v=1, the equilibrium indifference allows us to compute the demand function for the digital good:
[0,1]. ln ln ) , ( = − ∈ c p p q λ αλ λ λ (2) The profit function which depends on the charged price p and the allowed flexibility will be: . ln ln ) , ( c p p pq p λ αλ λ λ π = = − (3) Maximizing the equation (3) for p and λ leads to the following four equilibriums:
1. The equilibrium price p* for the digital good is:
⎪ ⎪ ⎩ ⎪⎪ ⎨ ⎧ ≥ < − = c c c e if e if p λ α λ α λ α ln 1 , 1 ln 1 , 1 ln 1 ln * 2 2 (3.1)
2. The equilibrium flexibility λ* is: ⎪ ⎪ ⎩ ⎪⎪ ⎨ ⎧ ≥ < = c c c e if e e if λ α λ α λ α λ ln 1 , ln 1 , ln 1 * 2 2 2 (3.2)
3. The equilibrium sales volume q* is:
⎪ ⎪ ⎩ ⎪⎪ ⎨ ⎧ ≥ < = c c c e if e e if q λ α λ α λ α ln 1 , ln 1 ln 1 , 1 * 2 2 2 (3.3)
4. The equilibrium profit is:
⎪ ⎪ ⎩ ⎪⎪ ⎨ ⎧ ≥ < − = c c c c e if e e if λ α λ α λ α λ α α π ln 1 , ln 1 ln 1 , 1 ) ln ln( 1 ) ( 2 2 2 (3.4)
As we can see, there are two pricing strategies in the equilibrium. When the permeability c e λ α ln 1 2
< , the firm will decide to make all consumers buy the
product with a lower price and a corresponding rigid flexibility. The other condition is that when the permeability
c e λ α ln 1 2
≥ , the firm will decide to sell to specific
consumers with a higher price and a corresponding elastic flexibility. First, we can find that consumers will be divided into two groups. The firm will choose to let all consumers buy the product in a small permeability α and choose to charge a high price to the group with people more likely to pay in a big permeability α. In the next section, we will modify the original model into a two-market-segmentation based model.
3.2 Two-market-segmentation Based Model
Now we use differentiation strategy in this model. There are two different types of consumers in this model now, and the firm will maximize profit from each one. The model needs to be changed as follows. First, we assume that the value of α is the same for both two market segmentations. Second, λc for all of the flexibility is the same.
The variable θ represents the proportion of potential consumers in first market segmentation and 1-θ for the second market segmentation and θ is between 0 and 1. The demand functions are as followed.
From (2), market segmentation 1:
(
)
[0, ]ln ln , 1 1 1 1 1 1
αλ
λ
θ
λ
λ
= − ∈ c p p q (4)From (2), market segmentation 2:
(
)
[
θλ αλ
]
λ λ = − ∈ 0,1− ln ln , 2 2 2 2 2 2 c p p q (5)The profit function can be denoted:π
(
p1,p2,λ1,λ2)
= p1q1 + p2q2. ln ln ln ln 2 2 2 2 1 1 1 1 c c p p p p λ αλ λ λ αλ λ − + − = (6)
Maximizing the equation (6) leads to the following seven equilibriums.
1. The equilibrium price p1* for the digital good is:
⎪ ⎪ ⎩ ⎪⎪ ⎨ ⎧ ≥ < − = c c c e if e if p λ θ α λ θ α λ θα ln 1 , 1 ln 1 , 1 ln 1 ln * 2 2 1 (6.1)
2. The equilibrium flexibility λ1* is: ⎪ ⎪ ⎩ ⎪⎪ ⎨ ⎧ ≥ < = c c c e if e e if λ θ α λ θ α λ θα λ ln 1 , ln 1 , ln 1 * 2 2 2 1 (6.2)
3. The equilibrium sales volume q1* is:
⎪ ⎪ ⎩ ⎪⎪ ⎨ ⎧ ≥ < = c c c e if e e if q λ θ α λ α λ θ α θ ln 1 , ln 1 ln 1 , * 2 2 2 1 (6.3)
4. The equilibrium price p2* for the digital good is:
⎪ ⎪ ⎩ ⎪⎪ ⎨ ⎧ − ≥ − < − − = c c c e if e if p λ θ α λ θ α λ α θ ln ) 1 ( 1 , 1 ln ) 1 ( 1 , 1 ln ) 1 ( 1 ln * 2 2 2 (6.4)
5. The equilibrium flexibility λ2* is:
⎪ ⎪ ⎩ ⎪⎪ ⎨ ⎧ − ≥ − < − = c c c e if e e if λ θ α λ θ α λ α θ λ ln ) 1 ( 1 , ln ) 1 ( 1 , ln ) 1 ( 1 * 2 2 2 2 (6.5)
6. The equilibrium sales volume q2* is:
⎪ ⎪ ⎩ ⎪⎪ ⎨ ⎧ − ≥ − < − = c c c e if e e if q λ θ α λ α λ θ α θ ln ) 1 ( 1 , ln 1 ln ) 1 ( 1 , 1 * 2 2 2 2 (6.6)
7. The equilibrium profit is: Whenθ >1/2, ⎪ ⎪ ⎪ ⎩ ⎪ ⎪ ⎪ ⎨ ⎧ − ≥ − < ≤ − − − + < − + − − − − = c c c c c c c c e if e e e if e e if λ θ α λ α λ θ α λ θ λ α θ θ λ α λ θ α λ α θ θ θ θ θ α π ln ) 1 ( 1 , ln 1 ln ) 1 ( 1 ln 1 ), 1 ln ) 1 ( 1 )(ln 1 ( ln 1 ln 1 , 1 ) ln ln( 1 ) 1 ln( ) 1 ( ln ) , ( 2 2 2 2 2 2 (6.7.1) Whenθ =1/2, ⎪ ⎪ ⎩ ⎪ ⎪ ⎨ ⎧ − ≥ < − = c c c c e if e e if λ θ α λ α λ θ α λ α α π ln ) 1 ( 1 , ln 1 ln 1 , 1 ) ln ln( 1 ) ( 2 2 2 (6.7.2) Whenθ <1/2, ⎪ ⎪ ⎪ ⎩ ⎪ ⎪ ⎪ ⎨ ⎧ ≥ < ≤ − − + − < − + − − − − = c c c c c c c c e if e e e if e e if λ θ α λ α λ θ α λ θ λ θα θ λ α λ θ α λ α θ θ θ θ θ α π ln 1 , ln 1 ln 1 ln ) 1 ( 1 ), 1 ln 1 (ln ln 1 ln ) 1 ( 1 , 1 ) ln ln( 1 ) 1 ln( ) 1 ( ln ) , ( 2 2 2 2 2 2 (6.7.3)
Proof. The first-order conditions for maximizing the profit function (6) are: 0 ln 2 ln ) , , , ( 1 1 1 1 2 1 2 1 = − = ∂ ∂ c p p p p λ αλ λ λ λ π (7) 0 ln 2 ln ) , , , ( 2 2 2 2 2 1 2 1 = − = ∂ ∂ c p p p p λ αλ λ λ λ π (8) 0 ln ln 1 ) , , , ( 2 1 1 1 1 1 2 1 2 1 = − + = ∂ ∂ c p p p p λ αλ λ λ λ λ π (9) 0 ln ln 1 ) , , , ( 2 2 2 2 2 2 2 1 2 1 = − + = ∂ ∂ c p p p p λ αλ λ λ λ λ π (10) Solving equation (7) for p1 and inserting it in equation (9), we obtain p1 = 1 and λ1 =
e2, resulting in the quantity
c e q λ α ln 1 2
1 = . Since the demand (4) is limited toq1 ≤θ,
the maximization is constrained by
c e for p q λ θ α θ λ ln 1 ) , ( 1 1 2 1 = < . Solving
this restriction for p1 and inserting it in equation (9), we obtain 1,
ln 1 ln * 1 = − c p λ θα , ln 1 1 c λ θα λ = and q1=θ for c e λ θ α ln 1 2
< , the equation (6.1), (6.2, (6.3) are
proved.
Likewise for the p2, λ2, and q2, the equation (6.1), (6.2, (6.3) can be proved in the same way.
By combining the equilibrium price and quantity with joining the range of permeability α, the equilibrium profit can be concluded.
Whenθ >1/2, and c e λ θ α ln 1 2
< , from the equation (6.1), (6.3), (6.4), (6.6), the
) 1 )( 1 ln ) 1 ( 1 (ln ) 1 ln 1 (ln ) , ( 1 1 2 2 θ λ α θ θ λ θα θ α π − − − + − = + = c c q p q p 1 ) ln ln( 1 ) 1 ln( ) 1 ( ln − − − + − − = c λ α θ θ θ θ . When ,θ >1/2 and c c e e λ α θ λ θ (1 ) ln 1 ln 1 2
2 ≤ < − , from the equation (6.1), (6.3),
(6.4), (6.6),the equilibrium profit function is
) 1 )( 1 ln ) 1 ( 1 (ln ) 1 ( ln 1 ) , ( 1 1 2 2 2 θ λ α θ λ α θ α π − − − + = + = c c e q p q p ) 1 ln ) 1 ( 1 )(ln 1 ( ln 1 2 + − − − = c c e λ θ θ α λ α . When ,θ >1/2 and c e λ θ α ln 1 2
≥ , from the equation (3.4) the equilibrium profit
function is c e pq λ α α π ln 1 ) ( = = 2 .
Above all, the equation (6.7.1) can be proved, likewise for the equation (6.7.3) when 2
/ 1 <
θ .
When it comes to θ =1/2, this situation is a special case in our model.
Since ,θ =1/2 the demand function (4) and (5) for both market segmentations are the same. The gap,
c c e e λ α θ λ θ (1 ) ln 1 ln 1 2
2 ≤ < − disappear, too. Therefore, the firm
still uses the original uniform pricing model due to chapter 3.1 the equation (6.7.2) can be proved.
3.3 Discussion
From the equilibriums in the proposed model above, the firm makes more profit than that in the original model. The term, versioning and price discrimination are both relative to differentiate the product to earn more consumer surplus. The basis of the proposed model is very similar to which we mentioned in the literature.
Also, the empirical evidence that we present in chapter 2.4 can support our result. In Eric K. Clemons et al. (1999), they finally conclude that OTAs differentiated the airplane tickets with different ticket quality. They think these may apply to other settings, which involve the distribution of differentiated goods in electronic markets or information products, which are easily differentiated at low cost. Our result shows that the firms differentiate their product because it’s profitable. It is also incentive for the firms like OTAs to differentiate their tickets.
However, it is intuitive to think that whether it remains good to make more market segmentations or not. Tirole (1988) assumes that firms cover the markets and shows that, in this case, firms maximize product differentiation over the available range of qualities. [8] It seems like good to give every single customer a price to a corresponding flexibility. The assumption in our model is that consumers just use the product; the only different is between buying the product and using it for free. To solve the situation of more than two market segmentations, we have to change the basis of our model. Moreover, the ignorance of the cost of Digital Rights Management needs to be handled more carefully. It could be another topic, so we do not talk about this situation in this paper.
Chapter 4 Analysis of the Proposed Model
In previous chapter, we can easily know that the proposed model retrieves more consumer surplus to bring more profit. Now, we make further analysis about the
relationship between profit and environment variables (α and θ). First, the
environment variables could be used to denote different types of the firm’s pricing strategies. Then, according to these conditions, we present the relationship between profits.
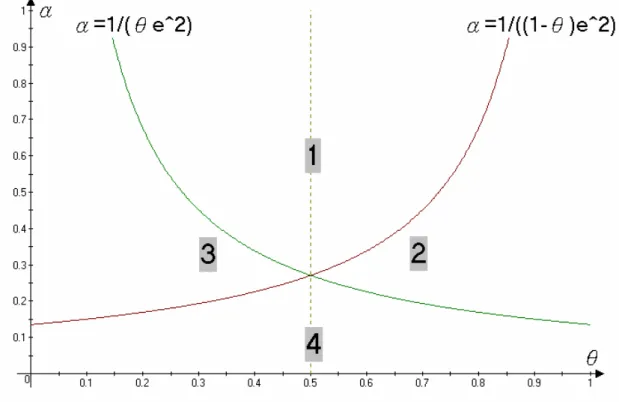
The four areas in figure 5 represent three kinds of the firm’s pricing strategies in different environment variables (α andθ). The proposed model really takes effects on
the area 2, 3, and 4. Since the firm’s pricing strategies in area 2 and 3 are the same, there are three pricing strategies in four areas.
In area 1, Combining (6.7.1) and (6.7.3) when θ >1/2 and
c e λ θ α ln ) 1 ( 1 2 − ≥ , the
firm will use the uniform pricing, likewise for θ <1/2 and
c e λ θ α ln 1 2 > .
In area 2, Combining (6.7.1) and (6.7.3) when θ >1/2 and
c c e e λ α θ λ θ (1 ) ln 1 ln 1 2
2 ≤ < − , the firm will choose to charge high price to market
segmentation 1 and low price to market segmentation 2; in area 3, when θ <1/2 and , ln 1 ln ) 1 ( 1 2 2 c c e e λ α θ λ θ ≤ <
− the firm will choose to charge high price to market
In area 4, Combining (6.7.1) and (6.7.3) when θ >1/2 and c e λ θ α ln ) 1 ( 1 2 − < , the
firm will choose to charge relative low price to both market segmentations, likewise for θ <1/2 and c e λ θ α ln 1 2 < .
According to environment variables (α andθ), we can know three kinds of behaviors
from figure 5. Now we would like to know the relationship with profit. In the next sections, the firm’s profit in each area will be introduced.
Figure 5: Profit mode due to constraint of α and θ (lnλc is normalized to 1)
4.1 The Extra Profit in Area 1
In area 1, the firm uses the strategy of the original uniform pricing model because of c e λ θ α ln ) 1 ( 1 2 − ≥ when θ <1/2 otherwise c e λ θ α ln 1 2
≥ whenθ >1/2. Since the
4.2 The Extra Profit in Area 2 and Area 3
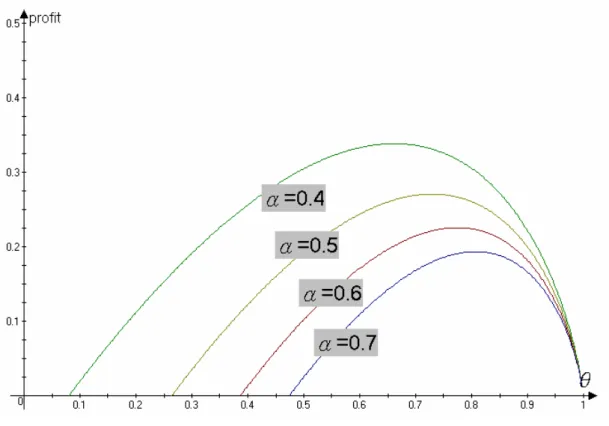
In area 2, the extra profit that the firm gets from differentiation is ) 1 ln ) 1 ( 1 )(ln 1 ( ) , ( − − − = c f λ α θ θ θ α .
In order to ease analysis, lnλc is normalized to 1 in this and next figure because it is not a critical variable here. In figure 6, the left tail approaches to 0 with a decreasing α. This curve is similar to previous one. In this figure, the area where θ is between 0.5 and 1 is meaningful.
Figure 6: Extra profit function in area 2
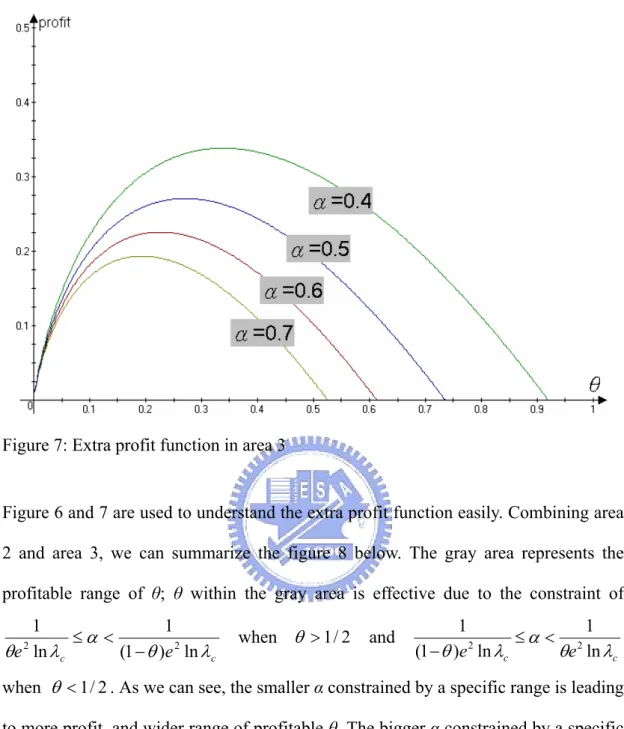
In area 3, the extra profit that the firm gets from differentiation is ) 1 ln 1 (ln ) , ( = − c f λ θα θ θ α .
In figure 7, the left tail approaches to 1 with a decreasing α. In this figure, the area where θ is between 0 and 0.5 is meaningful.
Figure 7: Extra profit function in area 3
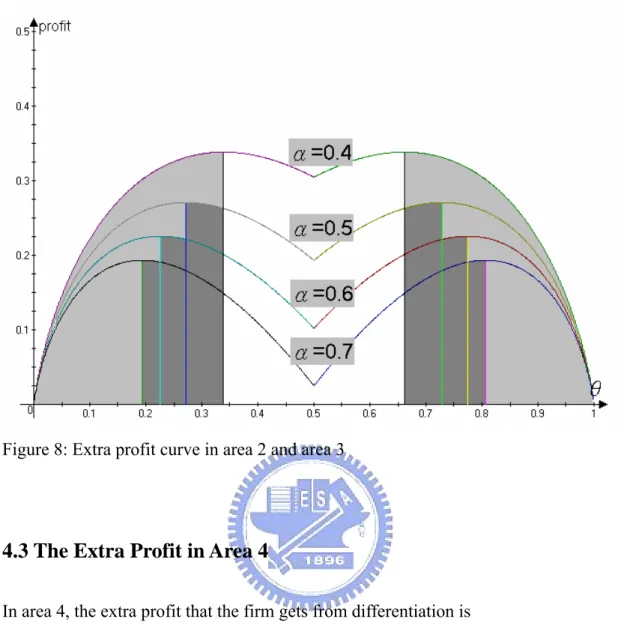
Figure 6 and 7 are used to understand the extra profit function easily. Combining area 2 and area 3, we can summarize the figure 8 below. The gray area represents the profitable range of θ; θ within the gray area is effective due to the constraint of
c c e e λ α θ λ θ (1 ) ln 1 ln 1 2 2 ≤ < − when θ >1/2 and c c e e λ α θ λ θ ln 1 ln ) 1 ( 1 2 2 ≤ < −
when θ <1/2. As we can see, the smaller α constrained by a specific range is leading to more profit, and wider range of profitable θ. The bigger α constrained by a specific range is leading to less profit, and narrower range of profitable θ. Eventually, as the growth of α, the firm can only profit from differentiation in a narrow range of θ. As the decrease of α, the firm can profit from differentiation in a wide range of θ. Finally, when c e λ θ α ln 1 2 ≤ or c e λ θ α ln ) 1 ( 1 2 −
≤ , the firm will switch to area 4 which is
Figure 8: Extra profit curve in area 2 and area 3
4.3 The Extra Profit in Area 4
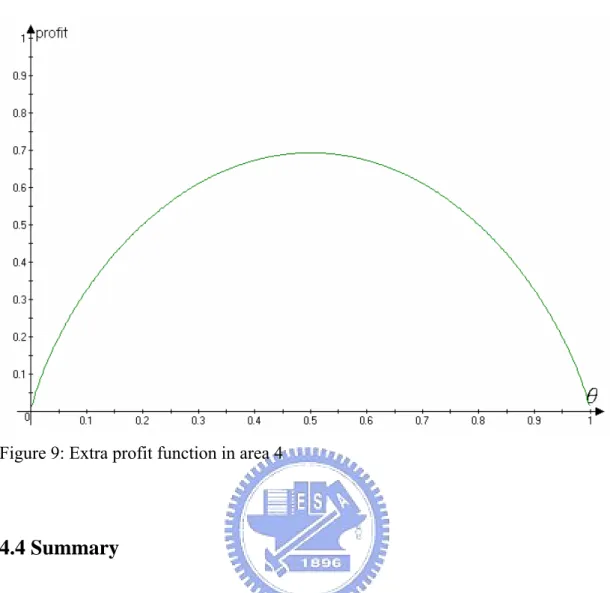
In area 4, the extra profit that the firm gets from differentiation is ) 1 ln( ) 1 ( ln ) (θ =−θ θ − −θ −θ f .
We can see the profit gets higher when the growth of θ is from 0 to 0.5 and gets lower when that of θ is from 0.5 to 1. While θ is more approaching to 0.5, the firm can make more profit. However, when θ is equal to 1 or 0, the firm will use uniform pricing since differentiation will bring no more profit. Overall, the extra profit in this area is more than it is in area 2 and 3.
Figure 9: Extra profit function in area 4
4.4 Summary
Area 2 and 3 represents the situation between area 1 and 4. In area 2 and 3, the higher permeability reduces the profit and narrows the range of profitable θ. Finally, the firm will return to uniform pricing (area 1) as a growing permeability. On the other hand, the firm will switch to more profitable differentiation (area 4) as a decreasing α. Also, the firm can easily profit in full range of θ. However, there are some differences between area 4 and 2 or between area 4 and 3. Although the firm makes more profits in area 4 than it does in area 2 and 3, it is caused by different permeability. A lower permeability is leading to a more profitable situation for the firm.
Chapter 5 Conclusion
5.1 Conclusion
The evaluation of the information technology, DRM could be realized. We can use the proposed model to know that it’s not always good to divide the market into several segmentations, at least in our cases. According to the original model, we know that there are two kinds of consumer, the consumers would like to buy and the others do not. Then we make two different market segmentations to charge them individually and it has been proved more profitable in some ranges of α.
Also, we can get some guide lines from the figure 8. The higher α (permeability) makes the firm get extra profit in only extreme θ (the proportion between market segmentation 1 and 2). If the managers know exactly the proportion between their market segmentations is large, they will make extra profit from differentiation using DRM, too. However, even the managers have no idea about the proportion between market segmentations; they could make extra profit due to reduce α (permeability).
5.2 Future Works
There are still some works having to be done in this model. First, even we do not talk much about the cost of a digital good, the cost of doing Digital Rights Management shall to be related with flexibility. In previous section,
higher flexibility and lower one.
Also, we can extend the monopoly market into a duopoly one and the platform mentioned by the original authors can be multiple. In other words, there could be a complicate game with multiple distributors and platforms.
Reference
[1] Eric K. Clemons, Il-Horn Hann, and Lorin M. Hitt, “The Nature of Competition in Electronic Markets: An Empirical Investigation of Online Travel Agent Offerings”, WP, the Wharton School of the University of Pennsylvania, 1999.
[2] Pigou A. C., “Economics of Welfare, 4th edition,” London: Macmillan, 1932
[3] Bergemann, Dirk, eisenbach, thomas, Feigenbaum, Joan and Shenker, Scott, "Flexibility as an Instrument in Digital Rights Management", Cowles Foundation Discussion Paper No. 1505, 2005.
[4] IFPI, “Digital formats continue to drive the global music market”, 2006
http://www.ifpi.org/site-content/press/20060331a.html
[5] Felix Oberholzer and Koleman Strumpf, “The Effect of File Sharing on Record Sales: An Empirical Analysis”, unpublished paper (Harvard Business School and Department of Economics, University of North Carolina Chapel Hill), 2004 [6] Ivan Png, “Managerial Economics, 2nd edition,” Blackwell Publishers, 2002 [7] Carl Shapiro and Hal R. Varian, “Information Rules: A Strategic Guide to Network Economy”, Harvard Business School Press, 1999.
[9] Hal R. Varian, “Versioning Information Goods”, University of California, Berkeley, 1997.
[10] Renato Iannella, “Digital Rights Management (DRM) Architecture,” D-Lib Magazine vol. 7 no.6, 2001
[11] RIAA, “Recording Industry Announces 2001 Year-End Shipments”, 2001 http://www.riaa.com/news/marketingdata/2001_us_yearend.asp
[12] Wikipedia, “Digital rights management”, 2006
Appendix A
A1 2005 Year-End Statistics, RIAA
A2 Notation Dictionary
Explanation
ν The consumers’ willingness to pay for information good.
p The price.
q The sold quantity.
λ
The level of flexibility of a licensed copy.α
The parameter represents the exogenous access rate to informationgoods
λ
cThe level of flexibility of an unlicensed copy may or may not be equal to the flexibility of a licensed copy.
θ
The proportion of one of the market segmentations.(The proportion of the other segmentation is (1-