國立高雄大學國際商業管理碩士學位學程
碩士論文
An Evaluation of Czech Republic Competitiveness
評估捷克共和國的競爭力
研究生: Linda Kasparova
指導教授: Dr. Po-Chih Lee
Dr. Yung-Kai Yang
i
An Evaluation of Czech Republic´s
Competitiveness
Advisor(s): Dr. Po-Chih Lee
Dr. Yung-Kai Yang
Department of Asia-Pacific Industrial and Business Management
National University of Kaohsiung
Student: Linda Kasparova
International Master of Business Administration
National University of Kaohsiung
ABSTRACT
This work deals with competitiveness of the Czech Republic. The goal is to describe the current state of the Czech Republic´s competitiveness and to suggest recommendations that the government should follow to improve the country´s ranking. In the literature review, the work describes different approaches to competitiveness and, as an example, points to institutions that use the respective approaches. Also, SWOT analysis is described here as a strategic tool that can help with general analysis. Chapter 3 summarizes the methodology that has been applied to this case. Chapter 4 presents the major findings. The legal framework is introduced here, both on the European level and on the national level. Also, economic indicators such as GDP per capita, GDP growth rate, national savings, etc. are presented here to provide greater perspective on the current state. Finally, Global competitiveness Reports are used to identify the most problematic areas and opportunities for improvement. Chapter 5 summarizes concluding remarks and suggests areas for future studies.
Keywords:
Competitiveness,
approaches
to
national
competitiveness, SWOT analysis, competitiveness of the Czech
Republic, Global Competitiveness Report
ii
Table of Contents
Chapter One: INTRODUCTION ... 1
1.1 Background Information ... 1
1.2 Main Purpose of the Study ... 4
1.3 Flow chart ... 5
Chapter Two: REVIEW OF LITERATURE ... 6
2.1 Theoretical Framework of Competitiveness ... 6
2.1.1 Approaches to International Competitiveness ... 7
2.2 SWOT Analysis ... 15
2.2.1 Historical background ... 15
2.2.2 Analysis What is SWOT ... 15
2.2.3 Advantages of SWOT ANALYSIS ... 18
2.2.4 Limitations of SWOT analysis ... 19
Chapter Three: METHODOLOGY ... 20
Chapter Four: MAJOR FINDINGS... 22
4.1 Historical Excursus ... 22
4.2 EU competitiveness framework ... 23
4.2.1 Lisbon Strategy ... 23
4.2.1 Europe 2020 Strategy ... 29
4.3 Czech competitiveness framework ... 33
4.3.1. Lisbon strategy ... 33
4.3.2 Europe 2020 ... 34
4.3 Economic profile of the Czech Republic... 36
4.3.1 International trade ... 36
4.3.2. Gross Domestic Product (GDP) ... 39
4.3.3. National savings ... 42
4.3.4 Productivity ... 44
4.3.4 Global competitive reports (GCR) ... 45
4.4.1 Strengths ... 51
4.4.3 Opportunities ... 55
4.4.4 Threats ... 58
Chapter Five: CONCLUDING REMARKS ... 59
5.1 Research Conclusion... 59
5.2 Limitations ... 61
iii
List of Tables
Table 4.1 Pillars and Priorities of the Lisbon Strategy ··· 27
Table 4.2 Main Goals and Indicators ··· 30
Table 4.3 Flagship initiative ··· 31
Table 4.4 GDP per capita ··· 35
Table 4.5 GDP growth rates ··· 39
iv
List of Figures
Figure 1.1 Competitiveness of the Czech Republic ··· 3
Figure 1.2 Flow Chart: Research Process ··· 5
Figure 2.1 New Systematic Framework for Competitiveness ··· 14
Figure 2.2 Strategic Management Process ··· 16
Figure 2.3 SWOT Analysis ··· 16
Figure 2.4 SWOT Analysis Scheme ··· 17
Figure 3.1 Research Paper ··· 21
Figure 4.1 Top 15 export destinations of the Czech Republic ··· 36
Figure 4.2 Share of international trade on Czech GDP ··· 37
Figure 4.3 Significance of industries on Czech GDP ··· 38
Figure 4.4 GDP per capita ··· 39
Figure 4.5 GDP growth rate ··· 40
Figure 4.6 Savings as % of GDP ··· 43
Figure 4.7 Real Labour productivity per person ··· 44
Figure 4.8 CR & SR: Global Competitiveness Report 2006-07 ··· 45
Figure 4.9 CR & SR: Global Competitiveness Report 2017-18 ··· 46
Figure 4.10 Pillars value change 2006-07 – 2017-18 ··· 47
Figure 4.11 Most Problematic Factors of Doing Business··· 49
1
Chapter One: INTRODUCTION
1.1 Background Information
The topic of national competitiveness was chosen for its importance. The world is becoming smaller. Economic integration and globalization are real. To succeed in international markets, companies must stay ahead of their competitors. They need to optimize their internal processes, but they also need supportive environment. This is the place where national governments get involved as it is their responsibility to create space that encourages economic activity and entrepreneurship.
Competitiveness is a complex economic category. It has many layers and one can observe competitiveness on company level, industry level or nation level. One can also choose what indicators to use. Results then may vary significantly depending on the research area. Therefore, it is not surprising that a clear definition of competitiveness is still missing. Some authors may stress country´s technological leadership, whereas others see importance in export shares, growth rates or productivity. Today, most institutions are leaning towards seeing productivity as the main indicator of economic success of a country.
According to this thought current, a nation´s standard of living is determined by productivity of its economy, which is measured by value of goods and services produced per unit of the national´s human, capital and natural sources of a country. In other words, productivity is the key to increase living standard of country´s citizens. Quality of life and growing living standard seem to be the ultimate goals of economic activity.
2
Nowadays, there are many institutions mapping national competitiveness all around the world. One of the most respected organization in this field is the World Economic Forum (WEF). It was established in 1971 and since then, it has been issuing its Global Competitiveness Reports (GCR). It developed the Global Competitiveness Index (GCI) that combines qualitative and quantitative data together. The goal is to provide a complex view on the business environment in a country. These reports can serve as a guideline for governments as it provides them not only with the complex view on their business environment, but it also allows them to compare certain areas (pillars) with other states.
This work deals with competitiveness of the Czech Republic with the focus on development of its competitive position according to the GCRs and to suggest recommendations for improving its competitive performance. The research period starts in 2004 when the Czech Republic joined the EU. It was approximately around at this time, when the country started to seriously address the issue of competitiveness. Czechia joined the European common market and its domestic companies had to face much stronger pressure of competition.
The data presented in this work, will be compared with economic performance of Slovakia. The comparison itself is not the goal of this work. Rather it will be used to point to different development in the two nations that used to be united in one country. Therefore, they have a lot in common but there are also many differences between them (for example Euro). Today, both countries participate in EU´s strategies for increasing economic growth and competitiveness.
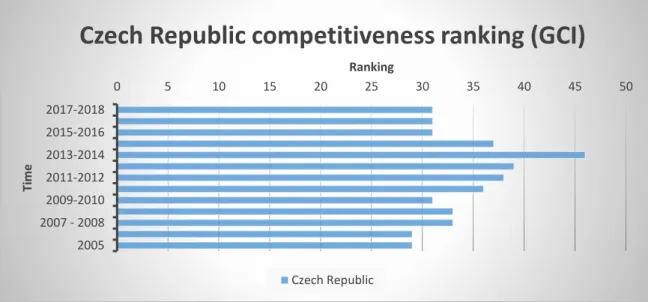
The chart below shows the competitive position of the Czech Republic according to the Global Competitiveness Report (GCR) over the course of time. The country has a reputation of a stable country with solid industrial background and qualified workforce. However, its competitive position does not seem to be developing dynamically.
3
Its position oscillates around the 30th place during most of the research period.
According to the report, Czech competitiveness improved slightly in the last few years. The government, however, is not satisfied with this result and believes that the Czech Republic has the potential to significantly improve its position – taking into consideration technological orientation of the country, qualified labour and the fact that Czechia has one of the most stable economy in the European Union.
Figure 1.1 Competitiveness of the Czech Republic Source: WEF. Global competitiveness reports.
0 5 10 15 20 25 30 35 40 45 50 2005 2007 - 2008 2009-2010 2011-2012 2013-2014 2015-2016 2017-2018 Ranking Ti me
Czech Republic competitiveness ranking (GCI)
4
1.2 Main Purpose of the Study
It should be the ambition of every country to increase its competitiveness and work towards improving the living standard of its citizens. The last few decades have been very challenging for the Czech Republic. The country went through transformation of its political and economic systems and became a member the European Common Market in early 00´s.
In 2012, the Czech Ministry of Industry and Trade introduced The 2012 – 2020 International Competitiveness Strategy. Back on the Top. It is a comprehensive report that addresses the government intention to move the Czech Republic among the top 20 most competitive economies in the world. The document is also a reaction to the EU´s new strategic program called Europe 2020 that was approved in 2010. Both documents are complementary. The Europe 2020 strategy serves as a guideline. Member states are committed to follow the EU´s goals and implement them into their national programs.
The main objectives of this work are following: 1. To map the current state of competitiveness.
2. To make recommendations on how to improve its competitiveness position and eventually, reach the objective to be among the top 20 most competitive countries in the world.
The SWOT analysis will be used to help us describe and better understand the external and internal environment. .The focus will be on Global Competitiveness Reports. Qualitative data from these reports will be used to help us understand the current state and allow us to make recommendations.
5
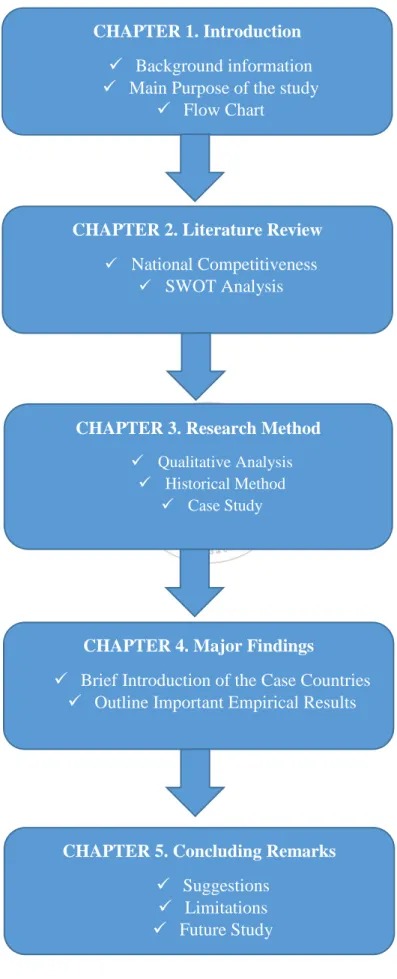
1.3 Flow chart
Figure 1.2 Flow Chart. Research Process
CHAPTER 1. Introduction
✓ Background information ✓ Main Purpose of the study
✓ Flow Chart
CHAPTER 5. Concluding Remarks
✓ Suggestions ✓ Limitations ✓ Future Study
CHAPTER 4. Major Findings
✓ Brief Introduction of the Case Countries ✓ Outline Important Empirical Results
CHAPTER 3. Research Method
✓ Qualitative Analysis ✓ Historical Method
✓ Case Study
CHAPTER 2. Literature Review
✓ National Competitiveness
6
Chapter Two: REVIEW OF LITERATURE
2.1 Theoretical Framework of Competitiveness
The importance of national competitiveness is given by economic integration and globalization that increases competitiveness in the international trade. The necessity of improving national competitiveness has been widely discussed in both economic theories and practical life. The market economy is based on competition and therefore, different theories consider competition to be a great part of economic activity. (Nguyen, 2018)
Many authors or institutions see national competitiveness differently. Some authors may stress a country´s technological leadership, whereas others export shares, productivity or growth rate (Nguyen, p. 25). Some scholars question meaning of such debate. One of them is Krugman. He believes that national economies are not in direct competition with each other. States can not go bankrupt in the way firms do (Krugman, 1994). Lall (2000) on the other hand, argues that national competitiveness is real and can be defined and measured.
Porter, who is considered “the father of competitiveness” agreed with this thought current and stated that the concept of national competitiveness is meaningful and can be explained by national productivity (Porter, 1990). A nation´s standard of living is determined by productivity of its economy, which is measured by value of goods and services produced per unit of the national´s human, capital and natural sources (Porter, 1990).
7
2.1.1 Approaches to International Competitiveness
To introduce some of the most common thought currents of national competitiveness, the work of Michael Porter will be used. Porter´s definitions correspond with the most current approaches.
External competitiveness
The first approach is called external competitiveness. It is based on competition among companies and their ability to be successful in the global market. One of the institutions following this approach is the Organisation for Economic Cooperation (OECD) which defines competitiveness as a measure of a country´s advantage or disadvantage in selling its products in international market.
Kačírková (2017) in this context warns about not to confuse comparative advantage and competitive advantage. While comparative advantage is more or less given to each country (effectivity with which factors of production are used and consequently the impact it has on increasing competitiveness in global market), competitive advantage is a broader term and refers to the ability of an economy to grow and improve over the course of time. According to this thought current, a country is successful when it achieves its goals (meaning goals as market shares in global market).
From Czech authors, Mertlík (2002) represents the same approach and sees national competitiveness as an indicator that shows how successful domestic companies are in international markets. Competitive are those countries that are capable to achieve their market share goals in global market. Therefore, external competitiveness is easy to measure. It is built on quantitative data, so called hard data. According to Balassa (in Kačirkova, 2017), a country is becoming more competitive if, due to the cost factor, its ability to sell goods in global markets improves.
8
Limitations of this approach stems from the fact that big economies are usually rather closed economies as their domestic market has the capacity to absorb a lot from its supply. This is the reason why most of the today´s institutions prefer more complex indicators to simple ones.
Aggregate competitiveness
The second approach is defined as the ability to succeed in the domestic and global market while maintaining healthy macroeconomic environment. This current is called aggregate competitiveness. This approach emphasizes importance of productivity and its sustainable growth since it is critical for achieving positive results in indicators, such as: GDP, living standard, employment, etc.
Aggregate competitiveness is built on productivity and on the ability of a country to generate goods of great value (while using minimum inputs) and from the ability to sell these products in domestic and international markets. This income should ensure sustainable and ever-increasing living standard of country´s population.
This approach used to be applied by the EU. According to the then-definition, competitiveness is ability of a country to produce goods and services that will succeed in international markets while maintaining high and sustainable living standard (Kačírkova, 2017). Porter (1985) in this context stated that countries must build competitiveness. He rejected the assumption of classic economists that competitiveness is derived from availability of country´s natural resources, human capital and interest rate. He rejected the external competitiveness approach. He argued that only a country that can provide its population with high incomes and high living standard can be called “productive”. Porter (ibid) stated that export itself is not a goal. Countries should be focused on achieving productivity. It is not relevant whether the productivity is achieved by domestic or international companies as well
as it is not relevant whether their production is sold in internal or global market. Porter (1985) rejected even the aggregate competitiveness while saying: “some
9
authors see competitiveness as macroeconomic phenomena. According to this approach, competitiveness should be derived from exchange rates, interest rates or government´s deficits. In spite of the fact, there are countries such as Japan, Italy, South Korea where living standard is growing in spite of massive growth of budget
deficits.” He concluded that competitiveness should not be derived from
macroeconomic indicators since there are many exemptions that deny this assumption.
American economist Krugman (in Beneš, 2006) defined competitiveness as a combination of economic performance and “something more”. The “something more”, according to Krugman, should be measured and expressed strictly by economic factors and determinants. This seems to be the biggest limitation of this approach.
Nowadays, so called “soft factors” are becoming more and more important. Often, they are considered subjective and not easy to measure. However, the current practice is built on combination of soft factors with hard data. This leads us to the third approach, so called multi-criteria approach.
Multi-criteria approach
Aggregate competitiveness approach has been overcome and expanded by S.Garelli, the author of multi-criteria competitiveness approach (Kačírkova,2017). To evaluate competitiveness, not only qualitative data are implied but also qualitative indicators and data. Multi-criteria approach is also called “benchmarking”. One of the most significant institution that deals with national competitiveness, International Institute for Management Development, includes soft factors into the national competitiveness evaluation. “competitiveness cannot be reduced to productivity or profit. Everybody knows that country that do not participate on allocation of wealth produced by the country, country that does not
10
ensure its citizens health care and education, country cannot ensure political and social stability cannot prosper in a long horizon.”
Porter (1985) stated that competitiveness is closely related with productivity and argued that the main factor of competitiveness is innovation. Later, he realized that due to different economic development in countries, innovation is not critical for every country. According to Porter, there are 4 stages:
- Competitiveness built on productive factors (factors driven economy) - Competitiveness driven by investments (effectivity driven economy) - Competitiveness driven by innovations (innovation driven economy)
- Competitiveness driven by increasing quality of life. (life quality driven economy)
These phases of competitiveness correspond with economic development of countries and determine their political and economic decisions. The first stage is characteristic by low price of productive factors. Low cost of inputs is the comparative advantage.
In the second stage, countries increase their competitiveness by high/higher ratio of companies and their production in global market. Population´s income increases the living standard. States invest into production, infrastructure, technologies, etc. Countries/companies lose their advantage of low price, they need to start competing by quality of their goods and services therefore, we can call them effectivity driven economies
In the 3rd stage, companies compete by innovations. To keep pace with
developments in the market, and to maintain their position in the market, companies must deploy innovation. Schumpeter (in Kačirkova, 2017) argued that companies and their innovations ensure the long-term growth of countries and their higher competitiveness in international market.
In the 4th stage, countries are on the level of economic development, they enjoy the
same quality of economic development, they enjoy the same quality and quantity of productive factors, their economies are on their peak, they innovate, etc. Yet, there
11
are countries that are more competitive than others. Porter (1985) called these factors, that made some countries more successful, “quality of life”. He argues that it is not enough for a country to be productive it must also increase “quality of life” of its citizen.
Some other authors, for example Reich (2002) believes that economic success of countries can not be measured by companies´ profitability, but also according to living standard of their citizens and its increasing tendencies. In this context, Reich warns, that living standard is more than just materialistic comfort. It covers categories, such as: fresh air, clean water, personal safety, beautiful nature, etc. that is also highly valued by most people. The author defines “country attractiveness” as the ability to generate national income and to attract productive factors (but also covers areas such as taxation, labor market, political situation or geographical location).
Beneš (2006) defines 2 markets. Market of goods and services where countries trade with these products and where they enjoy competitive advantage. Specialization makes productivity grow therefore, countries almost do not compete against each other. The second market is a market of productive factors where countries compete in large scale. Move of capital (either financial or human) is determined by qualification, size of domestic market, quality of distribution network, quality of subcontractors, institutions, etc. He concludes that multi-criteria approach employs both quantitative (economic or so called hard data) and qualitative (soft data).
Even though this approach seems to be right, there are still many critics. Many of them believe that competitiveness should be measured by microeconomic indicators as qualitative data are often subjective and not so precise. One of these critics is also an American economist Krugman. He agues that the basic precondition for increasing national competitiveness is microeconomic level, in other words competitiveness of private sector. Some other authors, such as Garelli (2006) do not agree with criticism of multi-criteria approach and say that some authors claims that companies are the ones that should compete in the market, not states. There is no doubt that competitive companies are the main engine of national competitiveness. However, in the last 20
12
years, economic responsibility of governments rose to such a level where it is not possible to ignore the impact that governments have on domestic economics.
Systemic Approach
This leads us to the newest approach, called Systemic approach to competitiveness. It is very similar to the Multi-criteria approach. This one is built on combination of qualitative and quantitative data and claims that the number of factors is not ultimate and is ever-changing. Unlike multi-criteria approach, this thought current follows not only the factors themselves, but also their position and relation among these factors.
Representant of this approach Timo J. Hamalaine (2003) argues that despite dozens of books and papers on competitiveness, each of them offers different approach to competitiveness – depending on which level the analysis is focused (product, company, industry, cluster, nation). Definitions vary and recommendations for improvements also vary along with the research objectives.
Hamalaine stated that theoretical approaches to competitiveness have one common limitation. They are purely focused on availability and accumulation of productive factors as the main determinant of economic growth; without taking into consideration effectivity of organisation of these productive factors. All these theories work with the assumption of “invisible hand of the market” that makes markets always effective and they do not recognize ineffectiveness of the market and its failures. Due to the invalid assumption of effective markets, current theories do not pay enough attention to the importance of organisation of the system to economic performance and overall competitiveness of a country.
Hamalaine talks about systemic framework of competitiveness that he calls “systemic competitiveness”. He argues that competitiveness must be achieve on all levels – it means on product level, on company level, on cluster level, on national level, and at the same time, these levels must cooperate to make sure that competitiveness can reach its potential maximum. According to Hamalaine, organization and systemic
13
effectivity is along with productive factors and technology the key factor to achieve good economic performance of a country and eventually national competitiveness.
This approach is cherished also by the World Economic Forum (WEF) in its report form 2014-2015 “increasing of productivity and competitiveness is critical for
maintenance of economic growth and strengthening prosperity of a country.” The
main actor is a state/government. WEF report stresses the need of cooperation between government and economic subjects. The increase of productivity and competitiveness, it is necessary for all parties to be committed to generate and allocate sources and provide effort that can lead to reforms and investments. WEF warns that public bodies and private subjects are not always coordinated well and the synergy effect is missed and the common effort is not maximalized.
As was mentioned above, a nation is an important actor whose activities have significant impact on country´s competitiveness. To conclude statements of this chapter, productivity remains to be the main factor, together with the ability to sell goods in the international markets and gaining wealth there that is later allocated in the country to increase quality of life and country´s attractivity. As the attractiveness of a country/quality of life and setting of the system as a whole are the determinants that decide whether the productive factors stay in the country or not. It is the “system settings” (and its elements) that is crucial for country´s attractiveness. Then, it can be perceived as a competitive advantage.
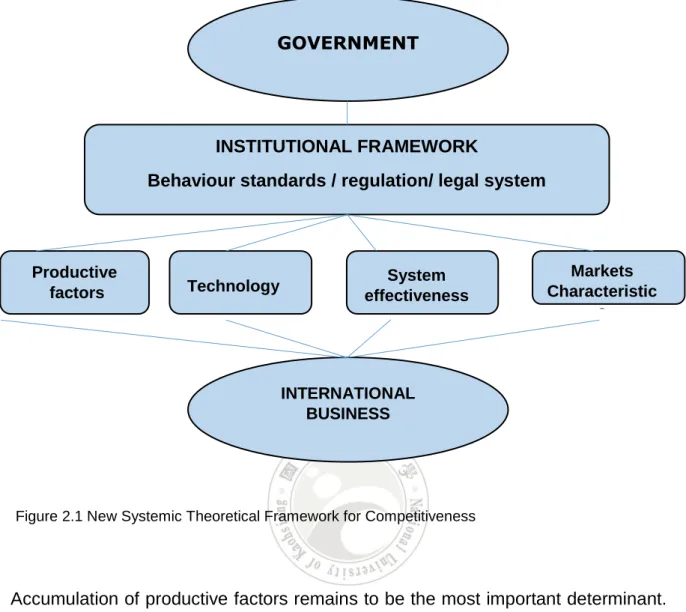
Hamalainen (2003) created a new systemic and dynamic theoretical framework for competitiveness analysis and economic growth that would comply with the current state of modern global economy. The following scheme introduces the most important factors of economic growth and country´s competitiveness:
1. Productive factors 2. Technology
3. Organization / Systemic effectivity 4. Characteristics of markets of goods 5. External commerce activities
14
Figure 2.1 New Systemic Theoretical Framework for Competitiveness
Accumulation of productive factors remains to be the most important determinant. Also, the impact of technology and characteristic of the market is well-known. The new element is the “system effectivity”. If we leave the “invisible hand of the Market” behind, we will see that governments, private sector, profitable and non-profitable sector are the actors that control great part of economic activities. Therefore, system, organisation and settings of the economic system will become great determinants of economic growth and competitiveness of a country.
GOVERNMENT
INSTITUTIONAL FRAMEWORK
Behaviour standards / regulation/ legal system
Technology System effectiveness Markets Characteristic s INTERNATIONAL BUSINESS Productive factors
15
2.2 SWOT Analysis
2.2.1 Historical background
The SWOT analysis has its origin in strategic planning and strategic management. It emerged in the literature in the 1960´s. According to Gürel, the origin of SWOT analysis is unknown. Literature review on the analysis reveals that some scholars credit it to the Harvard Business School meanwhile others attribute the emergence of the analysis to the Stanford University (Gürel, 2017).
There is a paper prepared by a scholar Albert S. Humphrey, who is often considered to be an author of SWOT analysis. Humphrey worked in the Stanford Research Institute (SRI). A research was conducted by a team and SWOT analysis came from the research. However, literature review shows that there aren´t any academic references supporting Humphrey´s claim. Therefore, the SWOT analysis emerging is usually associated with the work of Philip Selznik, Alfred DuPont Chandler, Kennet Andrews, Harry Igor Ansoff and classroom discussions on business policy at Harvard Business School in the 1960´s (Gürel, 2017).
2.2.2 Analysis What is SWOT
SWOT analysis is considered to be part of the strategic management. It consists of external and internal analysis (Gürel, 2017). By conducting external analysis, an institution identifies the critical threats and opportunities in its environment. The internal analysis helps to identify its organizational strengths and weaknesses.
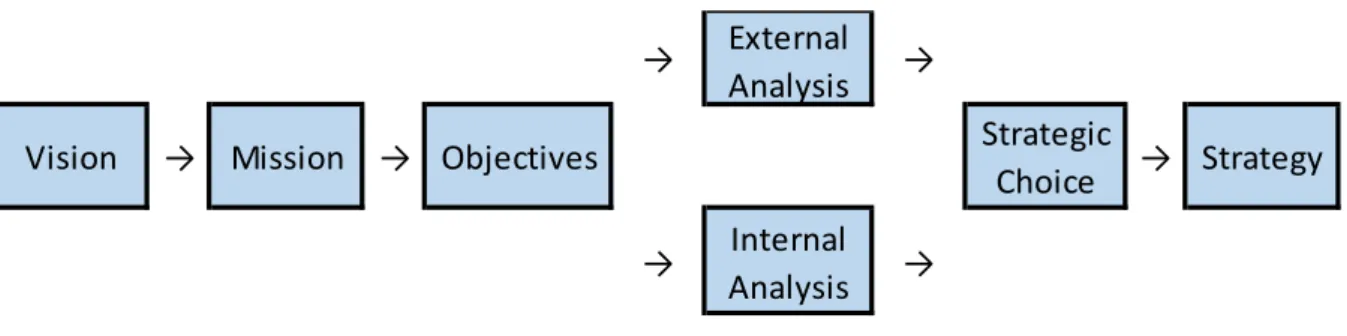
From the strategic management´s point of view, every entity is willing to make strategic choices. It must consider its vision, mission, objectives and external and internal analysis of its organization. The next step of strategic management is implementation of strategy. Strategy implementation occurs when an organization adopts the policies
16
and practices that are consistent with its strategy. And the final step is to obtain competitive advantage.
Figure 2.2 Strategic Management Process
SWOT analysis is a tool for strategic planning. According to the System Approach, organizations are wholes that are in interaction with their environments and consists of various sub-systems. In this sense, an organization exists in two environments, internal (within the organization) and external (the outside environment). Both needs to be analysed to create strategic management practices.
Figure 2.3 SWOT Analysis
The acronym SWOT stands for “strengths”, “weakness”, “opportunities” and “threats”. The SWOT analysis is a process that involves four areas split into two dimensions. Strengths and weaknesses are internal factors and attributes of the organization, opportunities and threats are external factors and attributes of the environment. SWOT analysis is typically drawn out in a four-quadrant box that allows for a summary that is
→ External Analysis →
Vision → Mission → Objectives Strategic
Choice → Strategy → Internal
Analysis →
SWOT Analysis
↓ ↓
Internal Factors External Factors
Strengths Opportunities
17
organized according to the four section titles. The following table is a SWOT analysis, with its four elements in a 2x2 matrix (Samut-Bonnici, 2015).
Figure 2.4 SWOT Analysis Scheme
Strengths and opportunities are helpful to achieve the organization´s objectives. They are favourable for organizations. Naturally, weaknesses and threats are harmful for achieving the organizational objectives. Manager´s role is to try to “fit” the analysis of externalities and internalities to balance the organization´s strengths and weaknesses in the light of environmental opportunities and threats.
Strength is the characteristic that adds value to something and makes it more special than others. Strength at organizational level involves properties and abilities by which an organization gains an advantage over other organizations. Being strong and having strengths are quite important for an organization. Otherwise, the opportunities created by the outside environment can not be used. Moreover, the organization has to answer to the threats of the outside world by using its strengths.
Helpful Harmful to achieve organization´s objectives to achive organization´s objectives In te rn a l En v iro n m e n t
S
trengthsW
eaknesses Ex te rn a l En v iro n m e n tO
pportunitiesT
hreats18
Weaknesses refers to not having the form and competency necessary for something. Weakness means that something is more disadvantageous when compared to something else. It means that the aspects or activities in which an organization is less effective and efficient compared to its competitors. In this regard, weakness is a characteristic that is negative and unfavourable.
Opportunities mean situations or conditions suitable for an activity. Opportunity is an advantage and the driving force for an activity to take place. In fact, opportunities are conditions in the external environment that allow an organization to take advantage of organizational strengths, overcome organization´s weaknesses or neutralize environmental threats (Harrison and St. John, 2004)
Threat is a situation or condition that jeopardizes the actualization of an activity. Threat is the element that makes it difficult or impossible to reach the organization´ s goal. Threats are the situations that come out as a result of the changes in the distant or the immediate environment that would prevent the organization from maintaining its existence or lose its superiority in competition. (Gurel, 2017)
Understanding the strengths, weaknesses, opportunities, and threats and drawing conclusions about 1. How the organization´s strategy can be matched to both its resource capabilities and its market opportunities, and 2. How urgent it is for the organization to correct which particular resource weaknesses and guard against which particular external threats.
2.2.3 Advantages of SWOT ANALYSIS
SWOT Analysis is a very popular method used by organizations for strategic management and marketing. It is an analysis that provides a general perspective and presents general solutions. Details and specific issues are not the focus of SWOT analysis. It is a road map the guides the entity from the general to the specific. The
19
second great advantage of SWOT analysis is the fact that it is an interactional analysis technique that makes macro evaluations possible. As an analysis tool, SWOT provides the opportunity to focus on positive and negative aspects of internal and external environment of the organization. It can help managers to uncover opportunities to take advantage. By understanding weaknesses, threats can be managed and eliminated. SWOT analysis can be applied at different analytical levels – individual level, organizational level, national level, international level, etc.
2.2.4 Limitations of SWOT analysis
SWOT analysis is one of the most widely used techniques of the long-term planning. However, it has its limitations. One of them is the fact that it cannot go beyond its definition – it mainly describes the current situation. Another limitation is, according to Weihrich (Weihrich, 1982), the illogical set-up. The only logical starting point for the analysis is with opportunities and threats. They are outside the organization, beyond control, and must be managed by organization´s strengths and weaknesses. Another weakness is that the analysist has a general perspective and therefore, presents only general solutions.
Gurel warns that categorization of variables into one of the four SWOT quadrants is challenging. The same factor can be fitted in two categories. A factor can be a strength and a weakness at the same time. Strengths that are not maintained may become weakness. Opportunities left behind and later on adopted by competitors may become threats. Also, criteria to assign a variable to one of the four quadrants may be more difficult to clarify if the methodology is not used for a company but for a country. He concludes that the SWOT analysis has much to offer but should be seen only as situation analysis and starting point for a more comprehensive objectives. (Gurel, 2017).
20
Chapter Three: METHODOLOGY
This thesis deals with evaluation of competitiveness of the Czech Republic. Data from various sources have been used, such as: statistical databases, research papers, EU reports, government reports, thesis, dissertations, books and up-to-date articles and commentary on internet websites to answer the research question: What is the current state of the Czech Republic´s competitiveness? What are the steps that the Czech government should take to move the country among the top 20 most competitive economies in the world?
To find solution for improving position of the country, qualitative data collection method has been applied. The approach is based on gathering historical data, current data, analysis and other kinds of secondary data. The gathered information is used for describing the situation and compare and analyse the data to gain the required in-sight on the chosen topic. Therefore, we talk about the case study methodology approach. A case study is a detailed study of a specific subject and is commonly used in social and business research.
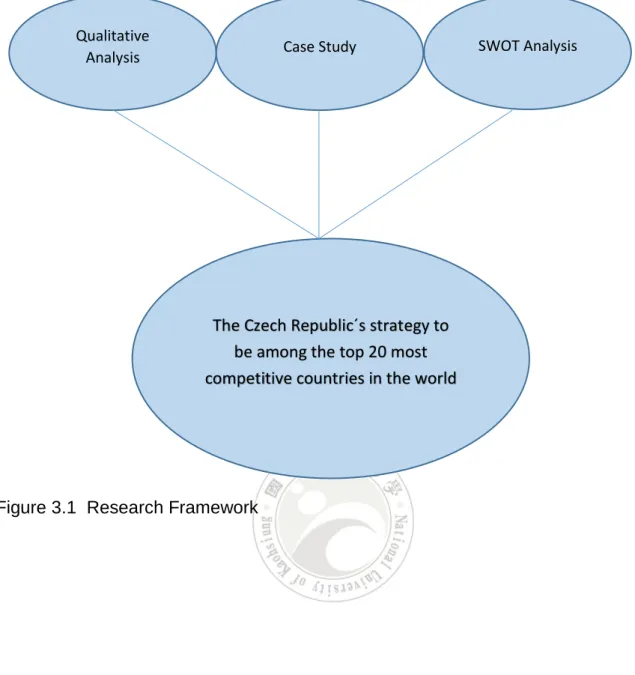
In the first chapter, the topic of this work is introduced and also, the objective of this work is specified. The second chapter deals with literature review. Theoretical framework of competitiveness is described. The focus is on different approaches to competitiveness and even development of these approaches over the course of time. SWOT analysis is also described here and will be used as a strategic planning technique for identifying strengths, weaknesses, opportunities, threats. The third chapter deals with methodology. This chapter overviews the systematic approach and method that has been applied in this work. The chapter four represents the very core of this work and discusses in details the competitiveness of the Czech Republic. Chapter five summarizes the major findings and concludes the recommendations the country should do achieve its objective. Also, this chapter suggest the areas for future study.
21 Ě+
Figure 3.1 Research Framework Qualitative
Analysis Case Study SWOT Analysis
The Czech Republic´s strategy to be among the top 20 most competitive countries in the world
22
Chapter Four: MAJOR FINDINGS
4.1 Historical Excursus
Czechoslovakia was a sovereign state in Central Europe that was established in 1918 when it declared its independence on the Austro-Hungarian Empire. From 1939 to 1945, the state was de facto non-existing as Nazi Germany claimed great part of Czechia as Germany´s territory and the rest of the Czechia was later fully occupied by the Nazis. Slovakia declared independence in 1939.
In 1945, the Czechoslovakia was re-established. A one year later, the Communist party of Czechoslovakia won parliamentary elections and in 1948, seized full control in a coup and assumed undisputed control over the government of Czechoslovakia.
In the next 41 years, the country was part of the Soviet Bloc. The state was ruled by Communist party, the economy was centrally-planned and private ownership was very limited or even non-existing. The system collapsed in 1989.
The Czech Republic and the Slovak Republic, both were established on January 1st
1993 when the country underwent a “velvet divorce” into its two national components, Czechia and Slovakia.
The Czech Republic is located at the very centre of Europe and has been benefitting from its geographic position since ever. The territory is a crossroad between Western and Eastern Europe therefore, vivid goods exchange and merchandize have been always present. The country is bordered by Germany, Austria, Slovakia and Poland, so it may not be surprising that these countries are (along with China) the biggest trading partners of Czechia.
The country is a parliamentary representative democracy. The head of the state is the President. His function is mainly representative. Prime Minister is the leader of government and holds considerable powers. The population is estimated to 10,6
23
million inhabitants. In 1999, the country became a member of NATO and in 2004, after a long pre-accession period, the Czech Republic joined the EU.
4.2 EU competitiveness framework
The Czech Republic started to seriously deal with national competitiveness during the pre-accession period to the EU. At this time, it was clear that the Czech Republic would join the European single market and would lose its ability to protect the domestic market from foreign competition. In 2004,the Phillips and Wheat´s report on readiness to join the EU said: “The most damaging from the hidden costs is the issue of assisting Czech SMEs to remain competitive in Czech markets. Many of these firms still have out-of-date technologies and currently compete only inside the CR. When the CR joins the EU, new firms from EU countries will enter the Czech market with higher quality products and in many cases with lower prices. Czech companies operate at a very low
level of economies of scale and have higher production costs.” (Philips, Wheat; 2004).
The Czech Republic, as a member state of the EU, follows guidelines and strategies adopted by the European Union. In the next two subchapters, we will have a closer look to the two main strategies that significantly shaped Czech national competitiveness policy in the last two decades.
4.2.1 Lisbon Strategy
In March 2000, the European Council adopted the Lisbon strategy. Its aim was to make the EU “the most competitive and dynamic knowledge-based economy in the world capable of sustainable economic growth with more and better jobs and greater social cohesion. (Lisbon European Council, 2000) This goal should have been achieved till 2010.
24
During the 90´s and 00´s, the EU achieved a great progress in integration, such as: the single market was formed, economic and monetary union established and consequently EURO was introduced, the new single currency. However, the Union also had to face many challenges. Therefore, the Lisbon strategy was the first coherent document that would summarize all the then-challenges and weaknesses of the EU and set a road-map for EU´s future development1. In the long-term horizon,
the strategy was meant to increase competitiveness and strengthen its position while facing the competition from the USA and Japan. It was a reaction to the long-term weakness in economic performance and competitiveness of the EU member states. 4 main areas were identified:
- Labour market and labour productivity - Research and Development
- Single market and entrepreneurship obstacles - Social model
4.2.1.1 Four main areas causing weak economic performance in the EU
Labour market and Labour productivity
At the end of 90´s, there were over 15 million people without a job. The labour market was characterized by low level of employment, great imbalance between regional unemployment and unemployment of women and elderly people to the total amount of the unemployed. Unlike dynamic market in the USA, the European model was (and still is) much more focused on employee protection. Therefore, it is relatively rigid compared to the labour market in the USA and less capable to generate new jobs.
1 However, it would be fair to mention that there were other policy programs in place even before the Lisbon
strategy. One of them was the Cardiff process (1998, structural reform program on improving functioning of goods, service and capital market), Lucemburg process (1997-2004, employment policy),Cologne process (1999, macroeconomic dialogue with economic and social partners), Pact of Stability and Growth (stabilization and convergence program)
25 Research and Development
Research and development was identified as another source of EU´s weak economic performance. In 2000, the EU invested only 1,7 % of its GDP into RD ,the USA put 2,6 % GDP into this field, Japan 2,9 % .
Also, there is the difference between Europe vs. the USA and Japan on the other side, in the ratio of industrial workers to researchers. In EU, there are only 2,5 researchers to every 1.000 industrial workers. Unlike in the USA, where the ratio is much higher – 6,7 research workers, or in Japan, 6 scientists. Also, the engagement of private sector in R&D is much higher in the EU than in the USA and Japan. (Šamlotová, 2018, p. 26).
Common Market and Obstacles
The Common market was accomplished in 1992, but it still has suffered from many imperfections. Mostly, they were related to the free movement of goods, services, capital and persons. There were also many legal and bureaucratic requirements that made it difficult to start a business. To open a new business in the EU, one needs 11 weeks and approximately 1.600 EUR to complete the process. In the USA, however, only 1,5 weeks and 500 EURO is needed. (Šabatova, 2018, p. 27)
Social Model
There has been and will be a great pressure on social, health and pension systems in the EU; taken into consideration the socially excluded groups or unfavourable demographic development. Especially, the sustainability of pension systems were discussed largely.
These weaknesses made the EU even more vulnerable while facing the low-cost economies emerging in the global market. Therefore, there were many voices calling for “qualitative” move or “radical transformation” of the EU´s economy on behalf of
26
maintenance and strengthening EU´s competitiveness. These calls for transformation were answered by the goal of moving the EU towards “knowledge-based economy” and to building knowledge societies. To increase economic performance and productivity, stress will be put on quick access to information via information and communication technologies, support of R&D, ICT investments, etc. By adopting the Lisbon strategy, the EU embraced these priorities and declared its goal to build a “knowledge-based economy”.
4.2.1.1 The main pillars of the Lisbon Strategy
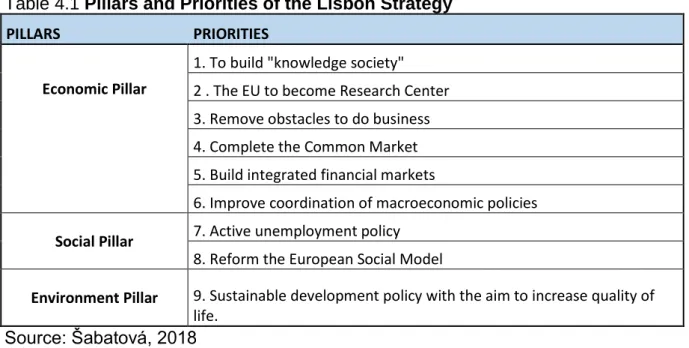
The content of the Lisbon strategy went through certain development. At the very beginning, there were only 2 pillars: economic and social pillars. The stress were put on quick adaptation to knowledge-society and investing into R&D; in the social pillar, the main goal was to modernize the social models. The member states were expected to invest into education and to carry out the active employment policy. In 2001, Goteburg summit adopted the EU sustainable development policy and consequently, environmental pillar was added to the Lisbon strategy. Nine priorities were derived from the 3 pillars.
27
Table 4.1 Pillars and Priorities of the Lisbon Strategy PILLARS PRIORITIES
Economic Pillar
1. To build "knowledge society" 2 . The EU to become Research Center 3. Remove obstacles to do business 4. Complete the Common Market 5. Build integrated financial markets
6. Improve coordination of macroeconomic policies Social Pillar 7. Active unemployment policy
8. Reform the European Social Model
Environment Pillar 9. Sustainable development policy with the aim to increase quality of life.
Source: Šabatová, 2018
Implementation and coordination tools
The New Open Method of Cooperation was introduced as an official tool for “soft” policy coordination and implementation. The method is focused on “middle level” where the key political areas remain on the national level, but they are cognized as projects of common interest (European Commission, 2018). It is built on “soft law” and “moral pressure” rather than legally binding commitments.
However, the then-chairman of the European Commission, Romano Prodi, said in January 2004, the progress had been still very limited and there were no quarantees that the goals would be met. He added that the investments into R&D were not sufficient, education reforms slow and progress in one country is reduced by slowdown of other country. The research conducted by European Commission uncovered that 40 % of directives related to Lisbon strategy remained unimplemented. Therefore, in 2004 a group was set to suggest a revision of the Lisbon strategy. The outcome of this revision is called the Kok´s report. (Šamlotová, 2018)
28 Kok´s report
The report pointed at too many goals as the main reason of the strategy failure. Also, lack of responsibility from the member states and European Commission to implement the strategy was seen as the major issue. The report evaluates positively the progress in fighting unemployment (from 62 % population employed in 1999 to 64,3 in 2003), but also stated that the goal of 70 % employment in 2010 would not be reached. Positive was also the fact, that 93 % of school had internet connection and the situation was similar with households, state administration and companies. However, ony very limited progress was achieved in increasing investments in R&D. The main reasons behind the limited success of the Lisbon Strategy:
- Too optimistic growth expectations
- Too much expectations form information and communication technology - The chosen tool (New Open Method of Cooperation) did not seem to work well - Contradictory goals
- Limited awareness about the existence of the Lisbon strategy from the general public.
Suggested Recommendations and changes
Even though the report concluded that the strategy was not successful and would fail to meet its goals, it did not see any reasons why to give up upon the set objectives. In 2005, European Commission launched the revised Lisbon strategy. Unlike the original version, this one had only 2 goals: 1. Reach 70 % employment rate till 2010 and 2. Invest 3 % GDP into R&D. The stress was put on the economic pillar. The social and environment pillars remained in place, but were seen as a long-term objectives. (Šamlatova, 2018)
The most important recommendation was to get the members states more involved into the entire process. All governments should accept National Action Programs for Lisbon Strategy implementation. Newly, every member state had to adopt a National Reform Program. It was a politically binding document that summarized measures that the respective country should take in macroeconomic, microeconomic field and
29
employment policy to stimulate economic growth between 2005 – 2008. National programs are meant to adjust the Lisbon strategy goals to the specifics of every country. Therefore, every country appointed its “National Lisbon Coordinator”. The achieved progress was monitored annually in so called “Implementation Reports”. Objectives and measures that were meant to be carried out on European level, was described in the document called Community Lisbon Program. It contained three main goals that to great extent overlapped the Lisbon strategy priority areas:
- Encourage knowledge and innovation
- Make EU an attractive destination for investments and work - Create more and better job opportunities
The new structure of the Lisbon strategy was built on Action Programs on national levels (National Reform Programs) and action program on community level (Community Lisbon program).
4.2.1 Europe 2020 Strategy
Europe 2020 is a new economic strategy and the main reform programme 2010 - 2020. It replaces the Lisbon strategy that expired in 2010. Subtitle of the Europe 2020 strategy is to boost economic growth that is built on knowledge-based economy, is sustainable and encourages social cohesion. (Vlada, 2019). These areas are also the core priorities of this strategy.
All goals are inter-connected and are meant to strengthen each other. Intelligent growth should be ensured via developing knowledge and innovation economies. Investments into knowledge and innovation are considered a precondition for creation of new jobs opportunities. Sustainable growth is focused on supporting more ecological and competitive economies. Inclusive growth should be reached by economic, social and regional cohesion, for which it is necessary to ensure high employment of EU citizens. (Šamlotova, 2018)
30
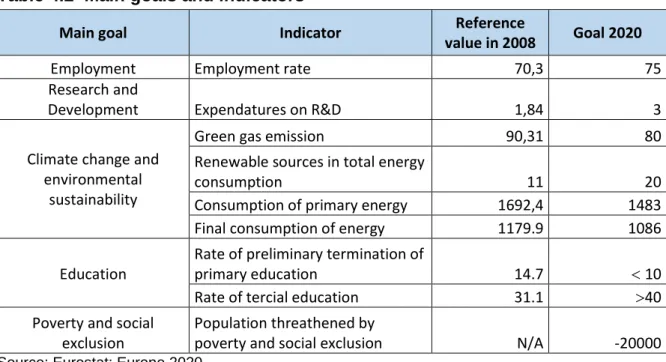
Table 4.2 Main goals and indicators
Source: Eurostat: Europe 2020
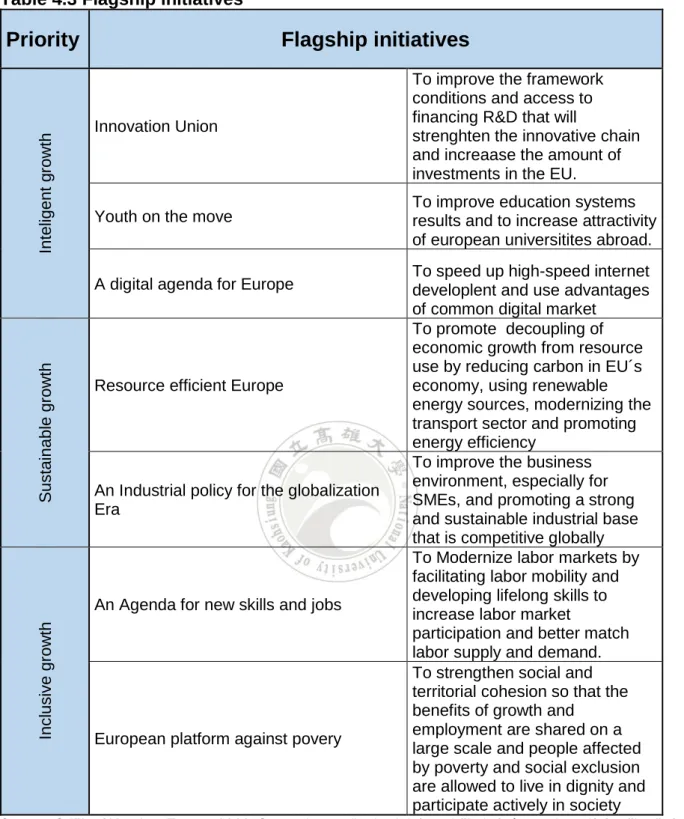
The main goals reflect the 3 priorities of Europe 2020 and they are critical for achieving success, but as European Commission expressed in its statement – this list of goals is not exhausting. EC suggested 7 Flagship initiatives that are binding for both the EU and member states. Their implementation is a common priority and should be a base for implementation of the main goals. Progress is expected to be seen in each and every one of the flagship initiatives as they are defined wider than the main goals. (European Commission, 2010)
Main goal Indicator Reference
value in 2008 Goal 2020
Employment Employment rate 70,3 75
Research and
Development Expendatures on R&D 1,84 3
Climate change and environmental
sustainability
Green gas emission 90,31 80
Renewable sources in total energy
consumption 11 20
Consumption of primary energy 1692,4 1483 Final consumption of energy 1179.9 1086 Education
Rate of preliminary termination of
primary education 14.7 10
Rate of tercial education 31.1 40 Poverty and social
exclusion
Population threathened by
31
Table 4.3 Flagship initiatives
Source: Sdělení Komise: Evropa 2020. Strategie pro dlouhodobý a udržitelný růst podporující začlenění
Priority
Flagship initiatives
Intel ige nt g row th Innovation Union
To improve the framework conditions and access to financing R&D that will
strenghten the innovative chain and increaase the amount of investments in the EU.
Youth on the move To improve education systems results and to increase attractivity of european universitites abroad. A digital agenda for Europe To speed up high-speed internet developlent and use advantages
of common digital market
S ustai na bl e gr ow th
Resource efficient Europe
To promote decoupling of economic growth from resource use by reducing carbon in EU´s economy, using renewable energy sources, modernizing the transport sector and promoting energy efficiency
An Industrial policy for the globalization Era
To improve the business environment, especially for SMEs, and promoting a strong and sustainable industrial base that is competitive globally
Incl
usi
ve gr
ow
th
An Agenda for new skills and jobs
To Modernize labor markets by facilitating labor mobility and developing lifelong skills to increase labor market
participation and better match labor supply and demand.
European platform against povery
To strengthen social and territorial cohesion so that the benefits of growth and
employment are shared on a large scale and people affected by poverty and social exclusion are allowed to live in dignity and participate actively in society
32 European Semester
The implementation architecture consists of 2 pillars:
1. Thematic Approach: combines priorities, main goals and integrated main direction. This approach is more on “Union” level and shows interdependence of member states.
2. Country Report: focused on national level, is made within European semester that was introduced in 2010 and became a regular practice in 2011.
It´s a cycle of coordinated economic and fiscal policies that should also ensure active participation of member states. Specifically, it concerns 3 areas:
- Structural reforms – will the focus on growth and employment as given by the Europe 2020
- Fiscal Policy – to ensure sustainability of public finance - Prevent excessive macroeconomic instability
European semester synchronizes schedules of Europe 2020 strategy and Pact of Stability and Growth. European semester has a strictly given schedule. First, member states receive guidelines, then they submit their National reforms programs and “stability” programs. After these programs are processed by the European Commission, the member states receive “Country Recommendation”. Countries are expected to follow the recommendations and national budget should reflect them.
European semester starts in autumn when the European Commission publish its annual Growth analysis where it introduces its opinion on politico-economical priorities for the upcoming year. Member states are invited to include these priorities into their policy-making. In January and February, Council discuss the Annual Analysis of Growth. It is a very complex process as the European semester has impact on many policies. Therefore, Council discuss the issue in its multiple formation. (Šamlotova, 2018). In March, European Commission publishes its “country reports” and the European Council presents political directions that are derived from the Annual
33
Analysis of Growth. These directions are always related to fiscal policy, structural reforms and measures to encourage growth.
On the national level, member states prepare and submit 2 documents to the European Commission in April – one of them is Stability Program (Pact of Stability and Growth) and the other one is National Reform Program (Europe 2020). In these programs, member states describe their plans and structural reforms related to economic growth and employment. These documents are reviewed by European Commission and consequently, it issues the “Country specific recommendations”. European Council approves them and invites all member states to implement them. (Europe 2020. The European Union Strategy for Growth and Employment, 2017)
4.3 Czech competitiveness framework
4.3.1. Lisbon strategy
As it was already mentioned above, the Czech Republic joined the European Union in 2004. At that time, the LS had been in place for 4 years. The Country, as well as many other EU members, was quite indifferent towards the strategy. As O. Pešek from the Office of the Government points out, measures and efforts to manage our economic policy according to the LS were often random, unregulated and not based on the overall conceptual reform framework in the Czech Republic. As some measures were contradictory, the results were not so satisfactory as they could have been. That is why the Czech Republic, together with the approaching EU accession, has begun to align the Lisbon-based measures with the national economic strategy.(Panelova diskuse: Lisabonska strategie a Česka Republika, 2004)
Like other countries, the Czech Republic publicly endorsed the goals of the Lisbon Strategy in Brussels, a consensus on the need for the aforementioned reforms across the political spectrum. The situation was worse in domestic environment, where expensive reforms were to be implemented. Given their non-binding nature, the low
34
impact of the European institutions on their implementation and the retention of all power in the hands of the Member States, the Lisbon Strategy was not in real terms, implemented in the Czech Republic. The Czech Republic's behavior towards the Lisbon Strategy was not exceptional, in addition to the fact that all actors of domestic political events, individual interest groups and citizens had to get used to the EU as a whole. There was little room for addressing the Lisbon Strategy in 2004.
Overall, the LS was seen as an opportunity to pursue reforms in the Czech Republic. The economic issues were communicated much more than the social and environmental pillar. This also implied to the Czech Republic's position towards Europe 2020: first, it is necessary to achieve economic and social goals, consequently environmental standard should be pursued. Well-functioning internal market is seen as essential to achieving the Lisbon objectives.
As far as institutions are concerned, the main garant of monitoring, coordination and implementation of the Lisbon Strategy was the Government of the Czech Republic. The government delegates and coordinates different areas of the strategy.
4.3.2 Europe 2020
The official position of the Czech Republic towards Europe 2020 strategy was positive. There was a wide consensus across the political spectrum on the benefits it can bring. Unlike the Lisbon strategy, the Europe 2020 is empowered by connection with structural and cohesion funds. By its very nature, it will touch most sectoral policies and will have a wide impact on the economic and social environment. (Vávrová, 2011)
The Strategy highlights the 5 main objectives set for the EU as a whole. All five main objectives were endorsed by the European Council on 17 June 2010. At the same time, the Member States were invited to set out the national objectives based on the aims of the Strategy.
With regard to consultations with the European Commission on the form of national goals of the Czech Republic, on commitments already coming from the European Council Conclusions of March 26, 2010, and taking into account the domestic
35
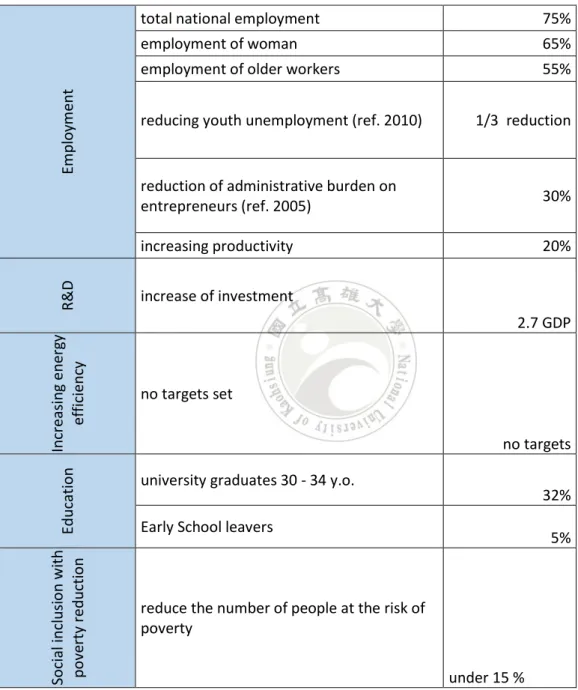
economic, social and political situation and tripartite negotiations, 2010, some quantified national headline targets and the Europe 2020 objectives.
Table 4.4 Europe 2020: Czech national goals
Source: Vlada, 2019 Em p lo ym ent
total national employment 75%
employment of woman 65%
employment of older workers 55%
reducing youth unemployment (ref. 2010) 1/3 reduction
reduction of administrative burden on
entrepreneurs (ref. 2005) 30% increasing productivity 20% R& D increase of investment 2.7 GDP In creasin g e n erg y efficien cy no targets set no targets Edu catio n
university graduates 30 - 34 y.o.
32% Early School leavers
5% So cial incl u si o n w ith p o ve rty re d u cti o n
reduce the number of people at the risk of poverty
36
4.3 Economic profile of the Czech Republic
4.3.1 International trade
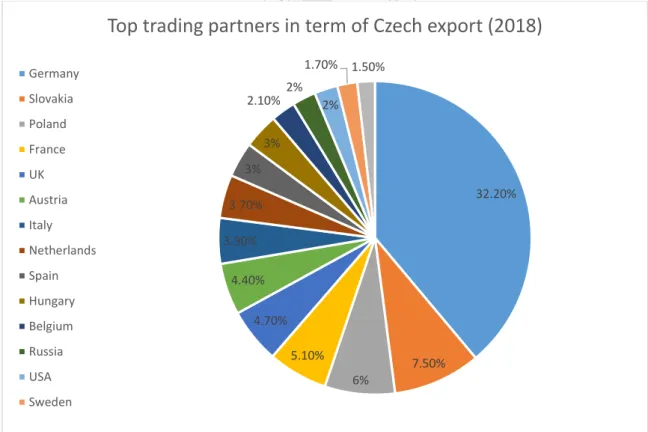
The Czech Republic is a small and very open economy. International trade is, therefore, crucial for healthy economic performance and ever growing living standard of Czech citizens. Czech foreign trade is closely connected with the EU. According to the Unicredit bank Report on Czech International trade,in 2017, 90.2 % of Czech export went to Europe and 83. 7 % of export went to the EU. Import is characterized by similar numbers: 72.1 % of all imports came from Europe, 65.7 % of total imports came from the EU.( Pour, 2018). Below follows the chart of the 15 most significant trading partners in terms of Czech export. The chart shows data from 2018 and it is worth noting that the structure of trading partners has not changed significantly over the last 2 decades.
Figure 4.1 Top 15 export destinations of the Czech Republic
Source: Worldstopexport, 2019 32.20% 7.50% 6% 5.10% 4.70% 4.40% 3.90% 3.70% 3% 3% 2.10% 2% 2% 1.70% 1.50%
Top trading partners in term of Czech export (2018)
Germany Slovakia Poland France UK Austria Italy Netherlands Spain Hungary Belgium Russia USA Sweden
37
Far biggest trading partner of the Czech Republic is Germany. Export to Germany represents more than 32 % of total exports. This figure is given mainly by the car industry. Car production is the most important sector in the Czech industry. Other significant trading partners are Slovakia, Poland, France and the UK.
The following chart shows the share of international trade on Czech GDP. Both volume of trade and positive trade balance have been ever increasing – for example in 2004 total export was equal to 46 % of Czech GDP, in 2017 it was more than 67 %. This increasing trend points to the openness of Czech economy. Authors of the earlier-mentioned report warns that open economy means greater involvement into global supply chain and, therefore, better access to new technologies and faster growing productivity, but on the other hand, the economy is more sensitive to economic shocks. (Ibis, 2018)
Figure 4.2 Share of international trade on Czech GDP
Source: Unicredit Bank Report on International Trade Trade balance
38
Structure of Czech export tend to change only very slowly. In the last 10 years, the structure has been following: 85 % of Czech export consists from 3 main groups: machines and transport vehicles (57 %), market products sorted by used materials (15%) and industrial consumer goods (11%). Czech industry and international trade are closely tied with car industry and related supply chain. The report (Ibis, 2018) says that car industry and related business contribute to the Czech GDP by 13 %. If the automobile industry suddenly disappear, Czech GDP would shrink about 13 % which means it would be back on the 2012 GDP level.
Figure 4.3 Significance of industries in Czech GDP
Sourse: Unicredit Bank Report on International Trade
This chart presents the industries that contribute most to the Czech GDP. Data shows that the main industry is the transport vehicles industry, followed by machinery and electrical devices. It is clear that the Czech industry as a whole is dominated by traditional industries and unfortunately, new/modern industries are clearly underrepresented. 13.30% 5.10% 3.20% 3.80% 5.80% 3.40% 2.00% 1.70% 4.40% 5.90% 2.30%
Significance of industries in Czech GDP (incl.indirect effects)
Transport vehicles
Machinery and equipment
PC and electrical devices
Electronic devices
Metal constructions and metal products
39
4.3.2. Gross Domestic Product (GDP)
In 2005, the Czech government approved its historically first economic strategy, The Strategy for Economic Growth of the Czech Republic 2005-2013. The document´s objective was to navigate the country towards knowledge-based economy with growing living standard and high rates of employment (Mejstřík, 2011). The goal of the strategy was to bring the Czech Republic closer to the economic level of developed European countries while respecting the principles of sustainable growth. Specifically, it aimed to reach the average EU GDP per capita till 2013.
Table 4.5 GDP per capita in PPS, Index (EU28 = 100)
GDP per capita in PPS
Index (EU28 = 100) geo\time 2004 2005 2006 2007 2008 2009 2010 2011 2012 2013 2014 2015 2016 2017 EU (28) 100 100 100 100 100 100 100 100 100 100 100 100 100 100 Czechia 78 79 79 82 84 85 83 83 82 84 86 87 88 89 Slovakia 57 60 63 67 71 71 74 74 76 76 77 77 77 76 Source: EurostatFigure 4.4 GDP per capita in PPS (%)
Source: Eurostat 0 10 20 30 40 50 60 70 80 90 100 2004 2005 2006 2007 2008 2009 2010 2011 2012 2013 2014 2015 2016 2017
GDP per capita in PPS (%)
EU (28) Czechia Slovakia40
The aim to reach average EU GDP per capita was not met. To achieve the required level, the Czech economy must grow faster than the EU´s economy. The graph shows great progress that Slovakia has made since 2004. In 2017, its GDP per capita was about 17 percentage points closer the EU average GDP. The Czech Republic improved its position about 11 percentage points. The starting position of Slovakia was worse compared to the Czechia, but it happened to grow more rapidly in the later years.
Convergence is built on GDP growth. Therefore, it is essential to understand the dynamics with which both economies grew in the last few years. In the following graph, we can see GDP growth rates of Slovakia, Czech Republic and EU. The graph shows that Slovakia grew steeply from 2004 till 2007. In 2009, all three economies experienced massive collapse of their performance. It can be interpreted as the aftermath of the global economic crisis that hit the USA in 2007 – 2008 and spilled over to other parts of the world.
Figure 4.5 GDP growth rate
Source: Eurostat -8.0 -6.0 -4.0 -2.0 0.0 2.0 4.0 6.0 8.0 10.0 12.0 2004 2005 2006 2007 2008 2009 2010 2011 2012 2013 2014 2015 2016 2017 2018