國
立
交
通
大
學
資訊管理研究所
博士論文
改善電子商店經營策略新混合式多評準決策模式之應用
Using a new hybrid MCDM model for improving e-store
business strategies
研 究 生:邱婉瑜
指導教授:曾國雄 講座教授
黎漢林 講座教授
國
立
交
通
大
學
資訊管理研究所
博士論文
改善電子商店經營策略新混合式多評準決策模式之應用
Using a new hybrid MCDM model for improving e-store
business strategies
研 究 生:邱婉瑜
研究指導委員會:陳安斌 教授
李永銘 所長
胡宜中 教授
何天華 博士
指 導 教 授:曾國雄講座教授
黎漢林講座教授
中 華 民 國 101 年 9 月
改善電子商店經營策略新混合式多評準決策模式之應
用
Using a new hybrid MCDM model for improving e-store business
strategies
研 究 生:邱婉瑜 Student: Wan-Yu Chiu
指導教授:曾國雄 Advisors: Gwo-Hshiung Tzeng
黎漢林 Han-Lin Li
國 立 交 通 大 學
資 訊 管 理 研 究 所
博 士 論 文
A Dissertation
Submitted to Institute of Information Management College of Management
National Chiao Tung University in Partial Fulfillment of the Requirements
for the Degree of Doctor of Philosophy in Information Management September 2012 Hsinchu, Taiwan 中 華 民 國 101 年 9 月
改善電子商店經營策略新混合式多評準決策模式之應用
學生:邱婉瑜
指導教授: 曾國雄
黎漢林
國立交通大學資訊管理研究所博士班
摘
要
在這個時代,有很多的消費者會從網路商店購買所需要的產品和
服務。也因為電子商店經營者有權力分配不同的資源,所以他們需要
了解網路商店消費者的購物行為,以提供最好的服務品質與附加價值
,來激勵瀏覽他們網路商店的顧客有購買慾去購買他們的產品。隨著
網路購物服務的日漸普及,網路商店競爭越來越激烈。因此,管理者
應了解客戶的需求並採取相關的因應措施並給予市場行銷策略,以改
善他們的服務品質,並確保顧客的忠誠度。因此,這篇文章的主要目
的是在各準則之間相互關聯性和回饋性問題的情況下,如何評估及改
善電子商店的市場策略,並且應採用何種創新與創造性之策略,以滿
足及提高客戶之滿意度,並減少實際績效值與渴望水準所造成的差距
呢?如何使人們的生活帶來更便捷的服務呢?本論文提出一種新的
混合式多準則決策(MCDM)模式結合DEMATEL方法,並以DANP
加上VIKOR及灰色關聯模式的方法來解決這些問題。
新的混合式VIKOR和灰色關聯模式,在處理解決現實世界中的
構面/準則間具有相互關聯性(Interdependence)及回饋性(Feedback)的
問題。更具體地說,DANP和VIKOR與灰色關聯評估模式相結合,可
產生出具有影響力的網路關係圖(Influential Network Relations Map,
INRM)
,還有影響權重(Influential weights),以及渴望水準(Aspiration
level)與實際績效之間的差距。最後以三個真實的案例作為實證分析
,使用新的混合式多準則決策(hybrid MCDM)模式,是可以提供電子
商店經理者創造出最佳的市場行銷策略。如此,以現有的知識為基礎
去了解並滿足消費者的需求(customers' needs),可減少電子商店與顧
客之間的認知差距,使得電子商店不僅能保有目前的消費者,更能使
他們願意回購,並能提供最有效率及高品質的顧客服務,為他們增加
更多的客戶,創造更高的價值,使得電子商店的經營效果更能接近渴
望水準。
關鍵詞:電子商務、電子商店經營、網路商店、顧客需求、市場策略
、多準則決策、決策制定實驗及評估實驗室、網路分析法、以決策制
定實驗及評估為基礎的網路分析法、VIKOR、灰色關聯分析。
Using a new hybrid MCDM model for improving
e-store business strategies
Student: Wan-Yu Chiu Advisors: Chair Prof. Gwo-Hshiung Tzeng
Chair Prof. Han-Lin Li
Institute of Information Management National Chiao Tung University
Abstract
Many consumers today buy products and services from e-stores. Because e-store
managers are responsible for allocating different resources, it is essential that they
understand consumers’ shopping behaviour to provide the best possible value for visitors to their websites. With the increasing popularity of online shopping services,
e-stores are experiencing ever more fierce competition. Thus, it is imperative that
managers take steps to improve their services and ensure customer loyalty, and this
can only be done by understanding their customers’ needs and developing appropriate marketing strategies. Therefore, the purpose of this article is to focus on assessing and
improving strategies to reduce the gaps in customer satisfaction caused by
interdependence and feedback problems among dimensions and criteria to achieve the
aspiration level and to enhance strategies by adopting innovation and creativity to
satisfying/promoting human life and convenient service. We propose a new hybrid
Multiple Criteria Decision Making (MCDM) model, combining the Decision Making
Trial and Evaluation Laboratory (DEMATEL), DEMATEL-based Analytic Network
Process (DANP), VIšekriterijumsko KOmpromisno Rangiranje (VIKOR) methods,
relational model will address interdependent problems among dimensions/criteria in
the real world and provide feedback. More specifically, a DANP (DEMATEL-based
ANP) and a VIKOR model with a grey relational assessment model will be combined
to produce a influential network relations map (INRM), showing the influential
weights and gaps between the actual performance and the level of aspiration. Then,
three real cases are used to illustrate how the proposed new hybrid Multiple Criteria
Decision-Making (MCDM) model improves e-store business. These results can
provide e-store managers with a knowledge-based understanding of how to create best
marketing strategies that to reduce and to closer aspiration level for e-store managers
to improve their business model in order to meet consumers’ needs, encourage them
to repurchase, and to enable stores to provide the most effective and efficient service
for their customers.
Keywords: Electronic Commerce (EC); E-store business; Internet stores; Customers’
needs; Marketing strategies; Multiple Criteria Decision-Marking (MCDM); Decision
Making Trial and Evaluation Laboratory (DEMATEL); Analytic Network Process
(ANP); DEMATEL-based ANP (DANP); VIšekriterijumsko KOmpromisno
Acknowledgement
時間飛逝,記得剛踏入校園時,興奮到不知所措,如今已經準備畢業, 在今日離別時刻,特別感謝資管所,所有教導過我的老師,培養我分析及 解決問題的能力。 從進入交大就讀開始到學業的完成,最主要要感謝我的指導教授 黎 漢林講座教授與曾國雄講座教授,多年來的悉心照顧與指導,因為老師的 耐心和包容,使我在懵懂中成長茁壯,尤其是老師不厭其煩對我的研究提 出修正指導,使得我得以順利完成博士學位。除了學業之外,老師們的思 維、為人處事及求學問的精神,更是我非常值得學習的地方,在此由衷的 感恩老師們為我做的一切。 在論文提案及學位口試期間,感謝 陳安斌教授、林妙聰教授、李永 銘所長、胡宜中教授、何天華博士對論文所提出的指正與建議,使得本論 文更臻完善。 在這五年的博士班生活中,感謝博一準備資格考時,學姐劉蓉所提供 的考古題,同學秀文、宇軒、邦曄、軒韶的考前大作戰,在家庭、生活與 研究上,感謝學長姐明賢、宇謙、彥曲,以及同學秀文、鴻順的相互分享 及鼓勵,很幸運能與所有周遭人相遇、相知、相惜、沒有失之交臂,謝謝 你們在課業、生活上的關心、指導及鼓勵;更感謝指導教授 黎漢林講座 教授與曾國雄講座教授在課業及為人處事上的指導與分享,使我的博士班 生活更加充實及增廣見聞。 這些年來,最要感謝的還有我的家人,尤其是我的父親 邱洋浩先生、 母親 邱廖芸華女士,因為有您們的智慧、愛與鼓勵讓我的生命更加豐富 及順利。其次要感謝的是我的三姨媽 陳廖網市女士,感恩她幫我帶孩子, 讓我安心無虞。更要感謝我的最愛 陳生洋先生對我這五年來財務無限制 的支援與供應,提供我一個無後顧之憂的環境,使我得以完成我的夢想。 再來就是要感謝我的二個孩子,陳繹帆與陳宥嬨小朋友的無限配合。感謝 所有愛我的人長期以來在我求學過程中的支持及無怨無悔的付出。謹以本 論文獻給所有愛我及關心我的人。由於篇幅無法一一感謝在此抱歉! 邱婉瑜 謹誌于 新竹市 交通大學資訊管理研究所 2012 年 9 月Table of Contents
摘 要 ... i
Abstract ... iii
Acknowledgement ... v
Table of Contents ...vi
List of Tables ... viii
List of Figures ...ix
Chapter 1 Introduction ... 1
1.1 Motivation and problem statements ... 1
1.2 Research objectives ... 2
1.3 Research framework and methods ... 4
1.4 Contributions of this research ... 8
1.5 Research outline ... 9
Chapter 2 Literature review ... 10
2.1 Electronic commerce ... 10
2.2 E-store ... 11
2.3 Electronic commerce marketing analysis ... 11
2.4 Customer satisfaction ... 13
Chapter 3 Research framework and method ... 15
3.1 DANP (DEMATEL-based ANP) ... 15
3.1.1 DEMATEL technique for building an INRM ... 17
3.1.2 DANP for finding the influential weights in each criterion ... 21
3.2 VIKOR method ... 24
3.3 Grey relational analysis... 28
Chapter 4 Empirical case study of real e-stores ... 31
4.1 Descriptions of Problem ... 32
4.2 Measuring the relationship among dimensions and criteria to build an INRM ... 33
4.3 Influential weights of criteria in e-store management ... 36
4.4 Results and analysis in evaluation for e-store management performance ... 37
4.5 Discussions and building e-store business strategies ... 38
4.6 Using a grey relational model to evaluate e-store management degrees and coefficients ... 43
4.7 Using GRA method to evaluation and discussions ... 45
Chapter 5 Conclusions and remarks ... 49
References ... 53
Appendix B: The questionnaire ... 63
Appendix C: The research’s overview map ... 67
簡 歷 ... 68
List of Tables
Table 1. Reorganisation of the current research. ... 5
Table 2. Matrix G of direct relations for Fig. 10. ... 18
Table 3. After normalize the direct-influence matrix X ... 18
Table 4. The total-influence matrix Tc of Table 3. by math software. ... 19
Table 5. For example Table 4 vector r and vector s express the sum of the rows and the sum of the columns from the total-influence matrix Tc... 20
Table 6. Initial influential matrix G. ... 33
Table 7. Normalised direct-relation X ... 34 .
Table 8. Total-influential criteria matrix Tc. ... 34
Table 9. Total-influential dimensions matrix TD. ... 34
Table 10. Sum of influences given and received on dimensions and criteria. ... 35
Table 11. Unweighted supermatrix Wc. ... 36
Table 12. The weighted supermatrix W , produced by weighting the unweighted c* supermatrix Wc. ... 36
Table 13. Influential weights by stable matrix of DANP when power * lim(Wc) . 37 Table 14. Using VIKOR method computing performance values combined with the influential weights of the criteria according to the DANP. ... 37
Table 15. E-stores’ priority strategies. ... 42
Table 16. Performance values combined with influential weights by DANP and GRA. ... 44
Table 17. E-store strategies ... 47
Table A1. Group consensuses of the seven respondents on the degree of influence matrix G among the criteria. ... 62
Table A2. Group consensuses of the eight respondents on the degree of influence matrix G among the criteria. ... 62
List of Figures
Fig. 1: The MADM evaluation framework ... 3
Fig. 2: Consumer behaviour ... 4
Fig. 3. Reorganization of current research ... 6
Fig. 4: Research framework and process ... 7
Fig. 5. The research differs previous. ... 8
Fig. 6. The European online sales is growing ... 12
Fig. 7. The UK online sales is growing ... 12
Fig. 8. The USA online sales is growing ... 13
Fig. 9. Model procedure of the current research ... 15
Fig. 10. The directed graph. ... 17
Fig. 11.The total-influence of DEMATEL graph for Table 5. ... 20
Fig. 12. Aspired level, ideal point, and compromise solution ... 26
Fig. 13. Influential network relations map (INRM) ... 35
Chapter 1 Introduction
This chapter presents of this dissertation the motivation, problem statements,
research objectives, framework, methods, and contributions. These topics will be
described in the following sections.
1.1 Motivation and problem statements
E-stores have become an important retailing channel, and many such stores have
been established and are experiencing a continuous increase in sales. It has become
increasingly common for consumers to buy products and services from e-stores
because these types of stores provide them with a convenient and fast shopping
environment and high-quality products and services, saving people’s time and money.
E-store has become increasingly common for people to buy products from e-stores on
the Internet, since these stores offer convenient and speedy shopping twenty four
hours a day, seven days a week. With the advent of the Internet, stores are able to
offer consumers a wider choice of products and services with minimal effort and cost,
which helps shoppers to make better decisions and employ a more efficient
decision-making process (Peterson and Grembergen, 2003; Widing and Talarzyk,
1993). This process of buying, selling, or exchanging products, services, and
information via computer networks, including the Internet, is generally defined as
Electronic Commerce (EC) (Turban, et al., 2000). It goes without saying that a
well-developed and well-managed website is critical for the success of e-stores, and
the first priority for achieving this is to acquire an in-depth understanding of
consumer behaviour (Wu and Wang, 2006), particularly since their habits of shopping
in e-stores may be different from in traditional retail stores (Alba, et al., 1997; Huarng
Therefore, accurate knowledge of marketplace consumption is a critical factor of
a successful e-store. This article focuses on the assessment, improvement, and setting
of strategies to better meet customer needs. These needs are met by reducing
performance gaps introduced by interdependence and feedback problems among
dimensions and criteria, allowing the aspiration level to be achieved and promoting
customer satisfaction to bring people real happiness. It is essential for e-store
managers to know how to manage business and marketing strategies because the
success of the store depends on excellent management and accurate marketing
strategies.
1.2 Research objectives
Previous EC researchers have focused on the consumers’ motivations (Ganesh,
et al., 2010; Shang, et al., 2005), the shopping behaviour (Khare and Rakesh, 2011;
Tsao and Tseng, 2011), the intelligent agents (Liang, et al., 2012; Warkentin, et al.,
2012), the satisfaction-loyalty relationship (Balabanis, et al., 2006; Chen, 2012;
Polites, et al., 2012), and the risk (Chang and Tseng, 2011). This research focuses on
how to manage e-stores and how to create marketing strategies. Previous related
methods application have focused on influence (Jeng and Tzeng, 2012), assessment
(Chen and Tzeng, 2011), ranking (Hung, et al., 2011; Yang and Tzeng, 2011),
selection (Chen, et al., 2011b; Ho, et al., 2011; Liou, 2012; Liou, et al., 2011; Ozaki,
et al., 2011; Shen, et al., 2011), and improvement (Chen, et al., 2011a; Chiu, et al.,
2010; Liou, et al., 2012; Liou, et al., 2010; Liu, et al., 2011, 2012; Ou Yang, et al.,
2011; Tzeng and Huang, 2011; Wang and Tzeng, 2012). Thus, this study seeks a new
hybrid Multiple Attribute Decision Making (MADM) model (see Fig. 1.) combining
build an influential relationship among dimensions and criteria, DEMATEL-based
ANP (DANP) to find the influential weights, and VIšekriterijumsko KOmpromisno
Rangiranje (VIKOR) methods to assess performance, and grey relational analysis
(GRA) to find that how to closer the aspiration levels not only in ranking and
selection but also in improving and creating e-store marketing strategies to reduce
gaps in each dimension and criterion to promote the e-store environment and satisfy
customers’ needs. These processes can not only help e-store managers to understand customers’ wants and needs, they can also assist them in improving their products and service to reduce performance gaps in customer satisfaction by building an effective
e-store marketing strategy. Thus, this research seeks to propose a new hybrid VIKOR
and grey relational model to help e-store managers to understand their customers’
needs in order to improve their service and achieve their aspiration to develop their
e-store marketing strategies.
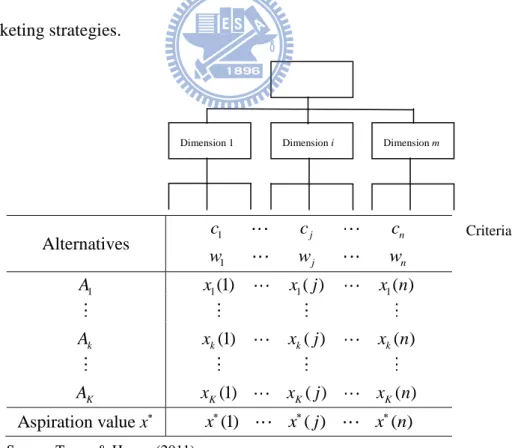
Alternatives c1 cj cn 1 j n w w w 1 k K A A A 1(1) 1( ) 1( ) (1) ( ) ( ) (1) ( ) ( ) k k k K K K x x j x n x x j x n x x j x n Aspiration value x x(1) x( )j x n( )
Source: Tzeng & Huang (2011)
Fig. 1: The MADM evaluation framework Dimension i Dimension m Dimension 1
1.3 Research framework and methods
This study primarily examines consumers’ criteria for the business-to-consumer electronic commerce (B2C e-commerce) of e-stores, focusing on consumer
satisfaction. E-store buyer behaviour refers to consumer behaviour, and the steps in
the consumers’ decision-making process can be found in most textbooks and journals, some of which describe these steps as need recognition, information search,
evaluation, purchase, and after-purchase evaluation (Chon, 1990; Gan, et al., 2006;
Gan, et al., 2005; Hanlan, et al., 2006; Pachauri, 2002; Robert and McEachern, 1998;
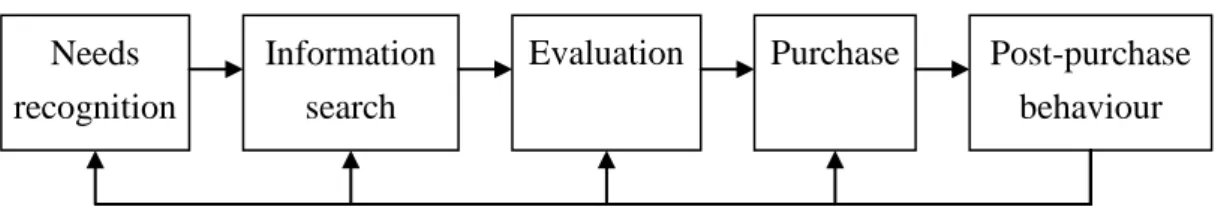
Wong and Hsu, 2008). Others propose that the steps as Fig. 2. are needs recognition,
information search, evaluation, purchase, and post-purchase behaviour (Lin, et al.,
2011; Tse and Yim, 2002). In fact, according to e-store customers’ behaviour,
including blog writing, Facebook reviews, and tendency to repurchase, the main
components of this process can be considered to be need recognition, information
search, evaluation, purchase, and post-purchase behaviour.
Source: Lin, et al., 2011; Tse & Yim, 2002
Needs recognition
Information search
Evaluation Purchase Post-purchase behaviour
Fig. 2: Consumer behaviour
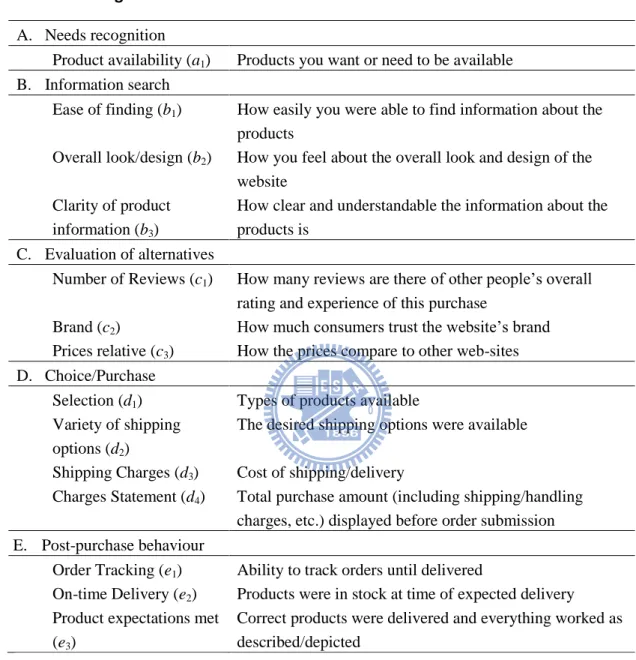
Based on these criteria, Bizrate.com and Alexa.com conducted surveys asking
respondents to rate retailers on 14 e-store attributes product availability, ease of
finding, overall look and design, clarity, number of reviews, brand, relative price,
selection, variety of shipping options, shipping charges, charge statement, order
tracking, on-time delivery, and expectations met (Gauri, et al., 2008). A detailed
intact criteria, which include five influential dimensions and fourteen criteria, need to
be considered (see Table 1 and Fig. 3.).
Table 1. Reorganisation of the current research.
A. Needs recognition
Product availability (a1) Products you want or need to be available
B. Information search
Ease of finding (b1) How easily you were able to find information about the
products
Overall look/design (b2) How you feel about the overall look and design of the
website Clarity of product
information (b3)
How clear and understandable the information about the products is
C. Evaluation of alternatives
Number of Reviews (c1) How many reviews are there of other people’s overall
rating and experience of this purchase
Brand (c2) How much consumers trust the website’s brand
Prices relative (c3) How the prices compare to other web-sites
D. Choice/Purchase
Selection (d1) Types of products available
Variety of shipping options (d2)
The desired shipping options were available
Shipping Charges (d3) Cost of shipping/delivery
Charges Statement (d4) Total purchase amount (including shipping/handling
charges, etc.) displayed before order submission E. Post-purchase behaviour
Order Tracking (e1) Ability to track orders until delivered
On-time Delivery (e2) Products were in stock at time of expected delivery
Product expectations met (e3)
Correct products were delivered and everything worked as described/depicted
Source: Engel et al., 1990; Robert & McEachern, 1998; Gauri et al., 2008
Having surveyed several Taiwan EC websites, Chang and Chen (2009) found
that, according to users, Yahoo.com, Yahoo auction, PChome.com, and Books.com
were the four top online shopping sites (Chang and Chen, 2009). Another study (To,
et al., 2007) found that the most popular website was Yahoo (45.1%), followed by
PChome (7.8%), Books.com (6.8%), and Ezfly (5.3%), which accounted for 65% of
most often visited were Yahoo! (30.1%), Unimall (17.4%), PChome (9.9%), Etmall
(9.4%), Books (6.7%), Payeasy (5.1%), Hermall (3.8%), Happybag (2.9%), Eztravel
(2.5%) and era ticket (2.4%) (Chang and Chen, 2008). Therefore, this study chooses
the three most popular e-stores (i.e., Yahoo, PChome, and Books) to demonstrate the
proposed method.
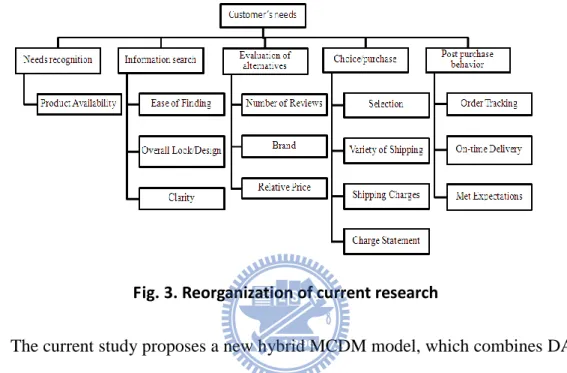
Fig. 3. Reorganization of current research
The current study proposes a new hybrid MCDM model, which combines DANP
(DEMATEL-based ANP) and VIKOR and grey relational analysis (GRA), to resolve
real life problems, using an expert group (high accuracy) to provide the perspective of
business enterprises. A DEMATEL technique is used to detect complex relationships
and build an influential network relations map (INRM) of the dimensions/criteria to
measure, evaluate and improve e-stores’ business strategies. The DANP makes it
possible to measure all tangible and intangible criteria in this new model. The basic
concept of an analytical network process (ANP) was adopted by this research in order
to overcome problems of dependence and feedback (Saaty, 1996) and the DANP
technique was used to determine the relative influential weights for improving the
traditional method, i.e. that an un-weighted supermatrix has equal weights.
Qualitative/quantitative measurements and an evaluation of comprehensive
aspiration levels and used the GRA to build an index of grey coefficients in the
e-store business strategy, and to bring the system index of grey coefficients closer to
the aspired level. Thus, the DANP combined the VIKOR with the GRA, constructs a
planned measurement model to develop and improve e-store marketing strategies to
satisfy consumers’ needs.
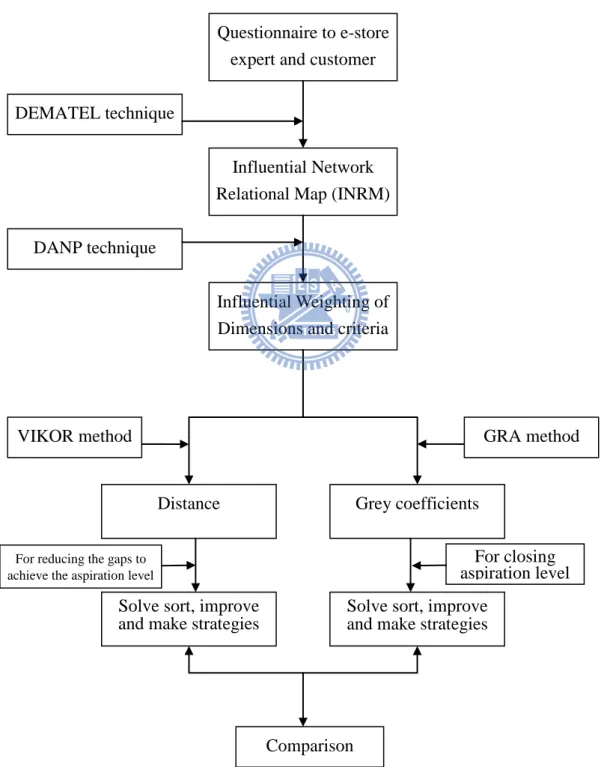
Questionnaire to e-store expert and customer
Influential Network Relational Map (INRM) DEMATEL technique
Influential Weighting of Dimensions and criteria DANP technique
Distance
VIKOR method GRA method
Grey coefficients
Solve sort, improve and make strategies
Solve sort, improve and make strategies For reducing the gaps to
achieve the aspiration level
For closing aspiration level
Comparison
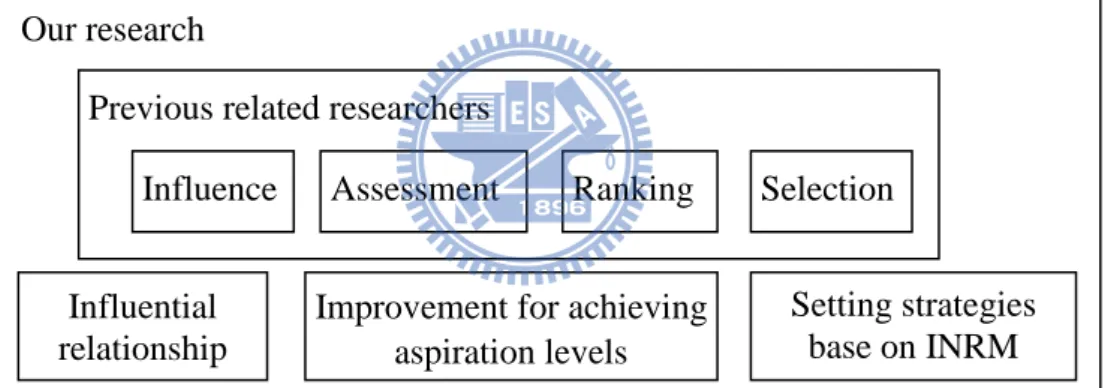
1.4 Contributions of this research
This idea is a new approach to solving real-world problems (Tzeng's group).
First, the traditional model assumes that the criteria are independent from the
hierarchical structure, but the relationships between dimensions and criteria are
usually mutually interdependent in the real world. Second, the relatively good
solutions provided by the existing alternatives are replaced by aspiration levels to fit
today’s competitive markets. Finally, the goal is to focus not only on “influence”, “assessment”, “ranking” and “selection” but also on “influential relationship”, “improvement for achieving aspiration levels” and “setting strategies base on INRM” to improve e-store performances (see Fig. 5.).
Our research
Improvement for achieving aspiration levels
Setting strategies base on INRM Previous related researchers
Influence Assessment Ranking Selection
Influential relationship
Fig. 5. The research differs previous.
An empirical study of three e-stores — Yahoo, PChome, and Books aims to
demonstrate the proposed new hybrid Multiple Criteria Decision-Making (MCDM)
model for ranking , improvement, and setting strategies. Because this study focuses
on the effects of certain influential relationships among dimensions and criteria in an
e-store business and the creation of marketing strategies for the e-store manager, this
study surveyed three e-stores to determine the best strategies for improving an e-store.
From the survey results, we found that prioritising the customers’ needs and giving
information searches, and evaluation of alternatives. Therefore, initial marketing
strategies can include advertisements and light products to meet the customers’ needs. Then, the e-store can create high-quality post-sales service programmes, offer fast
delivery of products, provide complete packaging, communicate after the purchase,
offer guarantees, and implement liberal returns policies to improve post-purchase
service.
1.5 Research outline
The remainder of this paper is organised as follows. Chapter 2 reviews the
consumer decision-making process and evaluation framework, including e-store
business criteria and performance. Chapter 3 provides a brief introduction of the
DEMATEL technique, the DANP influential weights and the VIKOR method with the
GRA method used to establish a new hybrid MCDM model to resolve problems of
interdependence and feedback. An empirical study of Yahoo, PChome, and Books is
presented in Chapter 4 to demonstrate the proposed model and, finally, conclusions
Chapter 2 Literature review
This chapter presents of this thesis relation literature include electronic
commerce, E-store, electronic commerce marketing analysis, and customer
satisfaction. These topics will be described in the following sections.
2.1 Electronic commerce
Electronic commerce (EC) is defined as the process of buying, selling, or
exchanging products, services, advertisements, and information via electronic
communication technologies (the Internet and www, PDAs (Personal Digital
Assistants), smartphones, and tablet computers). Those technologies facilitate the
manufacturing of products and the provision of services to satisfy the wants and needs
of consumers (Ba, et al., 1997; Liu, et al., 2012; Reedy and Schullo, 2004). EC
includes e-stores, and because shopping is a complex behaviour composed of rational
choices, amusement, and social communication (Wei, et al., 2008; Wu and Wang,
2006), understanding consumers’ wants and needs is critical for the stores’ successful
management and development (Fransi and Viadiu, 2007; Wu and Wang, 2006). This
understanding particularly applies to e-stores, in which consumers’ shopping
behaviour may be different from that in traditional brick-and-mortar stores (Shang, et
al., 2005; Yan, et al., 2010). Therefore, e-store management issues are a hot topic
because such stores seek to extend their consideration sets and improve consumers’ welfare, and the quality and quantity of individually customised interfaces can
facilitate a better, more efficient purchase decision-making process (Peterson and
2.2 E-store
An e-store markets and sells products or services offered by a company (Nistor,
et al., 2010). E-stores are becoming critically important to online retailers, and they
have become important parts of retailer strategy (Ganesh, et al., 2010). Therefore,
knowing the needs of customers and how to meet those needs is important. E-stores
are a highly visible, well-received, and popular type of e-commerce (Chiou and Pan,
2009; Elliott, 2002) that sells products and services online (Cahill, 1995; Riggins and
Rhee, 1998). E-stores are part of the e-commerce and retail channel, which includes
online retailers, online stores, online shops, e-shops, and any virtual shopping
websites that sell products or services from businesses to customers, such as Amazon
(Hillebrand, et al., 2010; Singh, 2002; Wong and Hsu, 2008). Amazon.com was
established in 1994 during an era of rapid growth for the Internet, which quickly
became a key channel for the sale of products and services (Asllani and Lari, 2007;
Kim, et al., 2005; Tang and Tzeng, 1998; Tang, et al., 1999). Consequently, e-store
management is a key issue for the development of e-commerce.
2.3 Electronic commerce marketing analysis
The number of e-stores has grown quickly because they are convenient,
eliminate sales pressure, and save time. The online retail sales of European e-stores
increased 18% from 2009 to 2010 (Carini, et al., 2011). Forrester research forecasts as
Fig.6. that European online sales will have a compound annual growth rate of 12%,
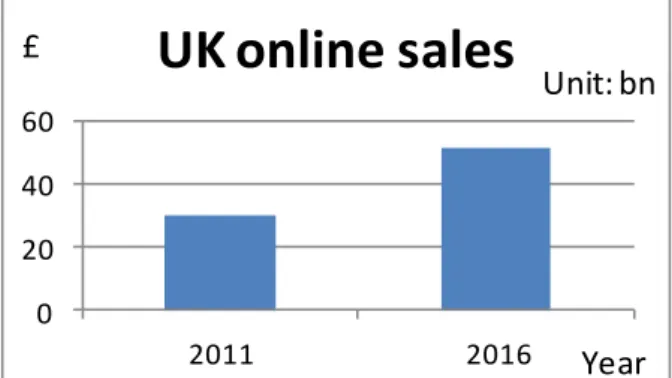
from €96.7 bn (£82.0 bn) in 2011 to €171.9 bn (£145.8 bn) in 2016 (Chloe, 2012; Gill, et al., 2012). The UK Office for National Statistics reports that e-store sales
increased by 13.1% in March 2011 (ONS, 2011). Forrester research forecasts UK
£51.0 bn in 2016 (see Fig. 7.), and the UK’s proportion of online shoppers will
increase from 75% of the population in 2011 to 85% in 2016. The proportion of online
shoppers in Sweden will increase from 72% of the population in 2011 to 86% in 2016
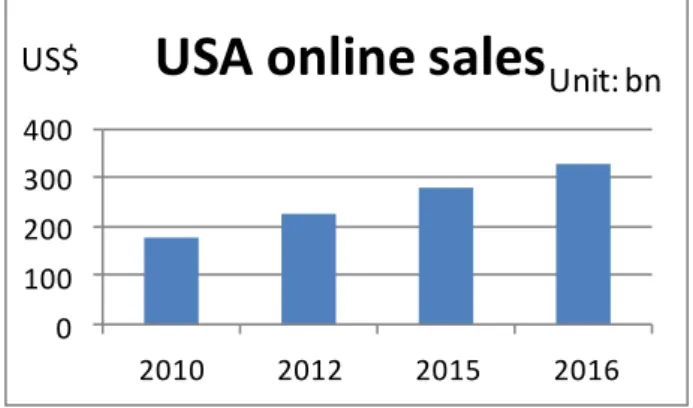
(Chloe, 2012; Gill, et al., 2012). In the US, Forrester research forecasts that online
retail sales are expected to grow from US$176.2 bn in 2010 to US$278.9 bn in 2015,
which is an increase of more than 10% (Mulpuru, et al., 2011). Forrester research
forecasts note that U.S. online shoppers will have a compound annual growth rate of
15%, from 167 million people in 2012 to 192 million people in 2016, and it is
predicted that each consumer’s spending will grow by 44%, from US$1,207 in 2012 to US$1,738 in 2016. Therefore, the total sale value for e-stores will increase by 45%,
from US$226 bn in 2012 to US$327 bn in 2016 (see Fig. 8.) (Mulpuru, et al., 2012;
Rueter, 2012). All available reports indicate that sales by e-stores are growing rapidly
in all areas. 0 50 100 150 200 2011 2016
European online sales
Year €
Unit: bn
Fig. 6. The European online sales is growing
0 20 40 60 2011 2016
UK online sales
Year £ Unit: bn0 100 200 300 400 2010 2012 2015 2016
USA online sales
US$
Unit: bn
Fig. 8. The USA online sales is growing
2.4 Customer satisfaction
Customer satisfaction has been considered most important issues for marketers
and customer researchers (Lee, et al., 2003; Oliver, 2010; Sheth, 1973). Companies
need to develop strategies that help company develop sustainable business practices
(Langella, et al., 2012). E-store should to meet customers’ needs (Porter, 2001) and
increase customer satisfaction by creating customer value in consumer marketing
(Chen and Dubinsky, 2003; Ponter, 1998). Loyal customers that indulge in repeat
purchases are the bedrock of any business (Albert, 2002). Customer satisfaction is
important mostly because of its indirect influence on the profitability of companies
(Ažman and Gomišček, 2012); satisfied customers tend to make not only more
purchases but also repeat purchases (Bearden and Teel, 1983; Siddiqi, 2011;
Szymanski and Hise, 2000), and customer satisfaction has become a key element of
many companies’ business strategies (Ellinger, et al., 2012). Therefore, understanding the criteria that influence customer satisfaction is important not only to describe the
actual situation but also to plan improvements, and actions (Tarantola, et al., 2012).
Marketing activities should be designed to increase customer satisfaction
and customer satisfaction to create dimensions and criteria that show the influence
Chapter 3 Research framework and method
This research uses the DEMATEL technique and combines a DANP with a
VIKOR method and GRA method to establish a new hybrid MCDM model to address
the problems of interdependence and feedback among certain criteria and reduce the
performance gap in each dimension and criterion. The DEMATEL technique is used
to build an influential network relations map (INRM), and the DEMATEL-based
Analytic Network Process (DANP) is expected to obtain the influential weights using
the basic concept of Analytic Network Process (ANP) (Saaty, 1996). Then, the
VIKOR method and GRA method with influential weights (DANP) are used to
integrate the performance gaps from criteria to dimensions and overall. Then, it is
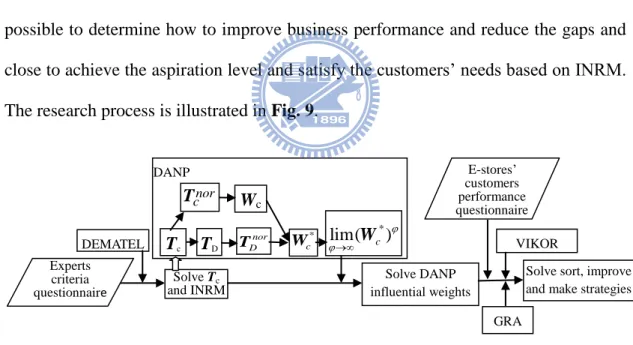
possible to determine how to improve business performance and reduce the gaps and
close to achieve the aspiration level and satisfy the customers’ needs based on INRM.
The research process is illustrated in Fig. 9.
DANP * c W nor D T Experts criteria questionnaire DEMATEL Solve Tc and INRM Tc Wc TD * lim( c) W Solve DANP influential weights
Solve sort, improve and make strategies VIKOR E-stores’ customers performance questionnaire (Ak) GRA nor c T
Fig. 9. Model procedure of the current research
3.1 DANP (DEMATEL-based ANP)
This study seeks to assess business performance, which usually consists of
multiple dimensions and criteria and to determine the influential weights of those
column by a number of clusters so that each column achieves exact unity. This
process implicitly assumes that each cluster has the same weight. However, it is
well-known that the effect of one cluster on the other clusters may be different in
degree. Thus, the traditional ANP assumption that each cluster is of equal weight in
obtaining a weighted supermatrix is not reasonable; consequently, the DANP
influential weights can improve this shortcoming and obtain results based on the basic
concept of the ANP from a total-influential matrix Tc and TD by using the
DEMATEL technique. Therefore, the DEMATEL technique is used to build an
INRM for each criterion and dimension and also to improve the normalisation process
of the traditional ANP. The DANP is an appropriate tool to include interaction and
interdependence among the dimensions and criteria that appear in the cases of real
world problems. According to the concrete characteristics of objective affairs, the
methodology can verify the interdependence of variables and attributes, building a
relationship that reflects those characteristics with an essential system and
evolutionary trend (Jeng and Tzeng, 2012; Liou, 2012; Liu, et al., 2012; Ou Yang, et
al., 2011; Shen, et al., 2011; Tzeng and Huang, 2011; Wang and Tzeng, 2012; Yang
and Tzeng, 2011). This technique has been successfully applied to many situations,
such as improving marketing, tourism policy, airline partner selection, information
security risk control, and environment watershed plans (Chen, et al., 2011b; Chiu, et
al., 2010; Liou, 2012; Liu, et al., 2012; Ou Yang, et al., 2011).
The steps for building an INRM using the DEMATEL technique (steps 1-4) and
finding the influential weights of a DANP based on a total-influential matrix (steps
3.1.1 DEMATEL technique for building an INRM
Step 1: Calculate the direct-influence matrix by scores.
An assessment of the relationship between each mutual influence criterion is
made according to the opinions of knowledge-based experts, using a scale ranging
from 0 to 4, with scores represented by natural language: ‘absolutely no influence’ (0),
‘low influence’ (1), ‘medium influence’ (2), ‘high influence’ (3), and ‘very high influence’ (4). The knowledge-based experts are required to indicate the direct influence by a pairwise comparison, and if they believe that criterion i has an effect
and influence on criterion j, they should indicate this by g Thus, the matrix cij.
[gcij]n n
G of direct relationships can be obtained (see Eq. (1)). All diagonal of
criteria are zero by pairwise comparison.
11 1 1 1 1 j n c c c i ij in c c c n nj nn c c c g g g g g g g g g G (1)
For example: a influence d is 1 units, d influence a is 3 units, b influence a is 2 units,
b influence c is 4 units, and c influence d is 3 units.
Fig. 10. The directed graph.
a b c d 3 1 3 4 2
Table 2. Matrix G of direct relations for Fig. 10. Crteria a b c d Total a 0 0 0 1 1 b 2 0 4 0 6 c 0 0 0 3 3 d 3 0 0 0 3 Total 5 0 4 4 -
Step 2: Normalise the direct-influence matrix G.
The normalised matrix X is acquired by using Eq.(2). The maximum total of
rows or columns is one.
v X G (2) where , 1 1 1 1 min , , max n ij max n ij i j i j c j i c v g g
, {1, 2,..., } i j n For example: 1 6 v in Table 2. 1 0 0 0 6 0 0 0 1 2 4 0 0 2 0 4 0 1 6 6 0 0 0 3 3 6 0 0 0 6 3 0 0 0 3 0 0 0 6 v X G ,Table 3. After normalize the direct-influence matrix X
a b c d Total a 0 0 0 0.167 0.167 b 0.333 0 0.667 0 1 c 0 0 0 0.5 0.5 d 0.5 0 0 0 0.5 Total 0.833 0 0.667 0.667
Step 3: Attain a total-influential matrix Tc.
When the normalised direct-influential matrix X is obtained, the total-influential matrix Tcof the INRM can be obtained from Eq.(3), in which I
denotes the identity matrix,
2 3 2 1 1 1 1 ... ( ... )( )( ) ( )( ) ( ) , when lim [0] c n n T X X X X X I X X X I X I X X I X I X X I X X (3) where ij c n n x X , 0 xcij1, 1 0 n cij 1 j x
and 1 0 n ij 1 c i x
, and at least one row or column of the summation (but not all) equals one; then, limX [0]n n canbe guaranteed.
For example:
Table 4. The total-influence matrix Tc of Table 3. by math software.
Criteria a b c d Total (r) a 0.091 0 0 0.182 0.273 b 0.545 0 0.667 0.425 1.637 c 0.273 0 0 0.546 0.819 d 0.546 0 0 0.091 0.637 Total (s) 1.455 0 0.667 1.244 -
Step 4: Analyse the results.
At this stage, the row sums and the column sums of the matrix components are
separately expressed as vector 1
1 ( ,..., ,..., ) n ij c i n j t r r r
r and vector 1 1 ( ,..., ,..., ) n ij c j n i t s s s
s by using Eqs. (4)-(5). Let i j and i j,
1, 2,...,n
; the horizontal axis vector (risi) is then defined by adding ri to si, to illustrate thesubtracting ri from si, which may divide the criteria into a causal cluster and an
affected cluster. In general, when (risi) is positive, the criterion is part of the causal group; i.e., criterion i affects other criteria. By contrast, if (risi) is negative, the
criterion is part of the affected group; i.e., criterion i is influenced by other criteria.
Therefore, a causal graph can be achieved by mapping the data set of (risi,ri si),
the so-called INRM, to provide a valuable approach to decide how the preferred
values in each dimension and criterion can be improved based on the INRM,
[ ]ij , c tc n n T i j,
1, 2,...,n
1 1 1 1 ( ,..., ,..., ) n ij i c c i n j t n t n r r r
r (4) 1 1 1 1 ( ,..., ,..., ) n ij j c c j n it n t n s s s
s (5) For example:Table 5. For example Table 4 vector r and vector s express the sum of the rows
and the sum of the columns from the total-influence matrix Tc. r s ri + si ri - si Note
a 0.273 1.455 1.728 -1.182 affected b 1.637 0.000 1.637 1.637 cause c 0.819 0.667 1.486 0.152 cause d 0.637 1.244 1.881 -0.607 affected
From Fig. 11. we know, the b affects c, d and a. The c affects d and a. The d affects a. The b and c is cause. The d and a is affected.
where vector r and vector s express the sum of the rows and the sum of the columns from the total-influential matrix Tc [ ]tcij n n , respectively, and the
superscript denotes the transpose (Chen, et al., 2010). Two different total influence matrices are then applied. The first one, ij
c tc n n
T (see Eq. (6)), pertains to n
criteria, while the second one, ij D tD m m
T , is devoted to m dimensions (clusters)
from Tc (see Eq. (9)).
1 11 11 1 1 11 12 1 1 1 1 2 1 2 11 1 1 1 1 ... ... ... ... ... ... j m n j jnj m mnm n i i i ini m m m mnm D D D c c c c c c c c j m D c c c c c i ij im c D c c c c c c m mj mm c D c c c c T T T T T T T T T T (6)
3.1.2 DANP for finding the influential weights in each
criterion
Step 5: Find the normalised matrix nor c
T by dimensions and clusters.
Normalise Tc with the total degrees of effect and influence of the dimensions
and clusters to obtain nor c
1 11 11 1 1 11 1 1 11 12 1 1 1 1 2 1 1 2 1 ... ... ... ... ... ... j m n j jnj m mnm j m n i ij i i im i ini m m m mj mm m mnm D D D c c c c c c c nor nor nor c D c c c c c
nor c nor nor nor
D
c c c c
c c
c nor nor nor
D c c c c T T T T T T T T T T (7)
Step 6: Build an unweighted supermatrix Wc.
Then, the total-influential matrix is normalised into a supermatrix according to
the interdependence between the relationships of the dimensions and clusters to obtain
an unweighted supermatrix, Wc, as shown in Eq.(8).
1 11 11 1 1 11 1 1 1 1 1 11 1 1 1 1 j m n j jnj m mnm n i i ini m m mnm D D D c c c c c c c i m D c c c c c nor j ij mj D c c c c c c c m im mm D c c c c W W W W T W W W W W W (8)Unweighted supermatrix Wc is the matrix transposed from nor c
T (basic concept from the ANP by Saaty (1996), but different from the traditional ANP). If a
blank or 0 is shown in the matrix, this means that the dimensions and criteria are
independent.
Step 7: Find the normalised total-influential matrixTDnor.
The total-influential matrix TD needs to be normalised by dividing it by the
following formula: 1 m i ij D j D t
t1 1 11 1 1 1 1 1 1 1 = D D D D D D D D D m j j m j D D m i ij im ij i D j D D m mj mm m mj m D D j t t t t t t t t t t t t t t t
T (9)Thus, the total-influential matrix can be normalised and presented as TDnor. Then,
the sum of each row can be defined as
1
m
i ij
D j D
t
t , where i1,...,m, and TD can be normalised by the rows of sums by dividing the elements in each row by the sumof the row to obtain as in Eq. (9). Therefore, a total-influential matrix TD can be
normalised and represented as TDnor. TDnor tDij /tDi m m , as in Eq. (10). Then, each
row of the normalised nor D
T can be summed to equal one, so that
1 1 ij m nor D j t
. 1 1 11 1 1 11 1 1 1 1 1 1 1 / / / / / / / / / j m ij i im mj m mm nor nor nor j m D D D D D D D D Dnor i i ij i im i nor nor nor
D D D D D D D D D D
m m mj m mm m nor nor nor
D D D D D D D D D t t t t t t t t t t t t t t t t t t t t t t t t t t t T (10)
Step 8: Find the influential weights of the DANP.
The total-influential matrix Tc needs to be normalised by dividing the
dimension and cluster (Eq. (9)), so Tc is normalised by summarising the row by
dimensions and clusters to obtain Tnor
c . An unweighted super-matrix Wc can be
obtained by transposing nor c
T , i.e., Wc
Tcnor . Using (Eq. (11)), a weighted super-matrix Wc* (improving the traditional ANP by using equal weights to make itappropriate for the real world) can be obtained by the product of nor D
* nor
c D c
W T W (Eq. (11)). This result demonstrates that these influential level values
are the basis of normalisation to determine a weighted super-matrix.
1 1 11 1 1 11 1 1 * 1 1 i m j ij mj m im mm nor nor nor i m D c D c D c
nor nor j nor ij nor mj
c D c D c D c D c
nor m nor im nor mm
D c D c D c t t t t t t t t t W W W W T W W W W W W W (11)
Step 9: Obtain the DANP.
Limit the weighted super-matrix by raising it to a sufficiently large power until it converges and becomes a long-term stable super-matrix to obtain global
priority vector, which defines the influential weights w(w1,...,wj,...,wn) from lim( c)φ
φ
W for the criteria.
3.2 VIKOR method
The VIKOR method was developed for the multi-criteria optimisation of
complex systems. It determines the compromise ranking list and the compromise
solution, and the weight stability intervals for the preferred stability of the
compromise solution can be obtained from the initial weights given by the AHP or
ANP in the traditional method. This traditional method focuses on ranking and
selection from a set of alternatives in cases of conflicting criteria. It introduces a
multi-criteria ranking index based on the particular measure of “closeness” to the
“ideal” solution (Lin, et al.; Liou, et al., 2010; Opricovic, 1998; Opricovic and Tzeng, 2004; Tzeng, et al., 2002). This study focuses on improving this method to the
aspiration level and knowing how to improve and create marketing strategies.
criterion, a compromise ranking can be obtained by comparing the measure of
closeness to the ideal alternative in the traditional approach. The multi-criteria
measure for compromise ranking is developed from the Lp metric which plays an aggregating role in a compromise programming method (Yu and Seinfeld, 1973;
Zeleny, 1982).
The VIKOR was able to distinguish the three e-stores to determine their gaps. In
a traditional VIKOR, the positive ideal point is set as the highest performance score
among all alternatives (the larger is the better), i.e.; fj*max
fkj |k 1, 2,...,K
in this case. Likewise, the negative ideal point is set as the lowest performance scoreamong all alternatives, when smaller is worst; i.e., fj min
fkj |k 1, 2,...,K
in this case. However, in this study, a new technique for improving the VIKOR methodis proposed and described as follows. The alternatives are denoted A1,...,Ak,...,AK;
j
w is set as the weight of the j- th criterion, expressing the relative influential
weight of the criterion j by the DANP based on influential matrix T from the
DEMATEL technique to make it applicable to the real-world situation, where
n
j1,2,..., , and n is the number of criteria. The rating performance scores are
normalised by the best value and the worst value; for example, the scale performance
scores from 0 (the worst value, fj 0
) to 10 (the best value, called the aspiration
level, * 10
j
f ), and the scores of the j- th criterion are denoted by fkj for an alternative Ak as gap y . The new VIKOR is more appropriate to the analysis of kj
real-world situations. These models can be used to resolve other real business
questions.
Step 1: Finding the normalised gap kj y = * * (| fj fkj|) / (| fj fj|) (12) where * j
f is the best value ( *
j
f is set as the aspiration level) and fj is the worst
value ( fj is set as the worst value or the so-called tolerable level) of all criterion
functions, j1, 2,...,n. These concepts are different from the traditional approach
* max j kj k f f and j min kj k
f f , in which higher-valued performance is better because they avoid “choose the best among inferior choices, options, or alternatives (i.e., pick the best apple among a barrel of rotten apples)” problems. Thus, this performance definition differs from the traditional approach. It is more appropriate for
the empirical business analysis of e-stores in the real world, to ascertain how the
normalised scale of the gap, y , can be reduced to zero (0) when the best value is set kj
with no gap, the normalised scale of the gap y is set to be one (1), and the worst kj
value is set with the largest gap (see Fig. 12.).
Pareto
compromise Ideal point Aspired level Gap and index with improving
Step 2: Computing the gap for minimal and the maximal gap for priority
improvement.
The general form of Lp metric can be written as follows:
1/ 1 , 1 ; 1, 2,..., . p n p p k j kj j L w y p K
k (13)In addition to applying the above form of Lp metric, the VIKOR method also uses Lkp1, which is shown as the average gap Ek in Eq. (14), and Lpk, which is shown as the maximal gap Qk, to improve the priority in Eq. (15).
1 1 n p k k j j kj E L
w y ,k (14)
max | 1, 2,..., , p k k kj j Q L y j n k (15)How can the smaller average gap Ek be better? The average gap (called the
group utility) is emphasised in the case of p1. The importance of individual regrets or gaps (maximum regrets or gaps should be improved by their priority in total and by
each p dimension) rises as the value of parameter p increases when p . The compromise solution minkLkp will be chosen because its value is closest to the ideal
or aspiration level. The usually applied expression EkminkEk is therefore changed because the best gap Ek is zero (i.e., Ek0), and the commonly utilised expression Ek maxk Ek is changed because the worst value of Ek is one (i.e.,
1
k
E ). The expression QkminkQk is similarly changed because the best gap Qk
is zero (i.e., Qk0), and the expression Qk maxkQk is changed because the worst value of Qk is one (i.e., Qk 1).
Step 3: Obtaining the comprehensive indicator Uk
Based on the above concepts, the comprehensive indicator Uk of the
compromise VIKOR can be written as Eq. (16) from the traditional form
*
*
*
*
/ 1 /
k k k
U E E EE Q Q QQ (16)
Then, based on the concept above, the best situation, when Ek 0and Qk 0, and the worst situation, when Ek 1 and Qk 1, can be rewritten as follows:
1
k k k
U E Q (17)
This paper seeks to combine the influential weights of the DANP with the
VIKOR method to determine how to minimise the average gap (or regret) and
prioritise improvement in the maximum gap overall and in each dimension based on
the INRM by the DEMATEL technique. Thus, this study focuses on how to improve
and reduce the performance gaps to achieve the aspiration level based on INRM.
3.3 Grey relational analysis
Ever since Deng (Deng, 1982) proposed the grey theory, related models have
been developed and applied to MCDM problems. Similar to the fuzzy set theory, the
grey theory is a practical mathematical approach which can be used to deal with
systems control, selecting vendor, modeling, predictions, and decision-making (Chiou
and Tzeng, 2001; Deng, 1985, 1986; Liou, et al., 2012; Liu, et al., 2012; Wang and
Tzeng, 2012). In this research, a GRA combined with DANP is used to resolve the
relative influential weights of interdependence and feedback problems among
dimensions/criteria and, although the traditional GRA of weights (by AHP) is
section contains a brief review of the calculation process for the grey relational model,
and this research modifies the definitions of Chiou and Tzeng (Chiou and Tzeng,
2001).
A sequence of data called an ‘aspiration level’ is set, and a degree-index coefficient of a performance value (ex., Eq. (18) in xk( )j ) in each criterion (j) of
alternative (k) is built to attain the aspiration level (ex., Eq. (18) in x( )j ). This
degree-index coefficient ( ( ),x j x j k( )) is called the “grey relational coefficient” in order to know which criterion should be improved to come close to the aspiration
level (target). The ‘aspiration value’ in this paper is set at 10 points for the value of each criterion, and the performance matrix Eq. (18) of each criterion can be obtained
by questionnaires using a scale from 0 points (completely unsatisfactory) to 10 points
(extremely satisfactory). Therefore, in this research, 10 points is set as the aspiration
level and zero (0) points as the worst value. How the aspiration level can be achieved
differs from the traditional approach (see Fig. 12.).
Let the initial relationship matrix be a K n matrix, where there are K
alternatives and n criteria, obtained by surveying the relationship as follows:
1 1 1 1 1 1 * * * * Criteria Alternatives (1) ( ) ( ) (1) ( ) ( ) (1) ( ) ( ) Aspired values (1) ( ) ( ) j n j n k k k k K K K K c c c w w w x x x j x n x x x j x n x x x j x n x x x j x n (18)
Therefore, the degree-index coefficient of a grey relational model for the aspiration
min min | ( ) ( ) | max max | ( ) ( ) | ( ( ), ( )) | ( ) ( ) | max max | ( ) ( ) | k k k j k j k k k k j x j x j x j x j x j x j x j x j x j x j (19)
then the integrating (fusing) degree-index of the grey relational model can be
obtained, and the larger it is the better (shown as the integrating/fusing degree-index
of coming close to the aspiration value).
1 ( , ) ( ( ), ( )) n k j k j x x w x j x j
, (20)where jth denotes jth criterion and j1, 2,..., ;n k denotes th k alternative and th
1, 2,..., ;
k K the influential weight wj can be obtained by ANP based on DEMATEL
(DANP), when the criteria are interdependent and feedback problems in the real